Upgrade to Pro — share decks privately, control downloads, hide ads and more …

Introduction to Prometheus

Avatar for Binh Le Binh Le
November 23, 2017

Introduction to Prometheus

My talk at 1st Singapore Prometheus Meetup Nov 17

Avatar for Binh Le

Binh Le

November 23, 2017

Other Decks in Technology

Transcript

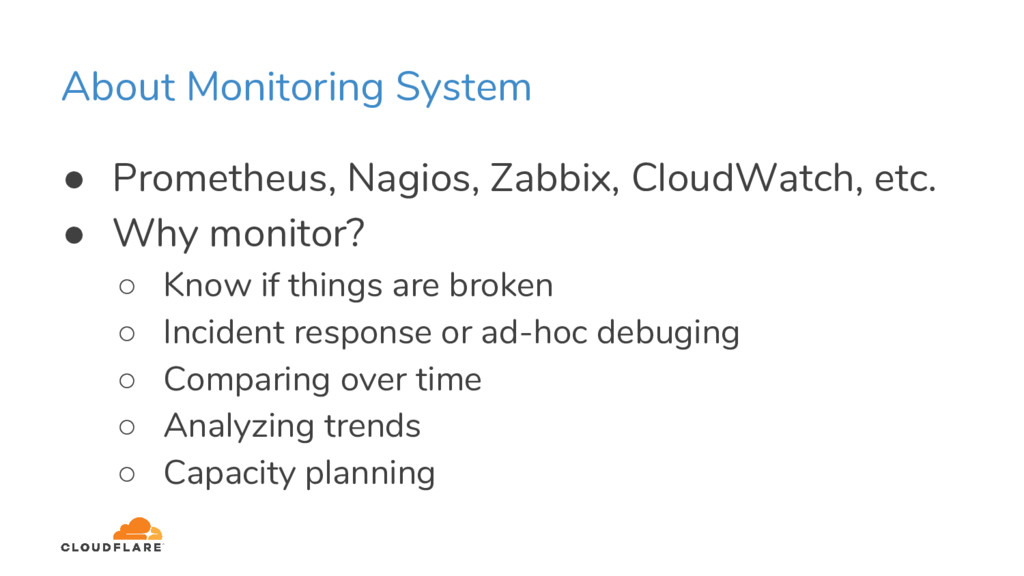
  1. About Monitoring System • Prometheus, Nagios, Zabbix, CloudWatch, etc. •

    Why monitor? ◦ Know if things are broken ◦ Incident response or ad-hoc debuging ◦ Comparing over time ◦ Analyzing trends ◦ Capacity planning
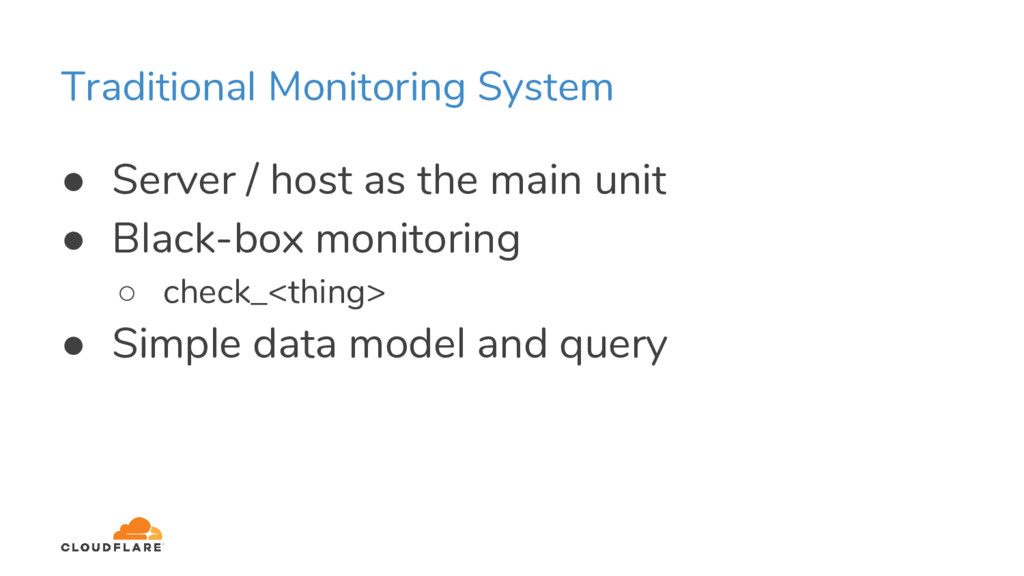
  2. Traditional Monitoring System • Server / host as the main

    unit • Black-box monitoring ◦ check_<thing> • Simple data model and query
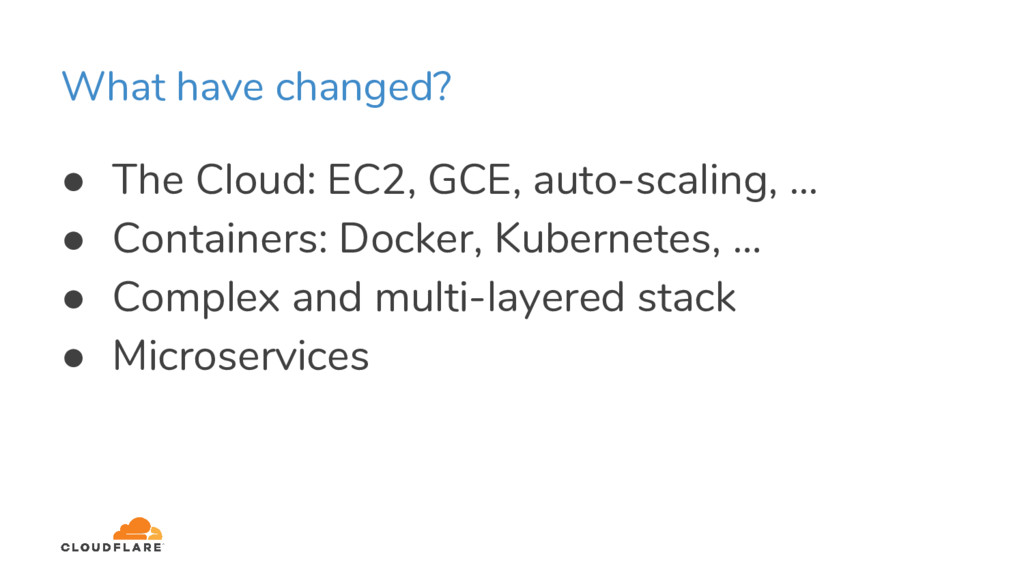
  3. What have changed? • The Cloud: EC2, GCE, auto-scaling, ...

    • Containers: Docker, Kubernetes, … • Complex and multi-layered stack • Microservices
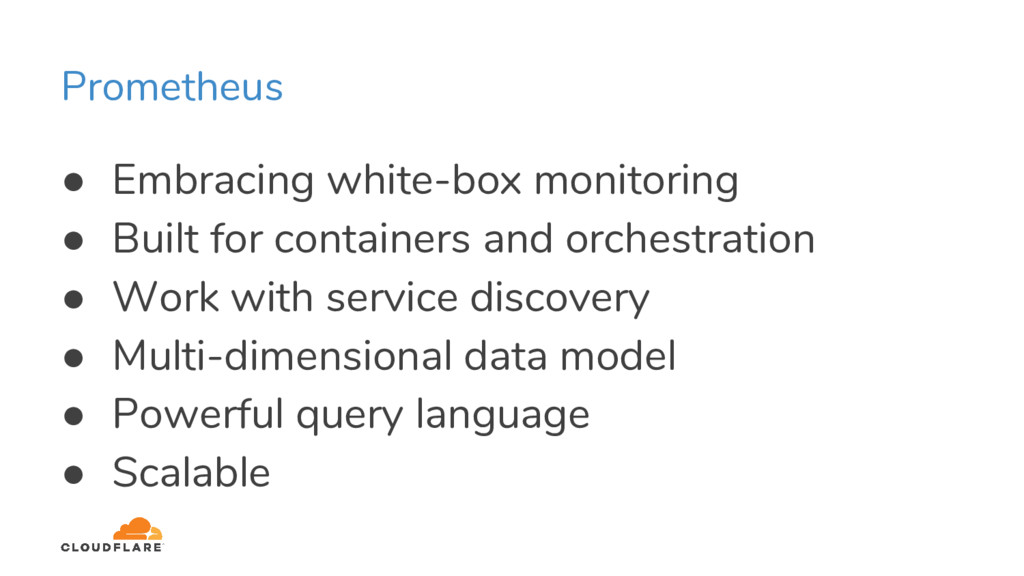
  4. Prometheus • Embracing white-box monitoring • Built for containers and

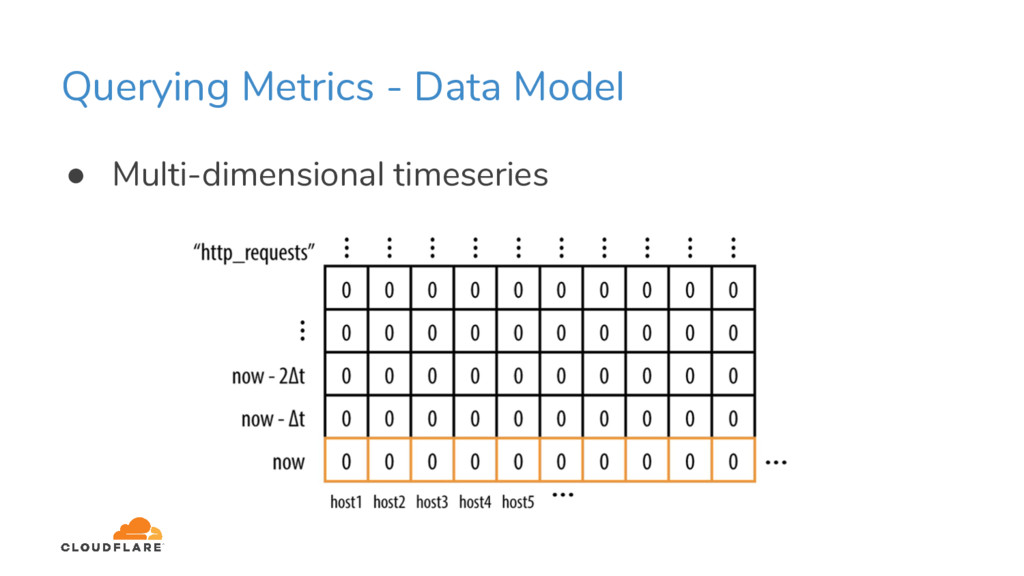
    orchestration • Work with service discovery • Multi-dimensional data model • Powerful query language • Scalable
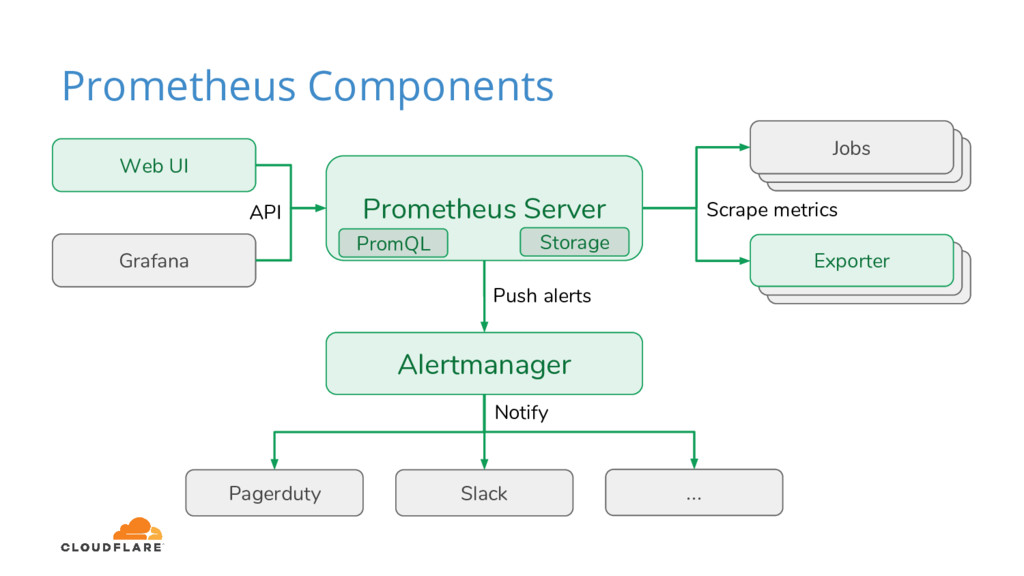
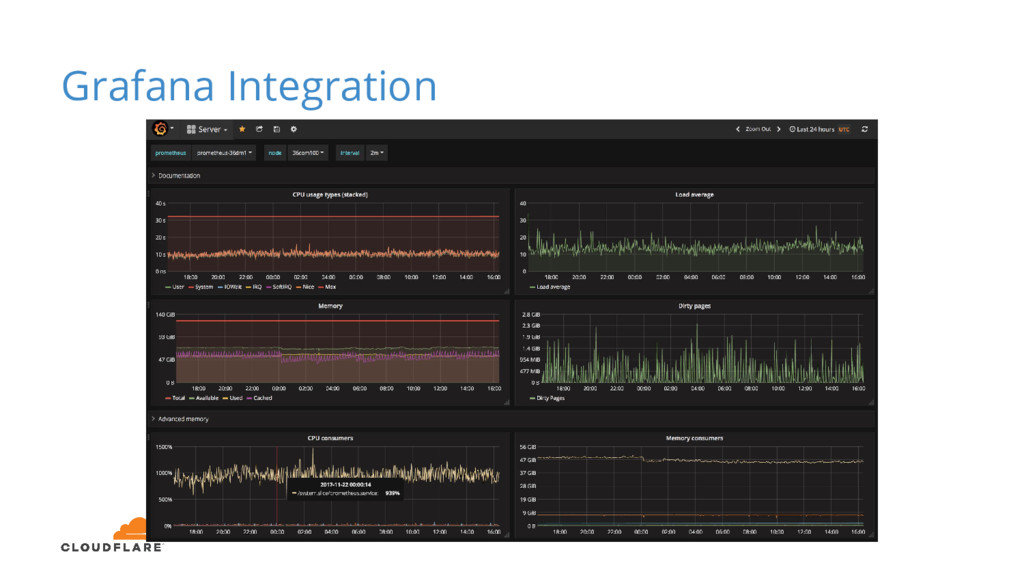
  5. Services Services Prometheus Server Prometheus Components Jobs Alertmanager Services Exporter

    Pagerduty Slack ... Grafana Web UI Push alerts Notify Scrape metrics Exporter API Storage PromQL
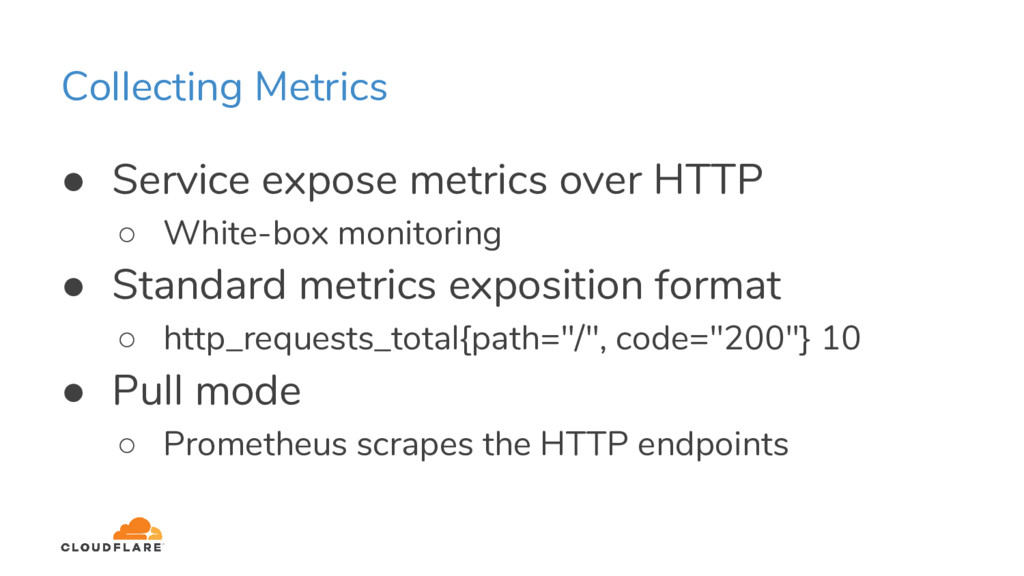
  6. Collecting Metrics • Service expose metrics over HTTP ◦ White-box

    monitoring • Standard metrics exposition format ◦ http_requests_total{path="/", code="200"} 10 • Pull mode ◦ Prometheus scrapes the HTTP endpoints
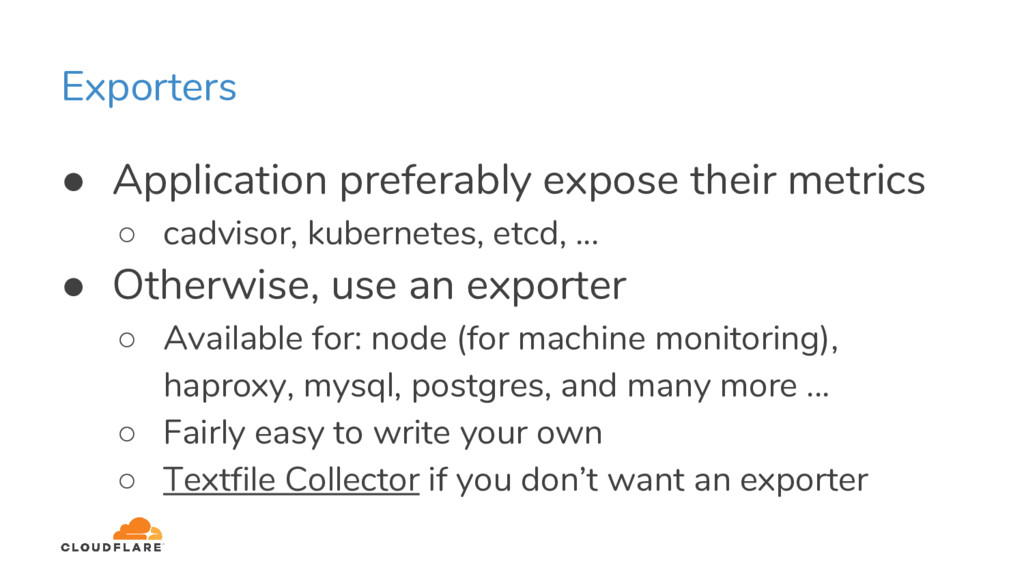
  7. Exporters • Application preferably expose their metrics ◦ cadvisor, kubernetes,

    etcd, ... • Otherwise, use an exporter ◦ Available for: node (for machine monitoring), haproxy, mysql, postgres, and many more ... ◦ Fairly easy to write your own ◦ Textfile Collector if you don’t want an exporter
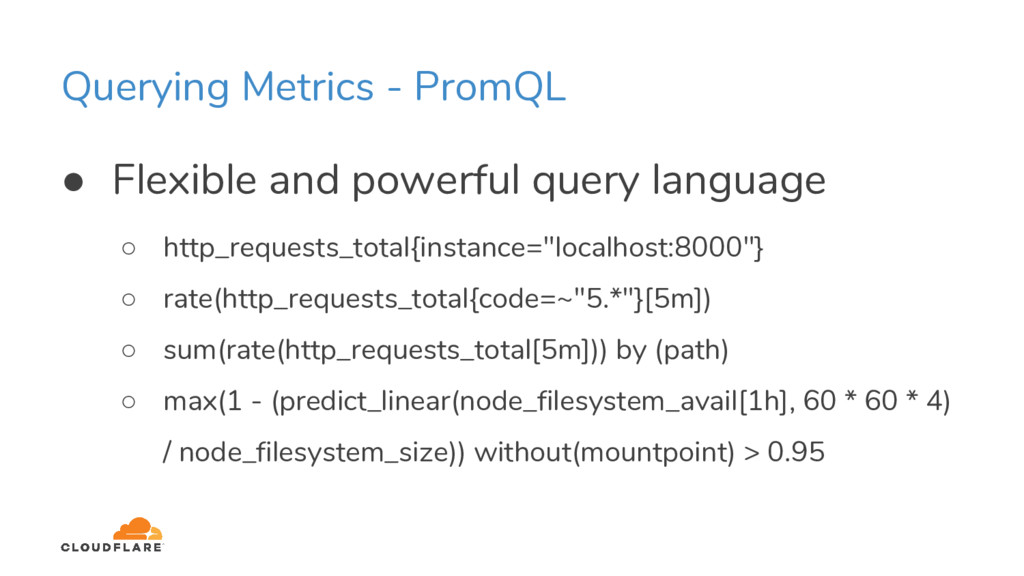
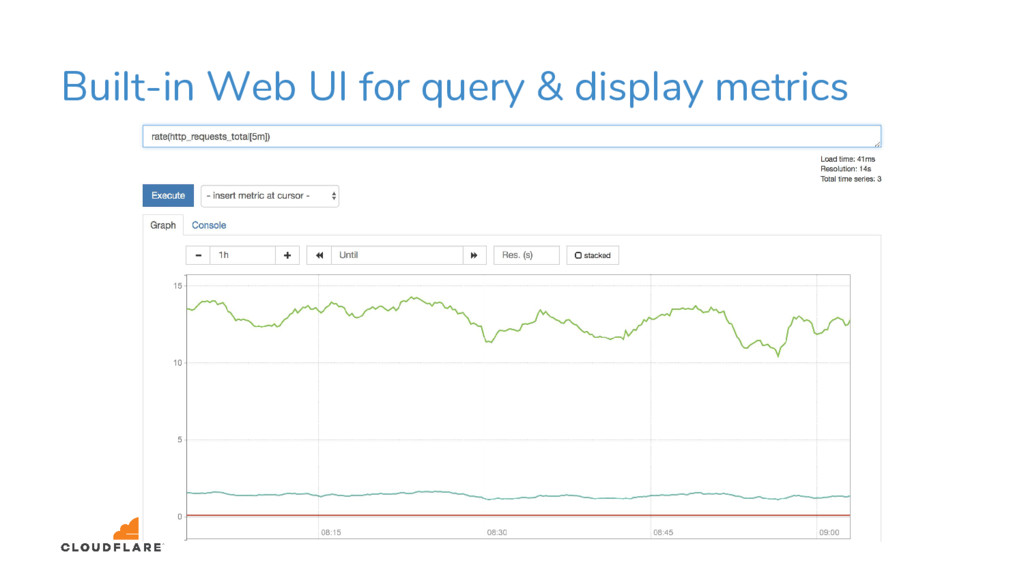
  8. Querying Metrics - PromQL • Flexible and powerful query language

    ◦ http_requests_total{instance="localhost:8000"} ◦ rate(http_requests_total{code=~"5.*"}[5m]) ◦ sum(rate(http_requests_total[5m])) by (path) ◦ max(1 - (predict_linear(node_filesystem_avail[1h], 60 * 60 * 4) / node_filesystem_size)) without(mountpoint) > 0.95
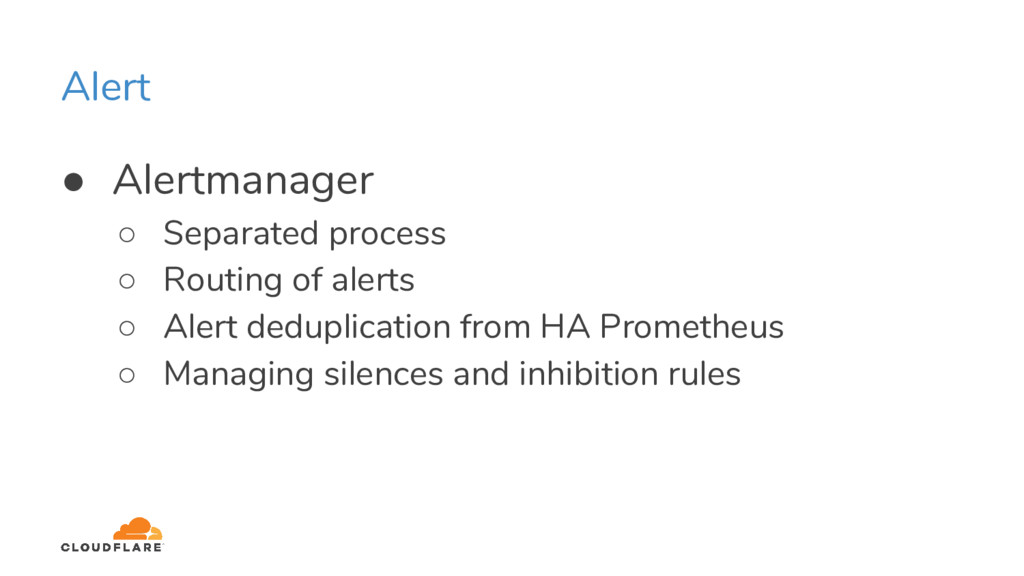
  9. Alert • Alertmanager ◦ Separated process ◦ Routing of alerts

    ◦ Alert deduplication from HA Prometheus ◦ Managing silences and inhibition rules
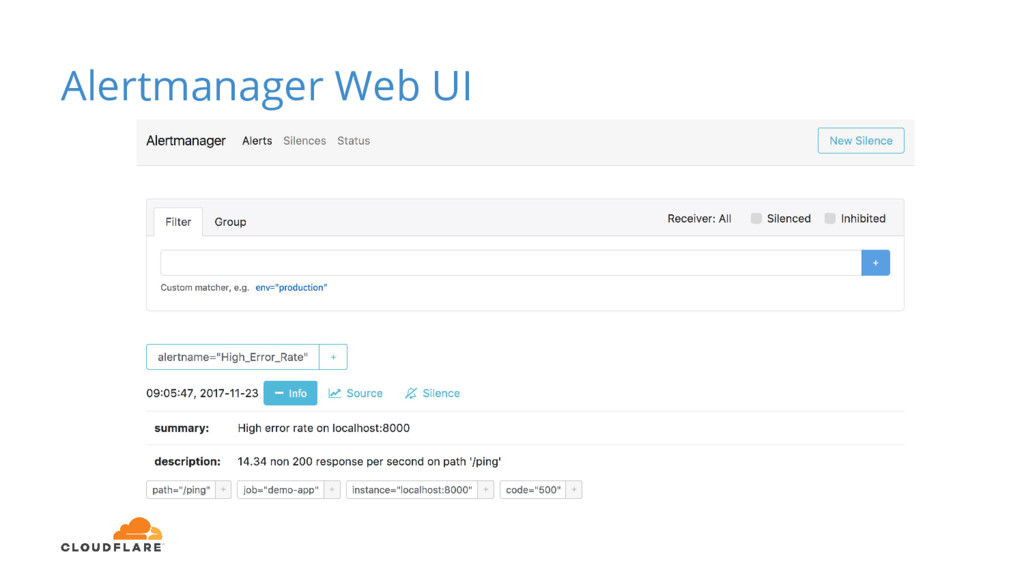
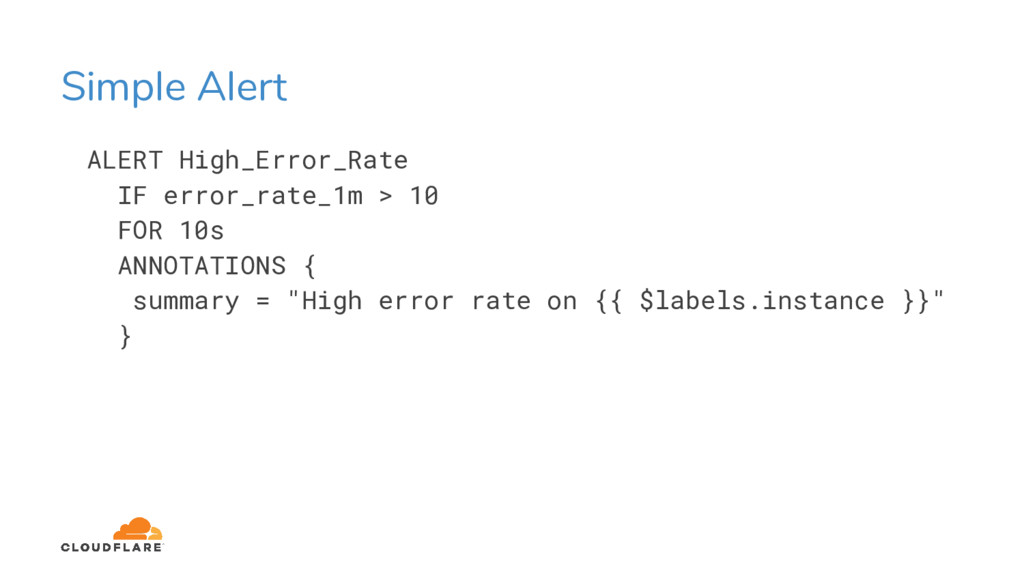
  10. Simple Alert ALERT High_Error_Rate IF error_rate_1m > 10 FOR 10s

    ANNOTATIONS { summary = "High error rate on {{ $labels.instance }}" }
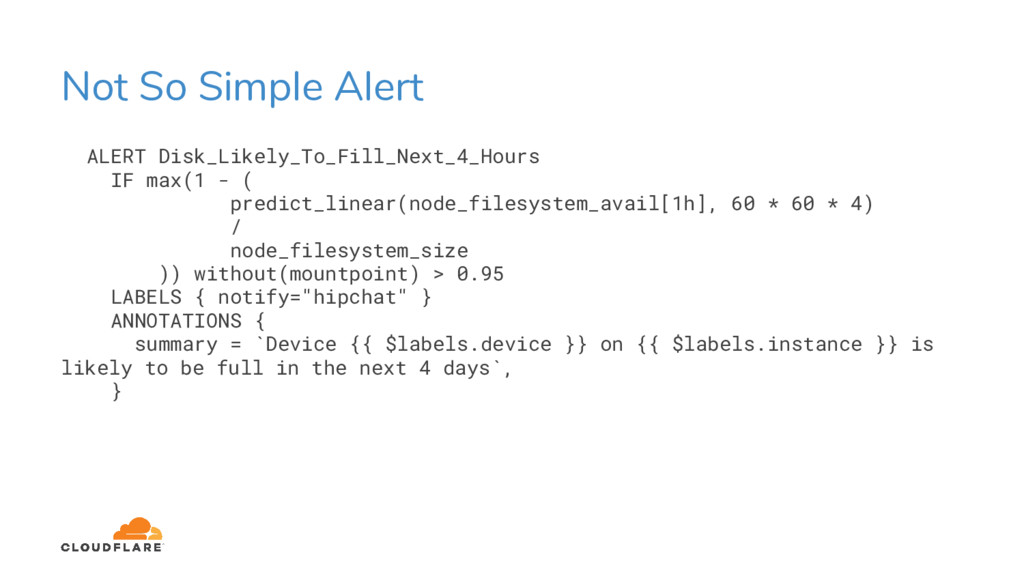
  11. Not So Simple Alert ALERT Disk_Likely_To_Fill_Next_4_Hours IF max(1 - (

    predict_linear(node_filesystem_avail[1h], 60 * 60 * 4) / node_filesystem_size )) without(mountpoint) > 0.95 LABELS { notify="hipchat" } ANNOTATIONS { summary = `Device {{ $labels.device }} on {{ $labels.instance }} is likely to be full in the next 4 days`, }
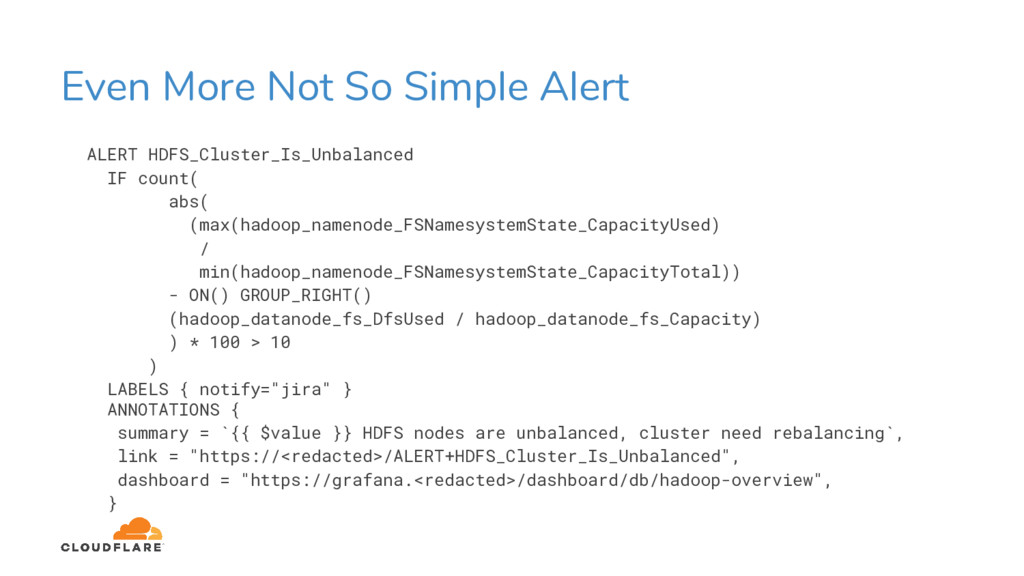
  12. Even More Not So Simple Alert ALERT HDFS_Cluster_Is_Unbalanced IF count(

    abs( (max(hadoop_namenode_FSNamesystemState_CapacityUsed) / min(hadoop_namenode_FSNamesystemState_CapacityTotal)) - ON() GROUP_RIGHT() (hadoop_datanode_fs_DfsUsed / hadoop_datanode_fs_Capacity) ) * 100 > 10 ) LABELS { notify="jira" } ANNOTATIONS { summary = `{{ $value }} HDFS nodes are unbalanced, cluster need rebalancing`, link = "https://<redacted>/ALERT+HDFS_Cluster_Is_Unbalanced", dashboard = "https://grafana.<redacted>/dashboard/db/hadoop-overview", }
  13. If you are interested • Prometheus: A Next-Generation Monitoring System

    • Monitoring Cloudflare's Planet-Scale Edge Network