Today there is a lot of talk about big data and data science.
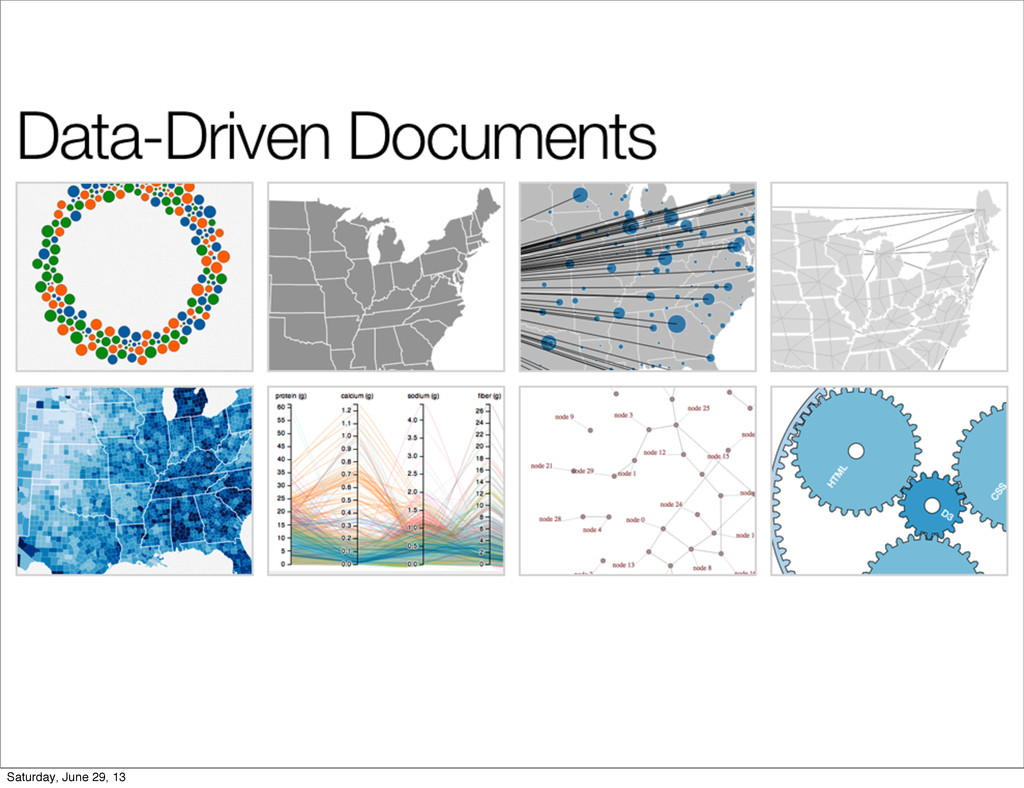
A critical tool to using that data is to be able to see the data in a meaningful visualization to gather insights about it. D3JS has become the goto Javascript solution for doing everything from creating a simple graph to powerful interactive visualizations.
This talk will cover the basics to data visualization, d3 basics with examples as well as some strategies for moving from simple to complex data visualizations in your application.
![Twitter @lgleasain Github lgleasain www.lancegleason.com www.polyglotprogrammincinc.com [email protected] Saturday, June 29,](https://files.speakerdeck.com/presentations/5b059180c46e01307eef5eff516607c5/slide_2.jpg)
![Twitter @lgleasain Github lgleasain www.lancegleason.com www.polyglotprogrammincinc.com [email protected] Saturday, June 29,](https://files.speakerdeck.com/presentations/5b059180c46e01307eef5eff516607c5/slide_72.jpg)