Upgrade to Pro — share decks privately, control downloads, hide ads and more …

GWAS

MengLuo
September 11, 2017

 GWAS

Multi-locus Linear Model Approach For GWAS

MengLuo

September 11, 2017
Tweet

More Decks by MengLuo

Other Decks in Research

Transcript

  1. An Efficient Repeatedly Screening Multi-locus Linear Model Approach For Genome-Wide

    Association Studies Meng Luo, Shiliang Gu Laboratory of Wheat Genetics, Molecular Breeding and Biostatistics Meng Luo ( Yangzhou University) September, 2017 1/50 MLLM For GWAS
  2. Meng Luo ( Yangzhou University) July,2017 2/50 MLLM For GWAS

     Program Language  Introduction • GWAS (Genome-Wide Association Studies)  GWAS Methods • Single-locus (mixed) model • Multi-loci (mixed) model • Multi-loci linear model (MLLM)  Summaries Outline
  3. Meng Luo ( Yangzhou University) July,2017 3/50 MLLM For GWAS

    The 2017 Top Programming Languages https://www.codingame.com/blog/wp-content/uploads/2017/01/Top- Programming-Languages-to-learn-in-2017.pdf
  4. Meng Luo ( Yangzhou University) July,2017 5/50 MLLM For GWAS

    CS50 http://192.168.99.100:5050/ide.html
  5. Meng Luo ( Yangzhou University) July,2017 1/50 MLLM For GWAS

    2017 GWAS Catalog Explainer: Genome-Wide Association Studies https://www.broadinstitute.org/visuals/explainer-genome-wide-association-studies
  6. Meng Luo ( Yangzhou University) July,2017 8/50 MLLM For GWAS

    GWAS study data included in the Catalog Publication Trait Sample size Ancestry Genotyping array Number of SNPs analysed Results
  7. Meng Luo ( Yangzhou University) July,2017 9/50 MLLM For GWAS

    GWAS(Genome-Wide Association Studies)
  8. Meng Luo ( Yangzhou University) July,2017 10/50 MLLM For GWAS

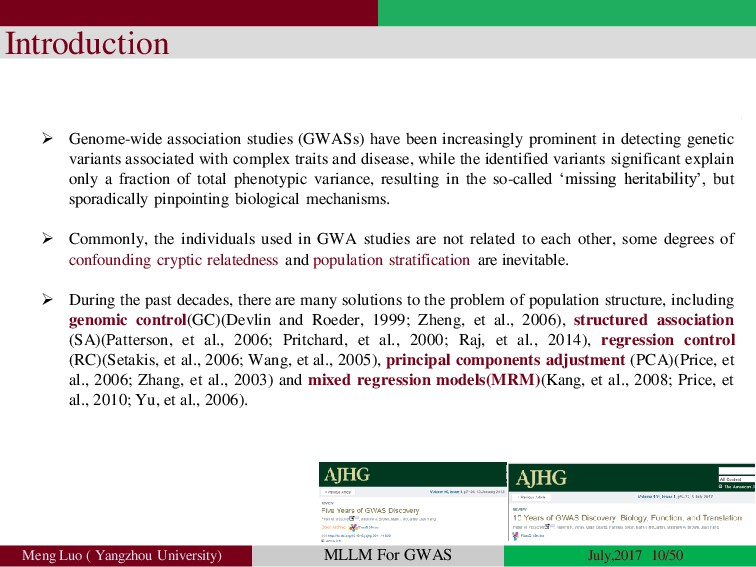
     Genome-wide association studies (GWASs) have been increasingly prominent in detecting genetic variants associated with complex traits and disease, while the identified variants significant explain only a fraction of total phenotypic variance, resulting in the so-called ‘missing heritability’, but sporadically pinpointing biological mechanisms.  Commonly, the individuals used in GWA studies are not related to each other, some degrees of confounding cryptic relatedness and population stratification are inevitable.  During the past decades, there are many solutions to the problem of population structure, including genomic control(GC)(Devlin and Roeder, 1999; Zheng, et al., 2006), structured association (SA)(Patterson, et al., 2006; Pritchard, et al., 2000; Raj, et al., 2014), regression control (RC)(Setakis, et al., 2006; Wang, et al., 2005), principal components adjustment (PCA)(Price, et al., 2006; Zhang, et al., 2003) and mixed regression models(MRM)(Kang, et al., 2008; Price, et al., 2010; Yu, et al., 2006). Introduction
  9. Meng Luo ( Yangzhou University) July,2017 11/50 MLLM For GWAS

    Performance  RC approach substantially outperformed GC(Astle and Balding, 2009). But these approaches are expected to perform well when the population structure is simple, they may perform poorly when the structure is more complex(Zhao, et al., 2007).  Incontrovertibly, the current method that linear mixed model (LMM) has extensively used for GWA studies, having been shown to perform well in plants, animals and humans(Fuchsberger, et al., 2016; Ramu, et al., 2017; Speliotes, et al., 2010).  The mixed model that included approximate methods P3D(Zhang, et al., 2010), EMMAx(Kang, et al., 2010) and GRAMMAR-Gamma(Svishcheva, et al., 2012), exact methods EMMA(Kang, et al., 2008), FaST-LMM(Lippert, et al., 2011), GEMMA(Zhou and Stephens, 2012) and so on.
  10. Meng Luo ( Yangzhou University) July,2017 12/50 MLLM For GWAS

    Continue  For past several years, based on these methods, where several new multi-locus methodologies have been developed. For example, MLMM(Segura, et al., 2012), where stepwise mixed- model regression with forward inclusion and backward elimination, having shown the advantage of computationally efficient and outperform the univariate mixed model for GWAS.LMM-Lasso(Rakitsch, et al., 2013), where combines the advantages of established linear mixed models (LMM) with sparse Lasso regression. Some the others, BSLMM(Zhou, et al., 2013), MRMLM(Wang, et al., 2016) and FASTmrEMMA(Wen, et al., 2017) both are based on the mixed model. Recently, FarmCPU(Liu, et al., 2016) and QTCAT(Klasen, et al., 2016) are not based on the mixed model.
  11. Meng Luo ( Yangzhou University) July,2017 13/50 MLLM For GWAS

    Problems  Whereas hypothesis tested have been changed by the use of a genomic relationship matrix as the random effect to correct for population structure and infinitesimal genetic background. It tests whether a locus has an effect on the phenotype that is neither explained by population structure nor by the genetic background. It is difficult that the trait model assumptions to corroborate in reality, which ultimately leads to failures in the identification of causal loci(Atwell, et al., 2010; Klasen, et al., 2016; Song, et al., 2015; Yang, et al., 2014).
  12. Meng Luo ( Yangzhou University) July,2017 14/50 MLLM For GWAS

    New methods  Here we introduce a new unique variable selection procedure of regression statistic method, call screen stepwise regression. Where we formulated a new regression information criterion (RIC) and used this criterion as the objective function of the entire variable screen process. We evaluate various model selection criteria through simulations, which suggest that the proposed multi-locus linear-model (MLLM) method performs well in terms of FDR and power. Finally, we show the usefulness of our approach by applying it to A. thaliana and mouse data.
  13. Meng Luo ( Yangzhou University) July,2017 15/50 MLLM For GWAS

    Single-locus (mixed) model Adjustment on marker Prof.Zhizu Zhang Compressed MLM (CMLM) Genome-wide efficient mixed-model analysis(GEMMA) Prof.Xiang Zhou Brent‘s algorithm or Newton-Raphsons’ algorithm This method was called the approximate method by Zhiwu zhang (NG.2010). This method was called the exact method by Zhou and Stevens (NG.2012).
  14. Meng Luo ( Yangzhou University) July,2017 16/50 MLLM For GWAS

    Multi-loci (mixed) model Adjustment on covariates Xiaolei Liu et al. PLoS Genetics.2016 eBIC, mBONF Fast multi-locus random-SNP-effect EMMA (FASTmrEMMA): built on random single nucleotide polymorphism(SNP) effects and a new algorithm. Yangjun Wen et al. Briefings in Bioinformatics .2017 Vincent Segura et al. NG.2012
  15. SNP p1 … NA … NA … pl Mt Pt1

    … Ptj … Ptk … Ptl Pt … … … … … … … … … M2 P21 … P2j … P2k … P2l P2 M1 P11 … P1j … P1k … P1l P1 m1 … mj … mk … ml Fixed model y = M1 + … + Mt + mi + e Substitution Random model y = u + e with Var(u)∝SVD(M) Optimizatio n FARM-CPU (Fixed And Random Model Circuitous Probability Unification) Meng Luo ( Yangzhou University) July,2017 17/50 MLLM For GWAS
  16. Meng Luo ( Yangzhou University) July,2017 18/50 MLLM For GWAS

    Power QTCAT Jonas R. Klasen et al. Nat Communication2016 MLMM Vincent Segura et al. Nat Genet 2012
  17. Meng Luo ( Yangzhou University) July,2017 19/50 MLLM For GWAS

    Multi-loci Linear Model Build screening criterion of regression Fig. Equation of saturated penalize information functions 0 0.2 0.4 0.6 0.8 1 -0.2 0 0.2 0.4 0.6 0.8 1 1.2 1.4 sd f(sd) 2 (142.63 2.3553 ) (150.316 ) 0.1562 ) 0.0335 1 0.08945 ( sd sd sd e f sd e          Prof.Shiliang Gu
  18. Meng Luo ( Yangzhou University) July,2017 20/50 MLLM For GWAS

    Significant levels of dynamic regulation Fig. Dynamic significance level functions (0.01,sd) af Fig. additional items functions 2 = 2(R ) d p fr  Calculated the Effects counts and Additional items c p d p
  19. Meng Luo ( Yangzhou University) July,2017 21/50 MLLM For GWAS

    The procedure of screen stepwise regression
  20. Meng Luo ( Yangzhou University) July,2017 22/50 MLLM For GWAS

    Remove and select procedure This procedure requires attention to two issues: 1, Setting the significance level is slightly larger, such that avoid the real effect would be not removed in the first step. 2, Recording the removed covariates, which will be used to the next rescreen step.
  21. Meng Luo ( Yangzhou University) July,2017 24/50 MLLM For GWAS

    Re-screen procedure Fig. three classified effects diagram
  22. Meng Luo ( Yangzhou University) July,2017 25/50 MLLM For GWAS

    MLLM i Y S S Q      SSR Procedure
  23. Meng Luo ( Yangzhou University) July,2017 50/50 MLLM For GWAS

    ROC(AUC)   / / (TP F N),( ) sensitivityor true positive rate TP T TP P P R PR T      / / (TN F N),( ) specificity SPC or true negati SPC TN N TN ve rate    ?(FPR (FPR FP/ N FP/ (FP TN) 1 ,( ) ) ) fall outor false positive PC rate S         ( / (TP FP)), ( ) false discovery rate FD R R FP FD   Power:(Fawcett, 2006; Powers, 2011)
  24. Meng Luo ( Yangzhou University) July,2017 26/50 MLLM For GWAS

    Simulation studies Scenarios Ⅰ Chromosome Position Effect PVE(%) 1 884146 2.239 3.78 1 22328924 -1.609 2.13 2 852811 1.445 1.79 2 17529023 -1.334 1.22 3 747079 -1.878 2.57 3 18086746 1.681 1.99 4 708467 -1.089 0.93 4 16049848 2.424 4.27 5 1015315 -2.144 3.69 5 23897239 1.848 2.51 Note : Proportion of variance in phenotype explained by a given SNP (PVE) For the sample traits, following (Yang, et al., 2011; Yang, et al., 2014), we fixed two randomly chosen causal SNPs from each chromosome that were used to generate 100 phenotypes. Table 1 casual SNPs information Arabidopsis dataset 10 2 2 2 1 , ~ M (0, (1 / ), j 1,2,...,1307 j i i n g i y X b VN h h            Horton, .. et al. Nat Genet 2012
  25. Position(Mb) Chr5 Chr4 Chr3 Chr2 Chr1 3Mb 7Mb 10Mb 14Mb

    17Mb 20Mb 24Mb 27Mb 30Mb Number of SNPs 0 35 70 105 140 175 210 245 280 315 Position(Mb) Chr5 Chr4 Chr3 Chr2 Chr1 3Mb 7Mb 10Mb 14Mb 17Mb 20Mb 24Mb 27Mb 30Mb Number of SNPs 0 338 676 1014 1352 1690 2028 2366 2704 >2704 Arabidopsis Genome Map Meng Luo ( Yangzhou University) July,2017 27/50 MLLM For GWAS
  26. Meng Luo ( Yangzhou University) July,2017 28/50 MLLM For GWAS

    Simulation studies Scenario II: For the complex traits, following (Segura, et al., Nat Genet 2012), we used an additive model with 100 randomly sampled causal SNPs having effect sizes drawn from an exponential distribution with a rate of 1. An additional random deviation was added, drawn from a normal distribution with a mean of zero and scaled identity matrix as covariance matrix to fix the trait heritability to 0.25, 0.5 and 0.75. 100 phenotypes were simulated, the model as follows: 100 2 2 2 1 , ~ M (0, (1 / ), j 1,2,...,1307 j i i n g i y X b VN h h         
  27. Meng Luo ( Yangzhou University) July,2017 29/50 MLLM For GWAS

    Simulation studies Outbred CFW mice Clarissa C Parker et al. Nat Genet 2016. Scenario I: 50 markers were randomly selected as causal loci. We assigned an additive effect randomly drawn from a standard normal distribution and also added a random environmental term so that heritability of the simulated traits was 0.25, 0.5, 0.75. 50 2 2 2 1 , ~ M (0, (1 / ), j 1,2,...,1161 j i i n g i y X b VN h h          Scenario II: The second 100 phenotypes used all CFW mice dataset that including 100 markers were randomly selected as causal loci. Here, only considered h2 only was 0.5. 100 2 2 2 1 , ~ M (0, (1 / ), j 1,2,...,1161 j i i n g i y X b VN h h         
  28. Position(Mb) Chr19 Chr18 Chr17 Chr16 Chr15 Chr14 Chr13 Chr12 Chr11

    Chr10 Chr9 Chr8 Chr7 Chr6 Chr5 Chr4 Chr3 Chr2 Chr1 22Mb 43Mb 65Mb 87Mb 108Mb 130Mb 152Mb 174Mb 195Mb Number of SNPs 0 44 88 132 176 220 264 308 352 396 >396 Position(Mb) Chr19 Chr18 Chr17 Chr16 Chr15 Chr14 Chr13 Chr12 Chr11 Chr10 Chr9 Chr8 Chr7 Chr6 Chr5 Chr4 Chr3 Chr2 Chr1 22Mb 43Mb 65Mb 87Mb 108Mb 130Mb 152Mb 173Mb 195Mb Number of SNPs 0 9 18 27 36 45 54 63 72 81 >81 Fig.2 Density of SNPs discovered in the CFW 1161 population. The colored bars represent the number of SNPs, each bar represents a 1Mb Window size. The left figure that represent the density of genome-wide 92,734 single-nucleotide polymorphism marker discovered, where the right figure that represent randomly chose density of 20,000 SNPs to simulation discovered. CFW Mice Genome Map Meng Luo ( Yangzhou University) July,2017 30/50 MLLM For GWAS
  29. Meng Luo ( Yangzhou University) July,2017 31/50 MLLM For GWAS

    Comparison of the statistical power and FDR (false discovery rate) Figure 1 Comparison of MLLM with the single-locus and multi-locus approaches. (a) the detected power in different proportion of phenotypic variation explained (PVE) by genotyped SNPs (10 casual loci) and without considered the window size (means, 0kb window size) and 100 replicates. (b) compared the number of detected, true positive and false positive, also the FDR in different genetic model.
  30. Meng Luo ( Yangzhou University) July,2017 32/50 MLLM For GWAS

    Figure 2 Performances of TPR (Power) versus FDR and FPR in Arabidopsis dataset. A receiver operating characteristic curve for seven methods were performed to test Power/FDR (a) and Power/FPR (b) in the second simulation additive genetic effects controlled by 100 causal loci with three phenotypic heritabilities 0.25(left), 0.5(middle) and 0.75(right), including MLLM, FarmCPU, GEMMA, MLMM, CMLM, FASTmrEMMA and LM methods. The casual loci were randomly sampled from all the SNPs in each dataset. Power was examined under different levels of FDR and FPR. A causal SNP was considered to be detected if a SNP within 50 kb on either side was determined to have a significant association (results for other window sizes are given in Supplementary Fig. 1). Performance of detecting associations is measured by the area under the curve (AUC), where a higher value indicates better performance.
  31. Meng Luo ( Yangzhou University) July,2017 33/50 MLLM For GWAS

    Figure 3 Performances of TPR (Power) versus FDR and FPR in CFW mice dataset.
  32. Meng Luo ( Yangzhou University) July,2017 34/50 MLLM For GWAS

    All CFW Genome Figure 4 Performances of TPR (Power) versus FDR and FPR in CFW mice dataset. A receiver operating characteristic curve seven methods were performed to test Power/FDR (left) and Power/FPR (right) in the second simulation additive genetic effects controlled by 100 causal loci with phenotypic heritability 0.5, including MLLM, FarmCPU, GEMMA, MLMM, CMLM, FASTmrEMMA and LM methods.
  33. Meng Luo ( Yangzhou University) July,2017 35/50 MLLM For GWAS

    Accuracy for estimated SNPs effects and proportion of phenotypic variation explained (PVE) Figure 5 Comparison of accuracy for estimated SNPs effect MLLM with others six methods. To measure the bias of fixed 10 casual SNPs effect estimate, where MSE (a) and MAD (b) were used to compare that in ten different PVE (%). A method with a small MSE (or MAD) is generally more preferable than a method with a large MSE (or MAD). (c) as (Cumming, et al., 2007) described, so that boxplot showed the middle small patch with a 95% confidence interval (a range of values you can be 95% confident contains the true mean) for the mean (middle solid line), and the large patch was the SD (standard deviation, where the average difference between the data points and their mean). The data points with 100 replicates. Performance of estimating PVE is measured by the root of mean square error (RMSE), where a lower value indicates better performance. The true PVEs are shown as the dash horizontal lines. The true PVE was 0.25. The same as following. Arabidopsis dataset Scenario I:
  34. Meng Luo ( Yangzhou University) July,2017 36/50 MLLM For GWAS

    Arabidopsis dataset Scenario II: Figure 6 Comparison of PVE estimation for the randomly select 100 casual SNPs by different methods within the 100 simulations for the Arabidopsis dataset. The details described as above.
  35. Meng Luo ( Yangzhou University) July,2017 37/50 MLLM For GWAS

    Figure 7 Analysis of the results of GWA simulations in three Arabidopsis dataset phenotype. The distribution of all simulated effects (all true effect) and the distribution of effects of loci identified (only true positive) by six methods. The solid line shows the effect size by different methods. (a) the phenotype with 25% of PVE, (b) the phenotype with 50% of PVE, (c) the phenotype with 75% of PVE.
  36. Meng Luo ( Yangzhou University) July,2017 38/50 MLLM For GWAS

    CFW MICE dataset Scenario I: Figure 8 The explained variance of the 50 casual loci by different methods within the 100 simulations in the CFW mice dataset. The details described as above.
  37. Meng Luo ( Yangzhou University) July,2017 39/50 MLLM For GWAS

    Figure 9 Analysis of the results of GWA simulations in three CFW mice phenotype. The distribution of all simulated effects (all true effect) and the distribution of effects of loci identified (only true positive) by six methods. The solid line shows the effect size by different methods. (a) the phenotype with 25% of PVE, (b) the phenotype with 50% of PVE, (c) the phenotype with 75% of PVE.
  38. Meng Luo ( Yangzhou University) July,2017 40/50 MLLM For GWAS

    CFW MICE dataset Scenario II: Figure 10 The explained variance of the 100 casual loci by different methods within the 100 simulations in the CFW mice dataset and with heritability. The details described as above. Figure 11 Analysis of the results of GWA simulations in three CFW mice phenotype. The distribution of all simulated effects (all true effect) and the distribution of effects of loci identified (only true positive) by six methods. The solid line shows the effect size by different methods. And the phenotype with 50% of PVE.
  39. Meng Luo ( Yangzhou University) July,2017 41/50 MLLM For GWAS

    Application to an A. thaliana dataset  Sodium accumulation in the leaves of A. thaliana has been shown to be strongly associated with genotype and expression levels of the Na+ transporter AtHKT1(Baxter, I. et al. PLoS Genet.2010).  Cellular traits: the meristem zone length and mature cortical cell length (Mó nica Meijó n et al. Nat Genet.2013).
  40. Meng Luo ( Yangzhou University) July,2017 42/50 MLLM For GWAS

    Figure 14 Association studies of Sodium accumulation in Arabidopsis thaliana. The sodium accumulation was measured on 341 Arabidopsis thaliana individuals genotyped with 214,051 SNPs. Seven statistical methods were employed to conduct the association studies. Manhattan Plot
  41. Meng Luo ( Yangzhou University) July,2017 46/50 MLLM For GWAS

    2 4 6 8 10 -log 10 (P) Chromosome 3 2 4 6 8 10.82 10.84 10.86 10.88 10.9 10.92 10.94 AT3G28880 AT3G28870 AT3G28865 AT3G28890 AT3G28899 AT3G28900 AT3G28910 AT3G28915 AT3G28917 AT3G28920 AT3G28840 AT3G28855 AT3G28850 AT3G28857 AT3G28860 AT3G28865 Position(Mb) SNP-10891607 Figure 15 Locuszoom plots for the association of the sodium accumulation with index SNPs. The points for each SNP are colored by the level of the –log(p-value) with the index SNP, the SNP with the highest association to the quantitative trait. (Supplementray Table S4)
  42. Meng Luo ( Yangzhou University) July,2017 47/50 MLLM For GWAS

    Summaries (Discussion) • we present a new statistical method that screen stepwise regression, where it builds on a new model selection criterion RIC (regression information criterion) and a unique variable screen procedure. Based on that we also proposed a new test set of methodologies, called ‘Multi-locus Linear Mode’ (MLLM) appropriately correction population stratification and cryptic relatedness in GWAS. • Results from analyses of simulated suggest that the proposed multi-locus linear-model (MLLM) method performs well in terms of FDR and power, also less bias in effect estimation than existing multi-locus (mixed) model including multi-locus mixed model(MLMM), fixed and random model Circulating Probability Unification(FarmCPU) and fast multi-locus random-SNP-effect EMMA(FASTmrEMMA), and the single-locus (mixed) model, such as, genome-wide efficient mixed-model association (GEMMA), compressed mixed linear model (CMLM) and linear model(LM). • Finally, we show the usefulness of our approach by applying it to outbred CFW mice and A. thaliana data. Where it identifies several new causal loci that other methods do not detect. Our MLLM provides an alternative for multi-locus GWAS and the implementation is computationally efficient, making the analysis of large data sets (n > 10,000) practicable.
  43. Meng Luo ( Yangzhou University) July,2017 48/50 MLLM For GWAS

    MLLM Tutorial Genotype Data ATTCTG ATTCTG 2/1 ATTCTG ATTGTG 1/0.5 ATTGTG ATTGTG 0/0 Sequence/Genotypes Data procedure Plink&Tassel-JAVA File.Tram to file.mat MLLM Package Recently, I am building a website for those analysis details (tutorial): http://mengluoML.github.io/MLLM/
  44. Meng Luo ( Yangzhou University) July,2017 49/50 MLLM For GWAS

    Acknowledgment Prof.Tao Li Dr.Lei Li Prof.Shiliang Gu Prof.Zhiwu Zhang  And the members of Laboratory of Wheat Genetics, Molecular Breeding and Biostatistics in YZU