University of Yangzhou Genome-wide Association and Prediction / Selection In Plant (Human and Animal) Improvement Meng Luo (University of Yangzhou) GWAS&GS February,2017 1/39
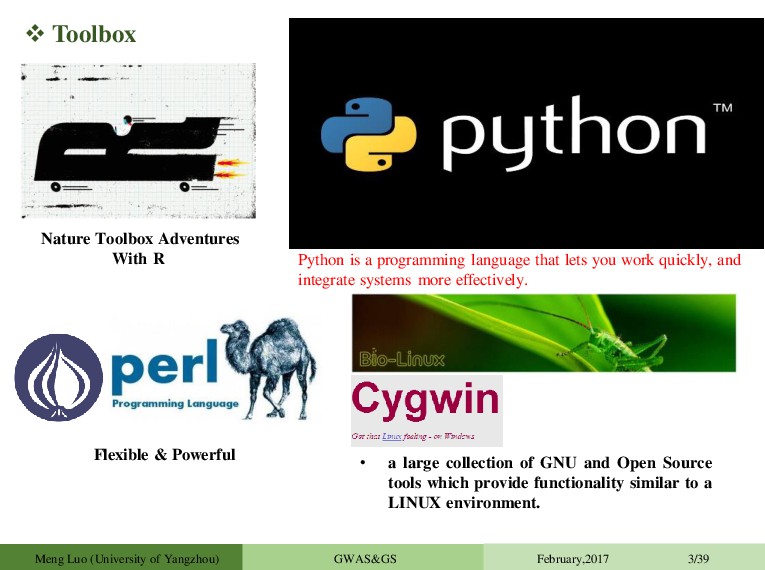
Solutions THE POWER TO KNOW Data Analytics/Machine Learning Flexible & Powerful • a large collection of GNU and Open Source tools which provide functionality similar to a LINUX environment. Python is a programming language that lets you work quickly, and integrate systems more effectively. Meng Luo (University of Yangzhou) GWAS&GS February,2017 3/39
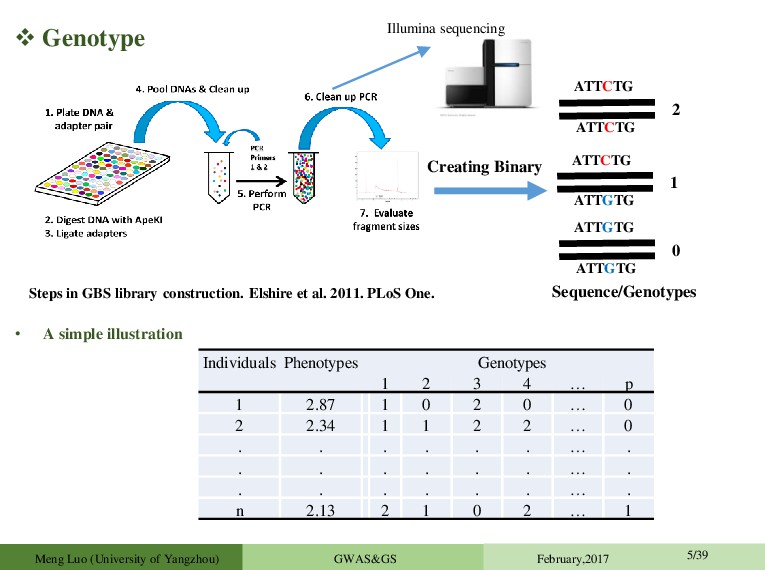
widely used to identify QTL underlying quantitative traits in humans and animals, and has recently also become a popular method of mapping QTL in plants.(认真(做好)翻译和讲解) Meng Luo (University of Yangzhou) GWAS&GS February,2017 4/39 • Identifying large amounts of associations efficiently is a problem that arises frequently in modern genomics data. • Understand the genetics of other important traits, e.g. traits with medical or agricultural relevance, and identifying expression QTLs. • As genomics datasets become more common and sample sizes grow, the need for efficient tests increases. • Understanding the genetic architecture of traits of ecological and agricultural importance • Identifying the genomic regions that control genetic variation.
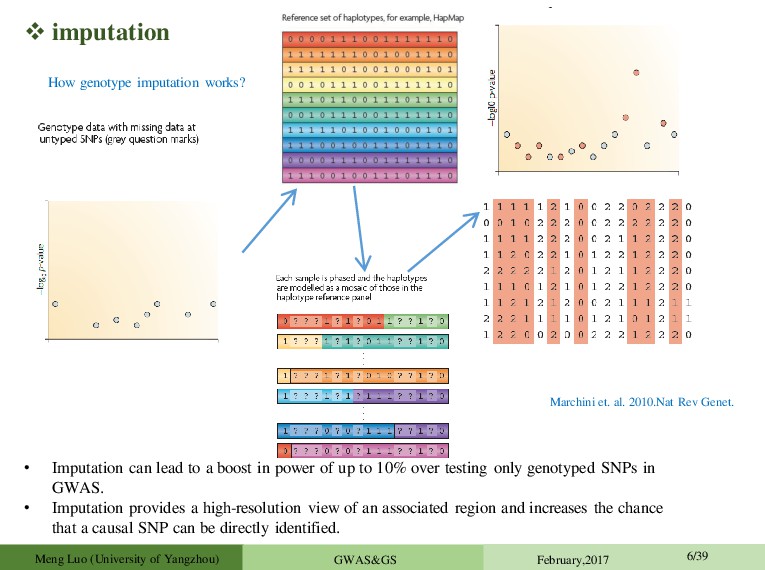
power of up to 10% over testing only genotyped SNPs in GWAS. • Imputation provides a high-resolution view of an associated region and increases the chance that a causal SNP can be directly identified. Marchini et. al. 2010.Nat Rev Genet. How genotype imputation works? Meng Luo (University of Yangzhou) GWAS&GS February,2017 6/39
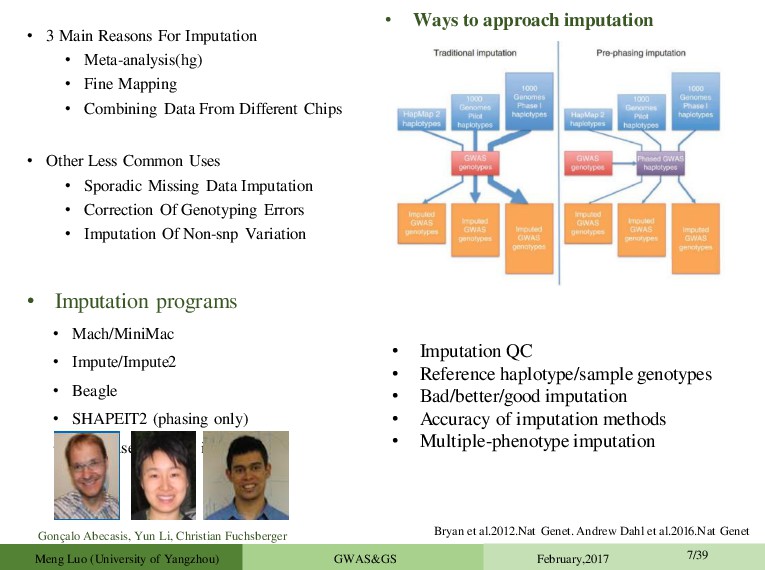
Mapping • Combining Data From Different Chips • Other Less Common Uses • Sporadic Missing Data Imputation • Correction Of Genotyping Errors • Imputation Of Non-snp Variation • Imputation programs • Mach/MiniMac • Impute/Impute2 • Beagle • SHAPEIT2 (phasing only) • never use plink for imputation! • Ways to approach imputation Gonç alo Abecasis, Yun Li, Christian Fuchsberger • Imputation QC • Reference haplotype/sample genotypes • Bad/better/good imputation • Accuracy of imputation methods • Multiple-phenotype imputation Bryan et al.2012.Nat Genet. Andrew Dahl et al.2016.Nat Genet Meng Luo (University of Yangzhou) GWAS&GS February,2017 7/39
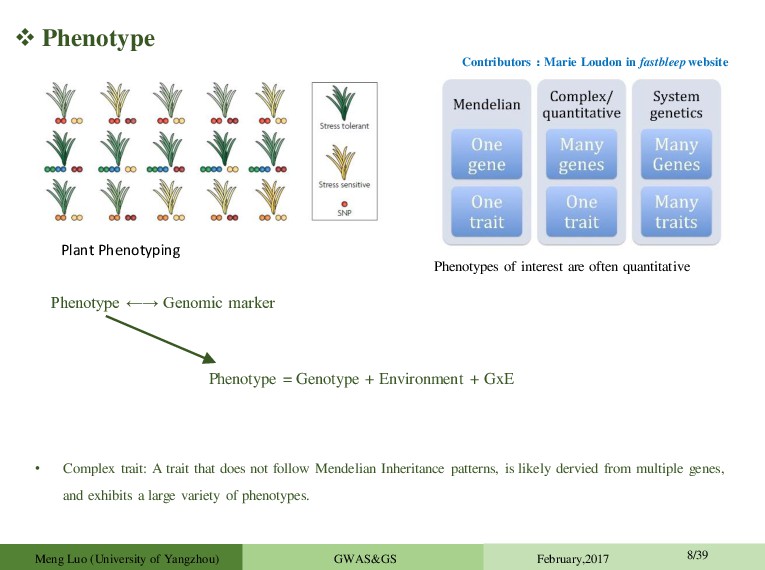
trait: A trait that does not follow Mendelian Inheritance patterns, is likely dervied from multiple genes, and exhibits a large variety of phenotypes. Plant Phenotyping Contributors:Marie Loudon in fastbleep website Meng Luo (University of Yangzhou) GWAS&GS February,2017 8/39 Phenotype ←→ Genomic marker Phenotype = Genotype + Environment + GxE
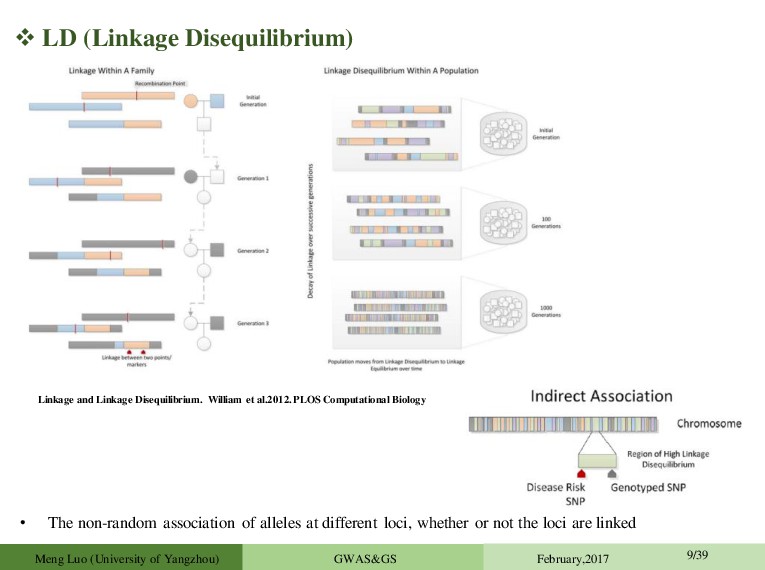
at different loci, whether or not the loci are linked Meng Luo (University of Yangzhou) GWAS&GS February,2017 9/39 Linkage and Linkage Disequilibrium. William et al.2012. PLOS Computational Biology
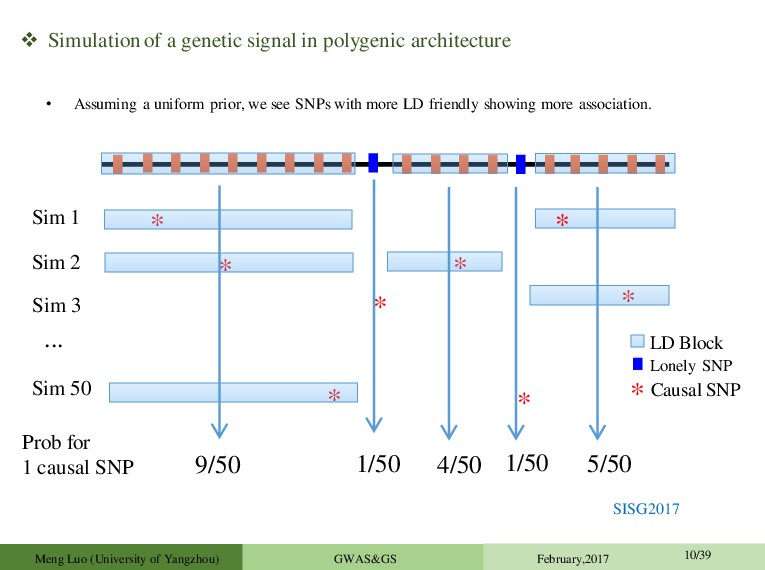
* * * * ... * 9/50 * * LD Block Lonely SNP Causal SNP * Sim 1 Sim 2 Sim 3 Sim 50 Prob for 1 causal SNP 1/50 4/50 1/50 5/50 • Assuming a uniform prior, we see SNPs with more LD friendly showing more association. Meng Luo (University of Yangzhou) GWAS&GS February,2017 10/39 SISG2017
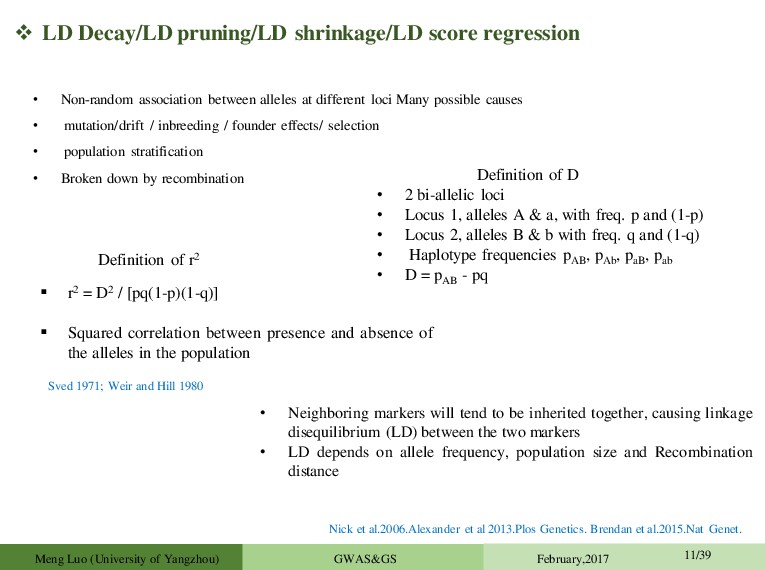
between alleles at different loci Many possible causes • mutation/drift / inbreeding / founder effects/ selection • population stratification • Broken down by recombination Definition of D • 2 bi-allelic loci • Locus 1, alleles A & a, with freq. p and (1-p) • Locus 2, alleles B & b with freq. q and (1-q) • Haplotype frequencies pAB , pAb , paB , pab • D = pAB - pq Definition of r2 r2 = D2 / [pq(1-p)(1-q)] Squared correlation between presence and absence of the alleles in the population Sved 1971; Weir and Hill 1980 • Neighboring markers will tend to be inherited together, causing linkage disequilibrium (LD) between the two markers • LD depends on allele frequency, population size and Recombination distance Nick et al.2006.Alexander et al 2013.Plos Genetics. Brendan et al.2015.Nat Genet. Meng Luo (University of Yangzhou) GWAS&GS February,2017 11/39
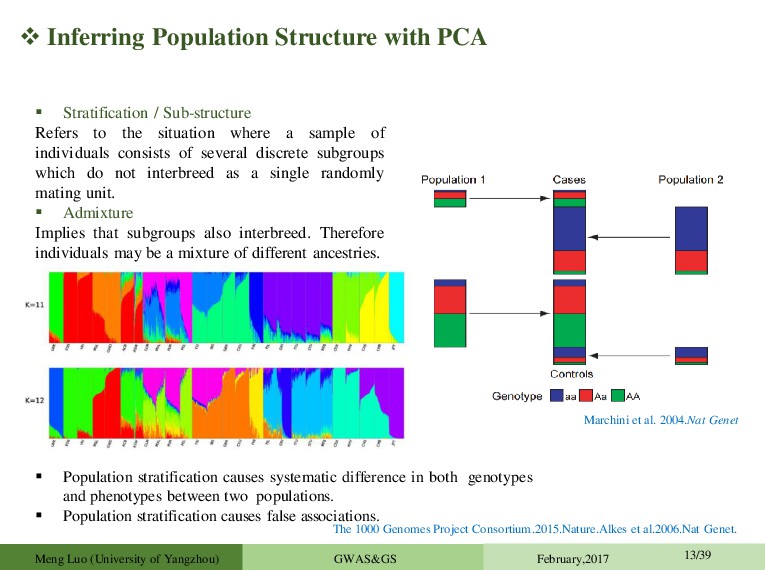
systematic difference in both genotypes and phenotypes between two populations. Population stratification causes false associations. Stratification / Sub-structure Refers to the situation where a sample of individuals consists of several discrete subgroups which do not interbreed as a single randomly mating unit. Admixture Implies that subgroups also interbreed. Therefore individuals may be a mixture of different ancestries. The 1000 Genomes Project Consortium.2015.Nature.Alkes et al.2006.Nat Genet. Marchini et al. 2004.Nat Genet Meng Luo (University of Yangzhou) GWAS&GS February,2017 13/39
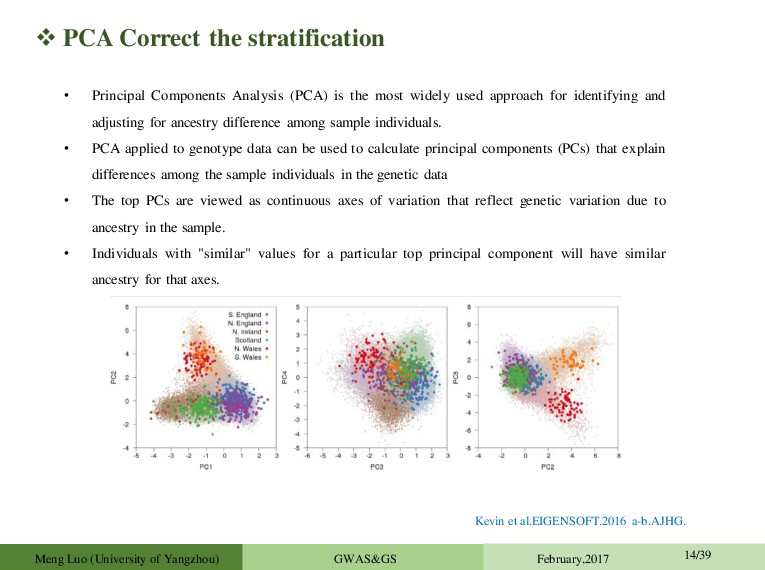
is the most widely used approach for identifying and adjusting for ancestry difference among sample individuals. • PCA applied to genotype data can be used to calculate principal components (PCs) that explain differences among the sample individuals in the genetic data • The top PCs are viewed as continuous axes of variation that reflect genetic variation due to ancestry in the sample. • Individuals with "similar" values for a particular top principal component will have similar ancestry for that axes. Kevin et al.EIGENSOFT.2016 a-b.AJHG. Meng Luo (University of Yangzhou) GWAS&GS February,2017 14/39
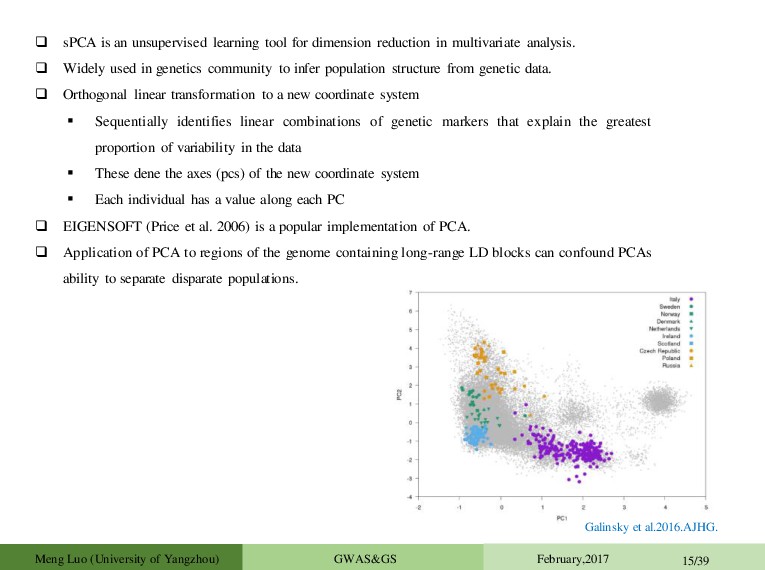
in multivariate analysis. Widely used in genetics community to infer population structure from genetic data. Orthogonal linear transformation to a new coordinate system Sequentially identifies linear combinations of genetic markers that explain the greatest proportion of variability in the data These dene the axes (pcs) of the new coordinate system Each individual has a value along each PC EIGENSOFT (Price et al. 2006) is a popular implementation of PCA. Application of PCA to regions of the genome containing long-range LD blocks can confound PCAs ability to separate disparate populations. Galinsky et al.2016.AJHG. Meng Luo (University of Yangzhou) GWAS&GS February,2017 15/39
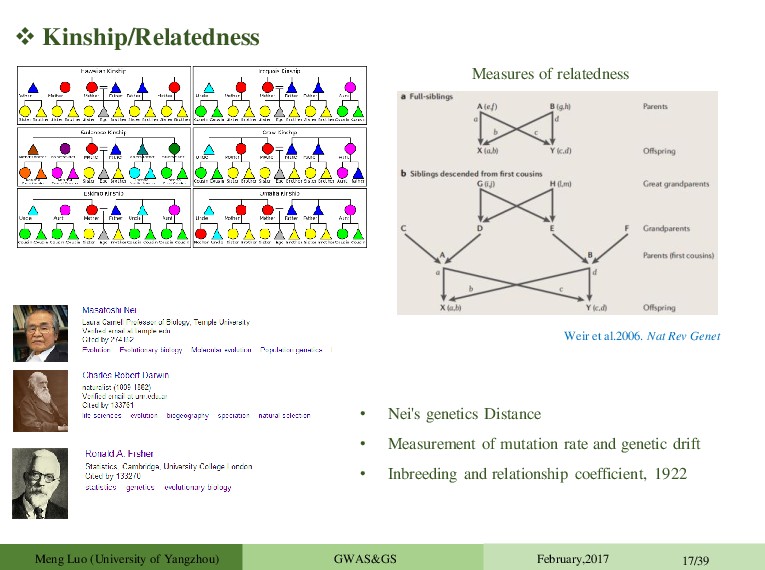
rate and genetic drift • Inbreeding and relationship coefficient, 1922 Weir et al.2006. Nat Rev Genet Measures of relatedness Meng Luo (University of Yangzhou) GWAS&GS February,2017 17/39
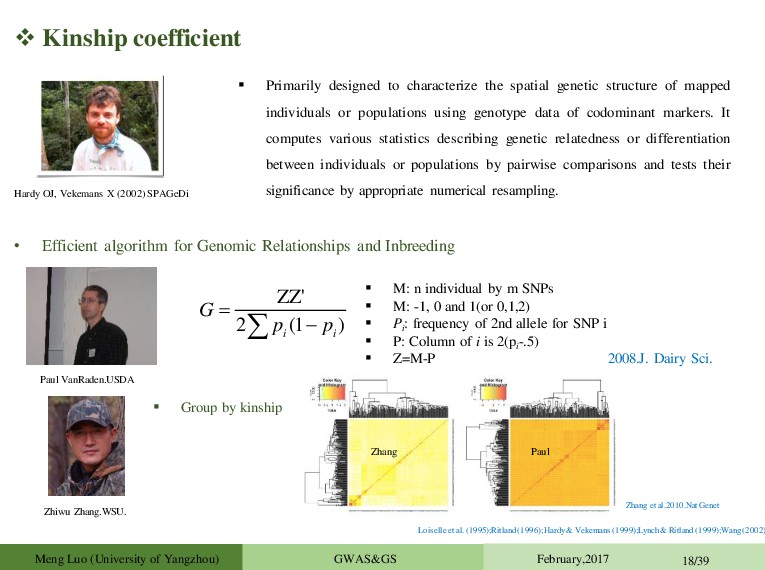
Primarily designed to characterize the spatial genetic structure of mapped individuals or populations using genotype data of codominant markers. It computes various statistics describing genetic relatedness or differentiation between individuals or populations by pairwise comparisons and tests their significance by appropriate numerical resampling. • Efficient algorithm for Genomic Relationships and Inbreeding Paul VanRaden.USDA Loiselle et al. (1995);Ritland (1996); Hardy & Vekemans (1999);Lynch & Ritland (1999);Wang (2002) ZZ' 2 (1 ) i i G p p M: n individual by m SNPs M: -1, 0 and 1(or 0,1,2) Pi : frequency of 2nd allele for SNP i P: Column of i is 2(pi -.5) Z=M-P 2008.J. Dairy Sci. Zhiwu Zhang.WSU. Group by kinship Paul Zhang Zhang et al.2010.Nat Genet Meng Luo (University of Yangzhou) GWAS&GS February,2017 18/39
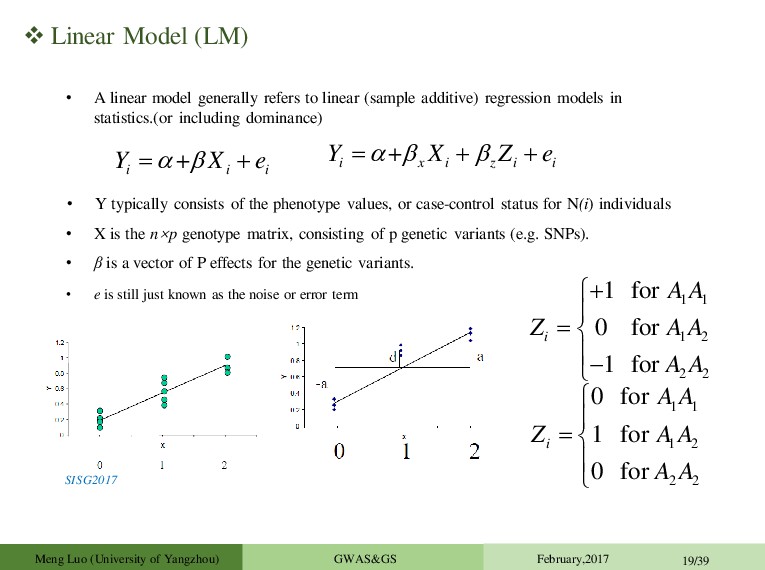
to linear (sample additive) regression models in statistics.(or including dominance) + i i i Y X e • X is the n×p genotype matrix, consisting of p genetic variants (e.g. SNPs). • Y typically consists of the phenotype values, or case-control status for N(i) individuals • β is a vector of P effects for the genetic variants. • e is still just known as the noise or error term SISG2017 + i x i z i i Y X Z e 1 1 1 2 2 2 1 for 0 for 1 for i A A Z A A A A 1 1 1 2 2 2 0 for 1 for 0 for i A A Z A A A A Meng Luo (University of Yangzhou) GWAS&GS February,2017 19/39
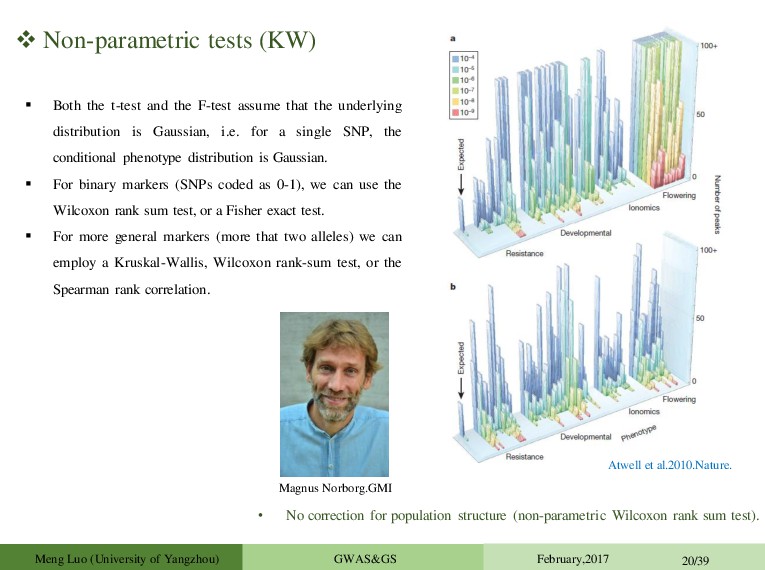
F-test assume that the underlying distribution is Gaussian, i.e. for a single SNP, the conditional phenotype distribution is Gaussian. For binary markers (SNPs coded as 0-1), we can use the Wilcoxon rank sum test, or a Fisher exact test. For more general markers (more that two alleles) we can employ a Kruskal-Wallis, Wilcoxon rank-sum test, or the Spearman rank correlation. • No correction for population structure (non-parametric Wilcoxon rank sum test). Magnus Norborg.GMI Atwell et al.2010.Nature. Meng Luo (University of Yangzhou) GWAS&GS February,2017 20/39
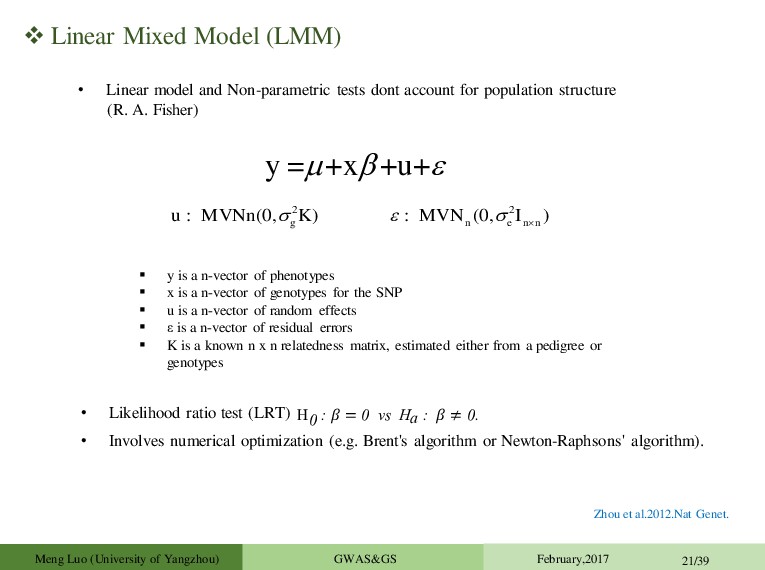
tests dont account for population structure (R. A. Fisher) y = +x +u+ 2 g u MVNn(0, K) : 2 n e n n MVN (0, I ) : y is a n-vector of phenotypes x is a n-vector of genotypes for the SNP u is a n-vector of random effects ε is a n-vector of residual errors K is a known n x n relatedness matrix, estimated either from a pedigree or genotypes • Likelihood ratio test (LRT) H0 : = 0 vs Ha : ≠ 0. • Involves numerical optimization (e.g. Brent's algorithm or Newton-Raphsons' algorithm). Zhou et al.2012.Nat Genet. Meng Luo (University of Yangzhou) GWAS&GS February,2017 21/39
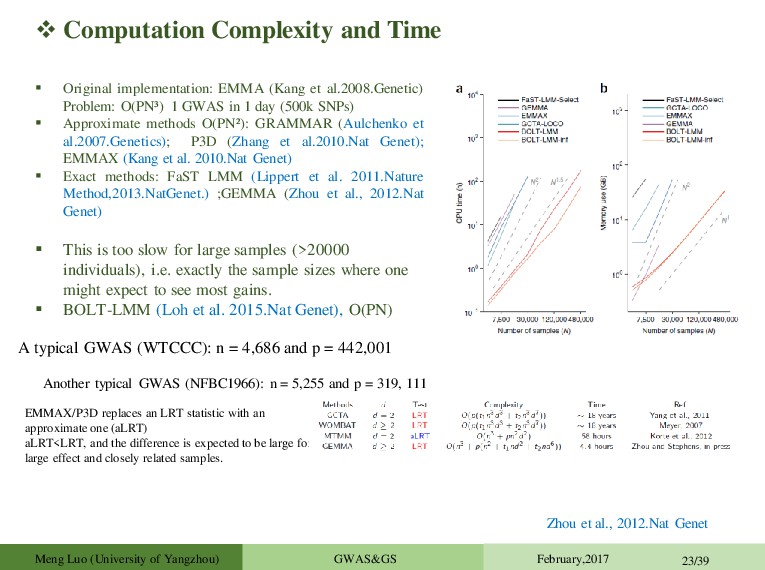
et al.2008.Genetic) Problem: O(PN³ ) 1 GWAS in 1 day (500k SNPs) Approximate methods O(PN² ): GRAMMAR (Aulchenko et al.2007.Genetics); P3D (Zhang et al.2010.Nat Genet); EMMAX (Kang et al. 2010.Nat Genet) Exact methods: FaST LMM (Lippert et al. 2011.Nature Method,2013.NatGenet.) ;GEMMA (Zhou et al., 2012.Nat Genet) This is too slow for large samples (>20000 individuals), i.e. exactly the sample sizes where one might expect to see most gains. BOLT-LMM (Loh et al. 2015.Nat Genet), O(PN) Zhou et al., 2012.Nat Genet A typical GWAS (WTCCC): n = 4,686 and p = 442,001 EMMAX/P3D replaces an LRT statistic with an approximate one (aLRT) aLRT<LRT, and the difference is expected to be large for large effect and closely related samples. Another typical GWAS (NFBC1966): n = 5,255 and p = 319, 111 Meng Luo (University of Yangzhou) GWAS&GS February,2017 23/39
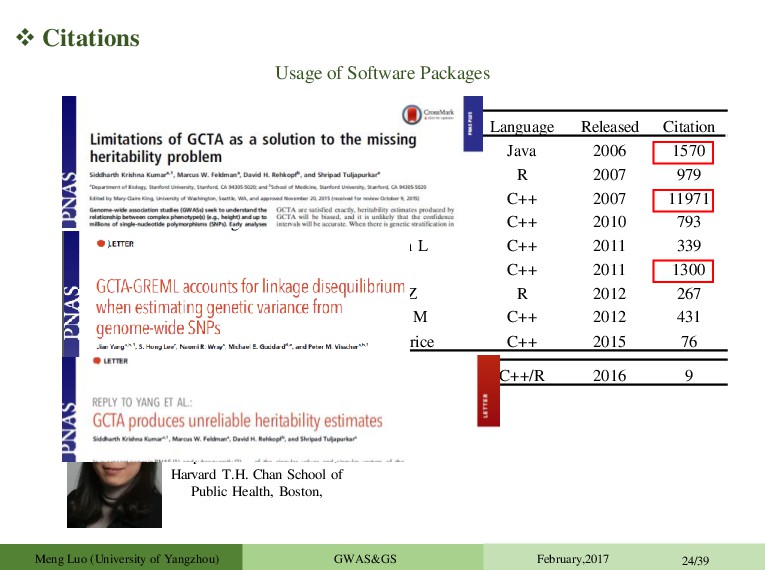
TASSEL Zhang Z Bradbury PJ Java 2006 1570 GenABEL Aulchenko YS Aulchenko YS R 2007 979 PLINK Purcell S Purcell S C++ 2007 11971 EMMAX Kang HM Sabatti C & Eskin E C++ 2010 793 FastLMM Christoph L Christoph L C++ 2011 339 GCTA Jian Y Jian Y C++ 2011 1300 GAPIT Lipka AE Zhang Z R 2012 267 GEMMA Zhou X Stephens M C++ 2012 431 BOLT-LMM Po-Ru Loh Alkes L Price C++ 2015 76 Usage of Software Packages Meng Luo (University of Yangzhou) GWAS&GS February,2017 24/39 GMMAT Xihong Lin Xihong Lin C++/R 2016 9 Xihong Lin Department of Biostatistics, Harvard T.H. Chan School of Public Health, Boston,
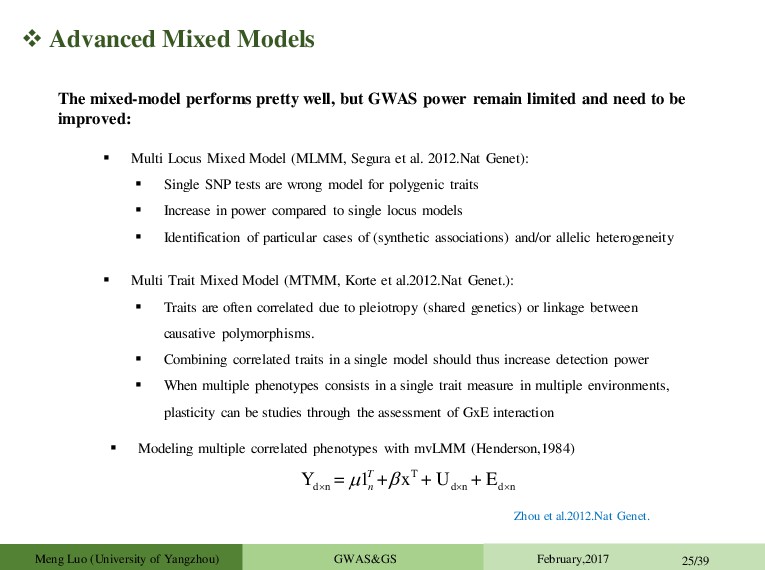
GWAS power remain limited and need to be improved: Multi Locus Mixed Model (MLMM, Segura et al. 2012.Nat Genet): Single SNP tests are wrong model for polygenic traits Increase in power compared to single locus models Identification of particular cases of (synthetic associations) and/or allelic heterogeneity Multi Trait Mixed Model (MTMM, Korte et al.2012.Nat Genet.): Traits are often correlated due to pleiotropy (shared genetics) or linkage between causative polymorphisms. Combining correlated traits in a single model should thus increase detection power When multiple phenotypes consists in a single trait measure in multiple environments, plasticity can be studies through the assessment of GxE interaction T d n d n d n Y = 1 + x + U + E T n Zhou et al.2012.Nat Genet. Modeling multiple correlated phenotypes with mvLMM (Henderson,1984) Meng Luo (University of Yangzhou) GWAS&GS February,2017 25/39
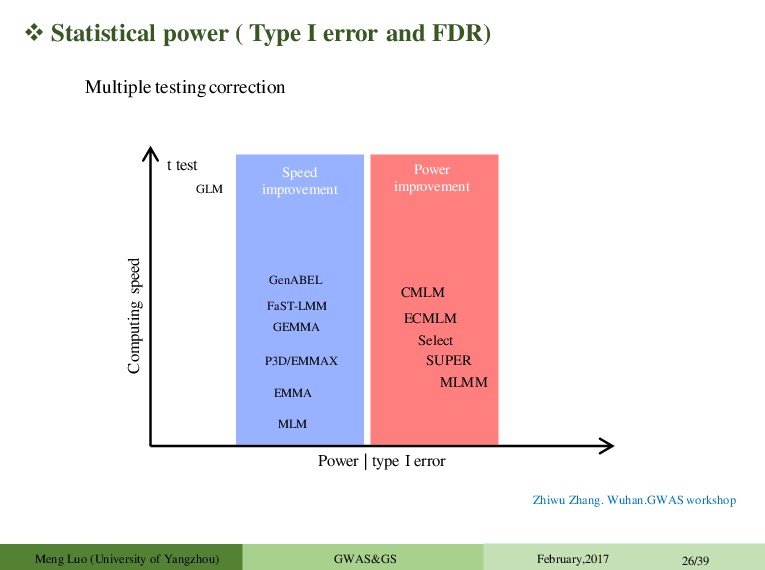
speed GLM t test MLM EMMA P3D/EMMAX GEMMA FaST-LMM GenABEL CMLM MLMM ECMLM Select SUPER Speed improvement Power improvement Power | type I error Zhiwu Zhang. Wuhan.GWAS workshop Meng Luo (University of Yangzhou) GWAS&GS February,2017 26/39 Multiple testing correction
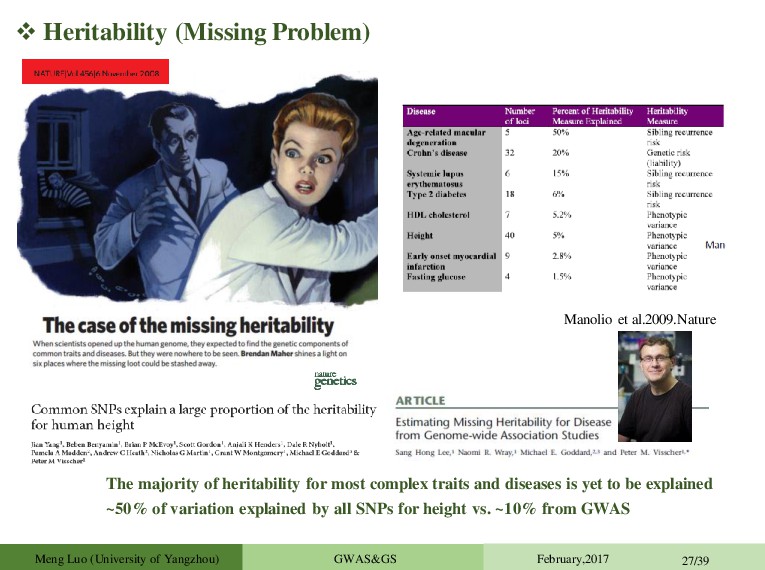
SNPs for height vs. ~10% from GWAS Manolio et al.2009.Nature The majority of heritability for most complex traits and diseases is yet to be explained Meng Luo (University of Yangzhou) GWAS&GS February,2017 27/39
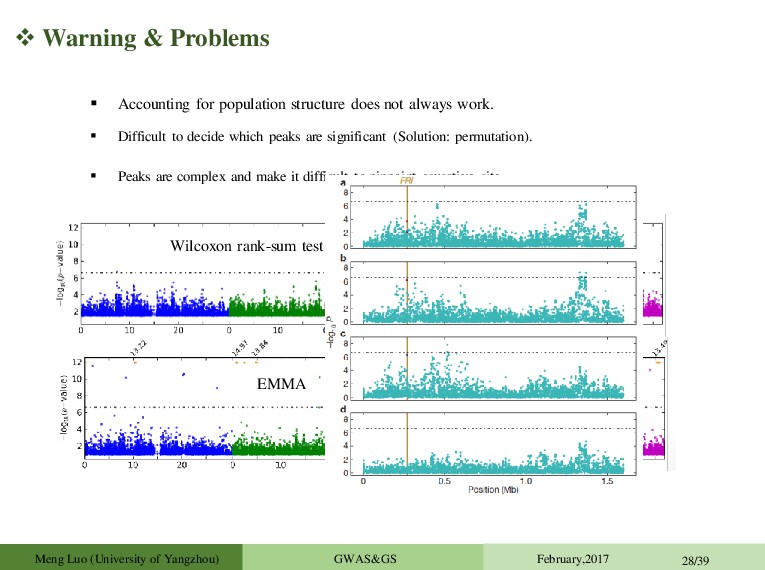
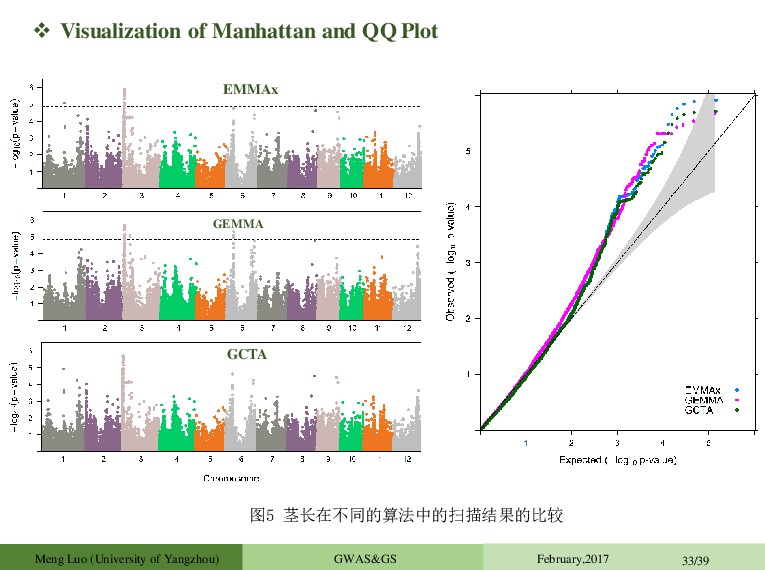
February,2017 28/39 Accounting for population structure does not always work. Difficult to decide which peaks are significant (Solution: permutation). Peaks are complex and make it difficult to pinpoint causative site. Significance and effect size differ dramatically in different subsets: False positives Effect depends on genetic background (Epistasis) Differences in allele frequency of the causal marker Artefact of LMM Wilcoxon rank-sum test EMMA
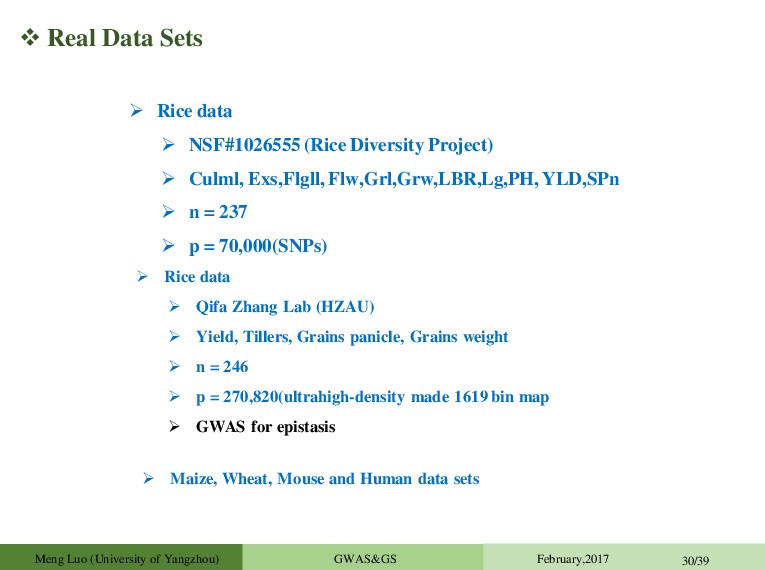
Diversity Project) Culml, Exs,Flgll, Flw,Grl,Grw,LBR,Lg,PH, YLD,SPn n = 237 p = 70,000(SNPs) Rice data Qifa Zhang Lab (HZAU) Yield, Tillers, Grains panicle, Grains weight n = 246 p = 270,820(ultrahigh-density made 1619 bin map GWAS for epistasis Maize, Wheat, Mouse and Human data sets Meng Luo (University of Yangzhou) GWAS&GS February,2017 30/39
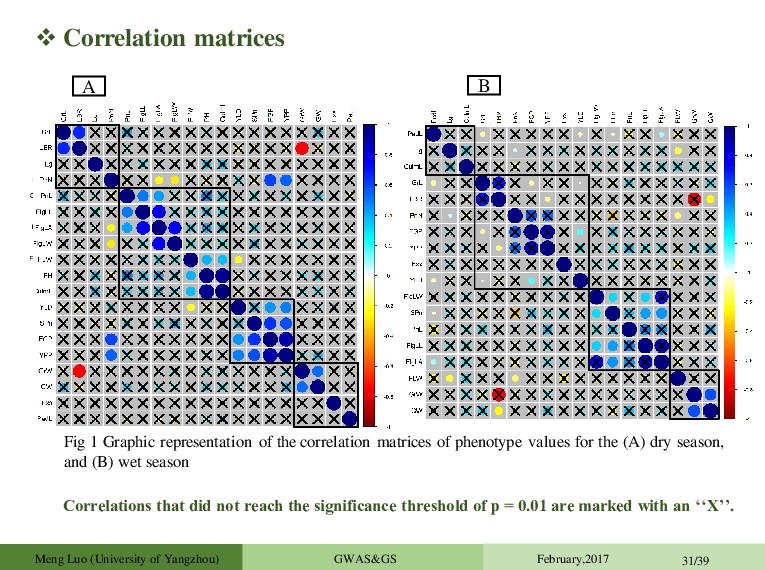
matrices of phenotype values for the (A) dry season, and (B) wet season A B Correlations that did not reach the significance threshold of p = 0.01 are marked with an ‘‘X’’. Meng Luo (University of Yangzhou) GWAS&GS February,2017 31/39
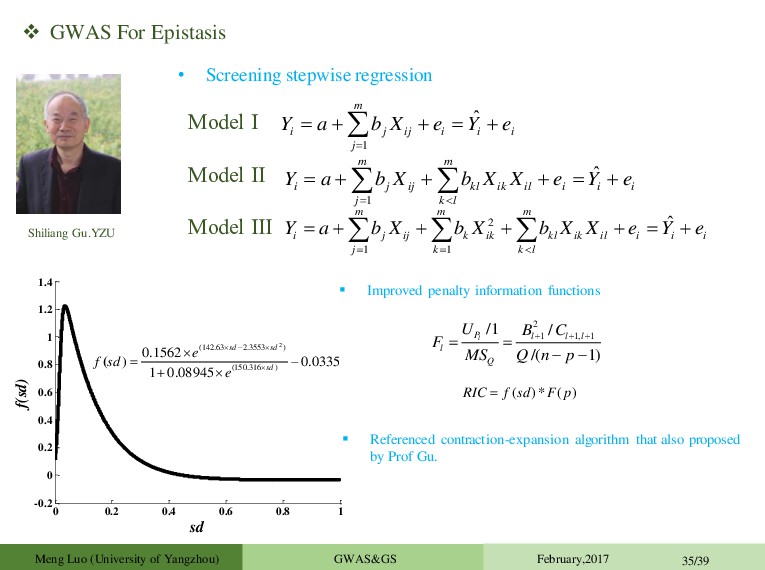
1 ˆ m i j ij i i i j Y a b X e Y e 1 ˆ m m i j ij kl ik il i i i j k l Y a b X b X X e Y e 2 1 1 ˆ m m m i j ij k ik kl ik il i i i j k k l Y a b X b X b X X e Y e Model Ⅰ Model Ⅱ Model Ⅲ 0 0.2 0.4 0.6 0.8 1 -0.2 0 0.2 0.4 0.6 0.8 1 1.2 1.4 sd f(sd) 2 (142.63 2.3553 ) (150.316 ) 0.1562 ) 0.0335 1 0.08945 ( sd sd sd e f sd e ( ) ( ) * RIC f sd F p Improved penalty information functions 2 1 1, 1 /1 / /( 1) l P l l l l Q U B C F MS Q n p Referenced contraction-expansion algorithm that also proposed by Prof Gu. Meng Luo (University of Yangzhou) GWAS&GS February,2017 35/39
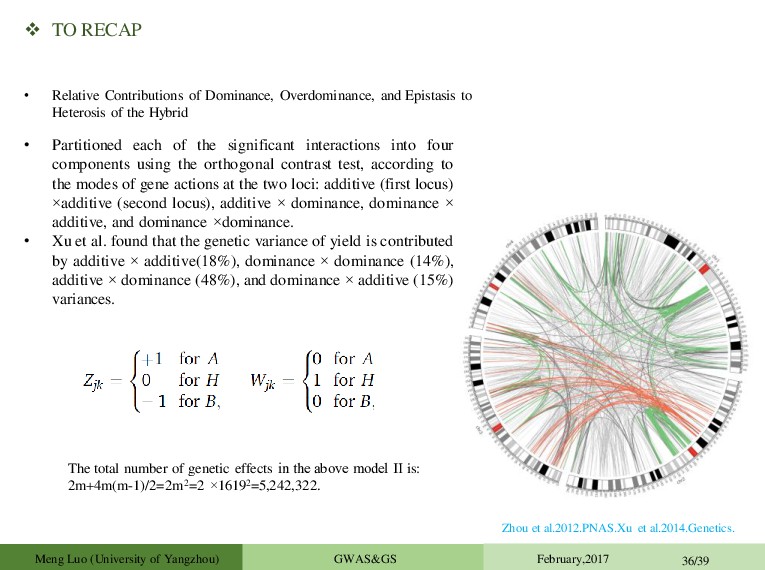
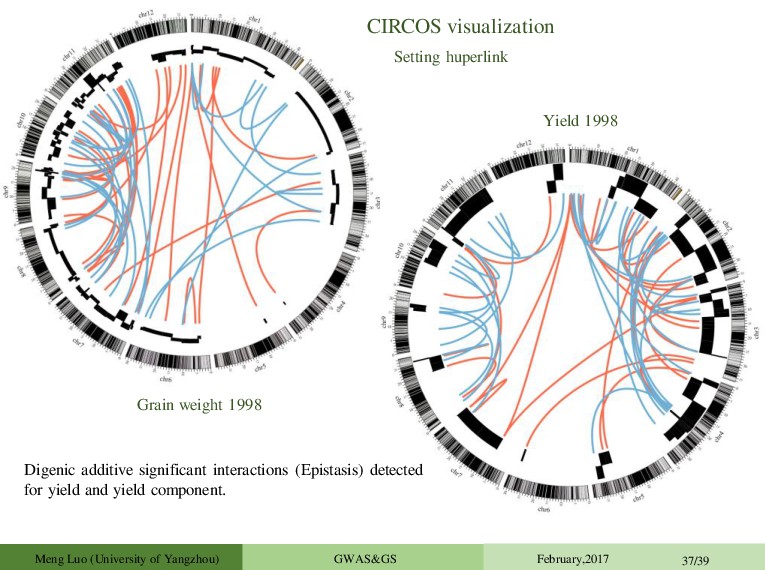
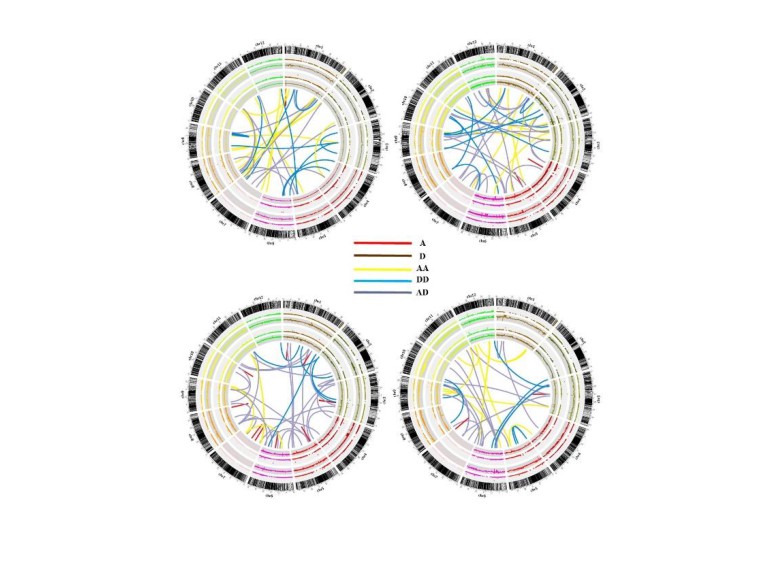
• Relative Contributions of Dominance, Overdominance, and Epistasis to Heterosis of the Hybrid • Partitioned each of the significant interactions into four components using the orthogonal contrast test, according to the modes of gene actions at the two loci: additive (first locus) ×additive (second locus), additive × dominance, dominance × additive, and dominance ×dominance. • Xu et al. found that the genetic variance of yield is contributed by additive × additive(18%), dominance × dominance (14%), additive × dominance (48%), and dominance × additive (15%) variances. Meng Luo (University of Yangzhou) GWAS&GS February,2017 36/39 The total number of genetic effects in the above model Ⅱ is: 2m+4m(m-1)/2=2m2=2 ×16192=5,242,322.
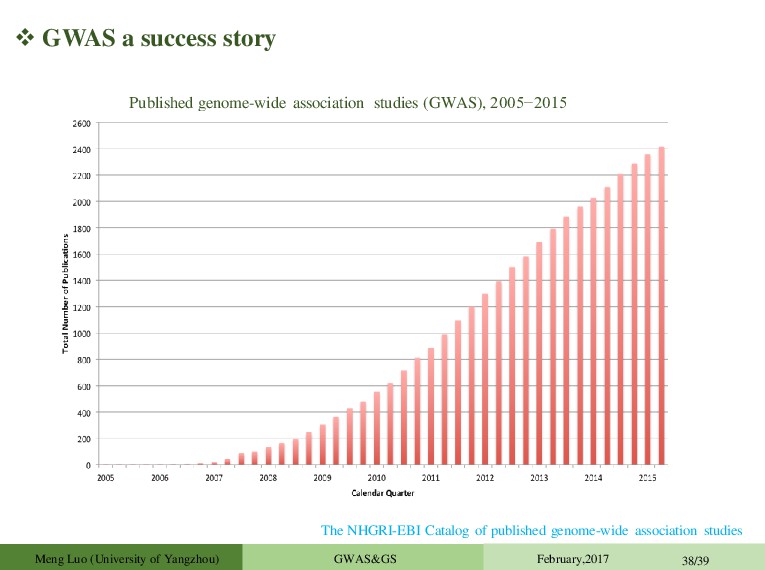
5.0×10⁻⁸ ~3000 GWAS: >25K SNPs with P ≤ 1.0×10⁻⁵ Published genome-wide association studies (GWAS), 2005−2015 The NHGRI-EBI Catalog of published genome-wide association studies Meng Luo (University of Yangzhou) GWAS&GS February,2017 38/39
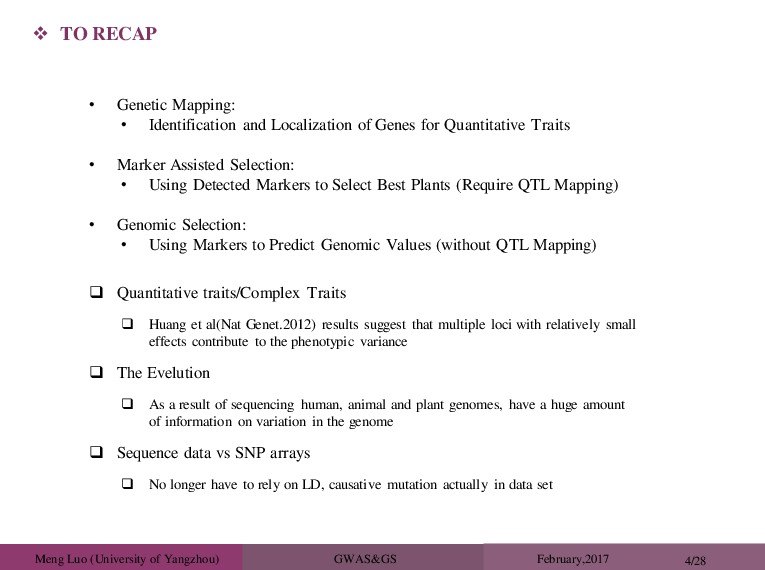
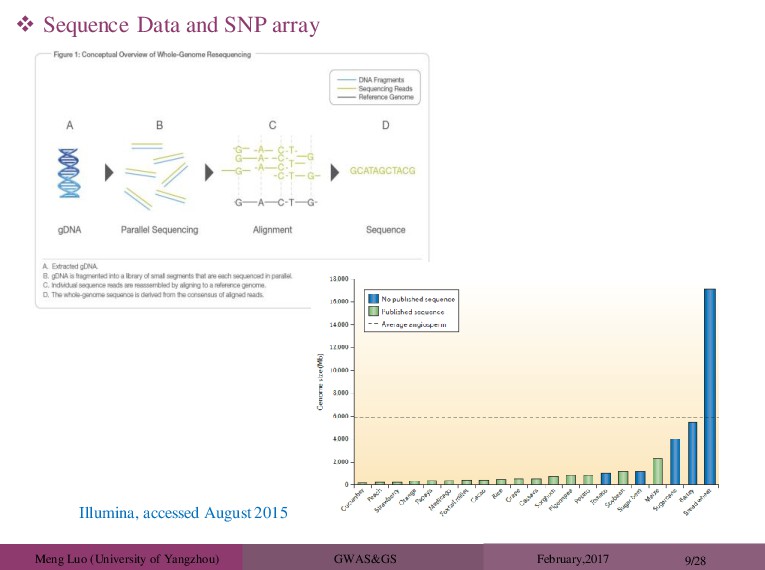
Mapping: • Identification and Localization of Genes for Quantitative Traits • Marker Assisted Selection: • Using Detected Markers to Select Best Plants (Require QTL Mapping) • Genomic Selection: • Using Markers to Predict Genomic Values (without QTL Mapping) TO RECAP Quantitative traits/Complex Traits Huang et al(Nat Genet.2012) results suggest that multiple loci with relatively small effects contribute to the phenotypic variance The Evelution As a result of sequencing human, animal and plant genomes, have a huge amount of information on variation in the genome Sequence data vs SNP arrays No longer have to rely on LD, causative mutation actually in data set
Traditional marker-assisted selection (MAS) did not result in a widespread use of DNA information in animal(plant) breeding. The main reason was that the traits of interest in livestock production(yield) were much more complex than expected: they were determined by thousands of genes with small effects on phenotype. These effects were usually too small to be statistically significant and so were ignored. Genomic selection (GS) assumes that all markers might be linked to a gene affecting the trait and concentrates on estimating their effect rather than testing its significance. Three technological breakthroughs resulted in the current wide-spread use of DNA information in animal breeding: the development of the genomic selection technology, the discovery of massive numbers of genetic markers (single nucleotide polymorphisms; SNPs), and high-throughput technology to genotype animals for (hundreds of) thousands of SNPs in a cost-effective manner. Meuwissen et al. 2016. Animal Frontiers.
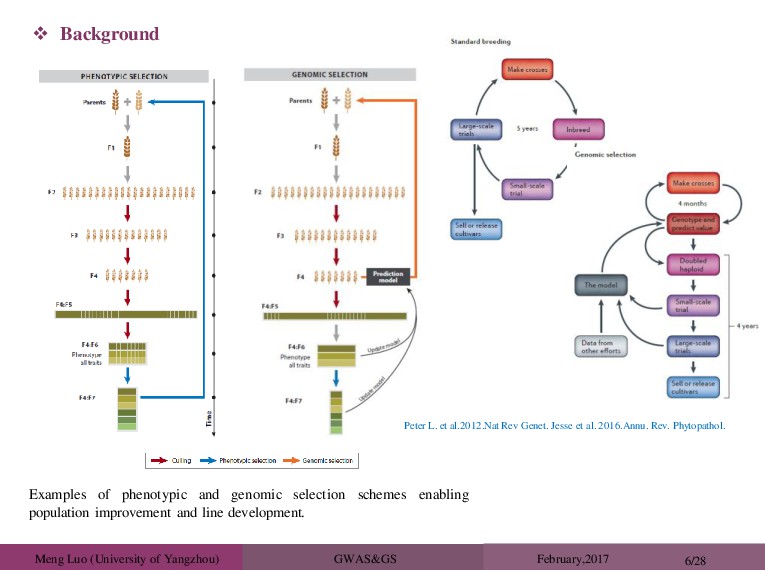
Examples of phenotypic and genomic selection schemes enabling population improvement and line development. Peter L. et al.2012.Nat Rev Genet. Jesse et al. 2016.Annu. Rev. Phytopathol.
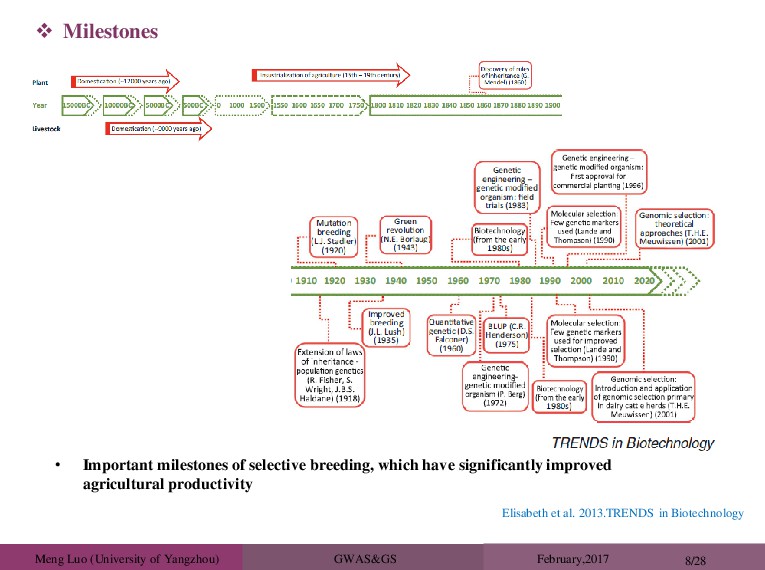
al. 2013.TRENDS in Biotechnology • Important milestones of selective breeding, which have significantly improved agricultural productivity Milestones
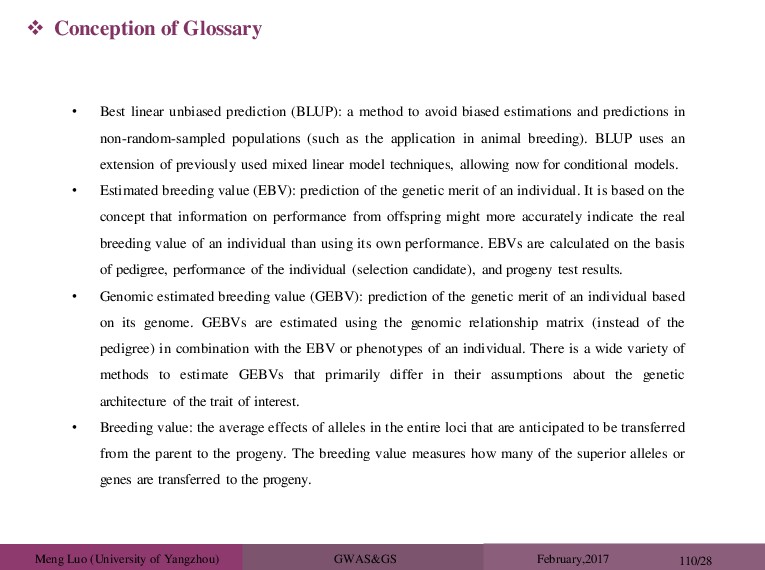
110/28 Conception of Glossary • Best linear unbiased prediction (BLUP): a method to avoid biased estimations and predictions in non-random-sampled populations (such as the application in animal breeding). BLUP uses an extension of previously used mixed linear model techniques, allowing now for conditional models. • Estimated breeding value (EBV): prediction of the genetic merit of an individual. It is based on the concept that information on performance from offspring might more accurately indicate the real breeding value of an individual than using its own performance. EBVs are calculated on the basis of pedigree, performance of the individual (selection candidate), and progeny test results. • Genomic estimated breeding value (GEBV): prediction of the genetic merit of an individual based on its genome. GEBVs are estimated using the genomic relationship matrix (instead of the pedigree) in combination with the EBV or phenotypes of an individual. There is a wide variety of methods to estimate GEBVs that primarily differ in their assumptions about the genetic architecture of the trait of interest. • Breeding value: the average effects of alleles in the entire loci that are anticipated to be transferred from the parent to the progeny. The breeding value measures how many of the superior alleles or genes are transferred to the progeny.
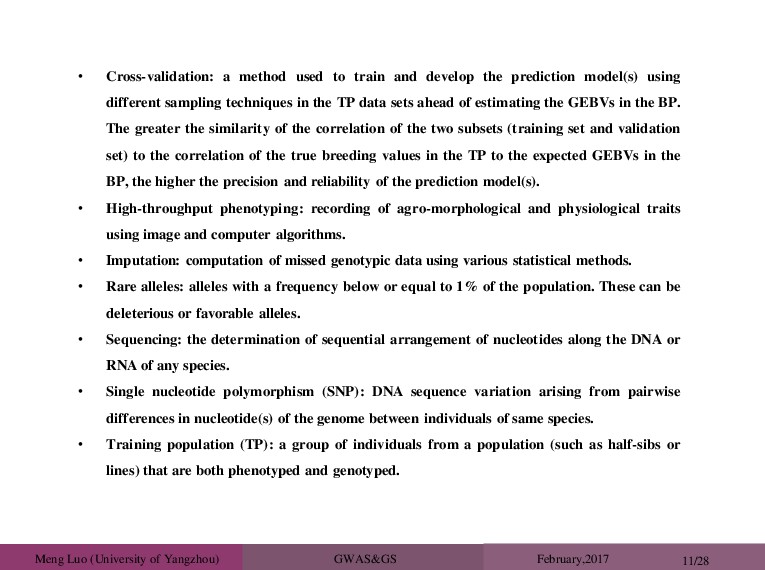
a method used to train and develop the prediction model(s) using different sampling techniques in the TP data sets ahead of estimating the GEBVs in the BP. The greater the similarity of the correlation of the two subsets (training set and validation set) to the correlation of the true breeding values in the TP to the expected GEBVs in the BP, the higher the precision and reliability of the prediction model(s). • High-throughput phenotyping: recording of agro-morphological and physiological traits using image and computer algorithms. • Imputation: computation of missed genotypic data using various statistical methods. • Rare alleles: alleles with a frequency below or equal to 1% of the population. These can be deleterious or favorable alleles. • Sequencing: the determination of sequential arrangement of nucleotides along the DNA or RNA of any species. • Single nucleotide polymorphism (SNP): DNA sequence variation arising from pairwise differences in nucleotide(s) of the genome between individuals of same species. • Training population (TP): a group of individuals from a population (such as half-sibs or lines) that are both phenotyped and genotyped. 11/28
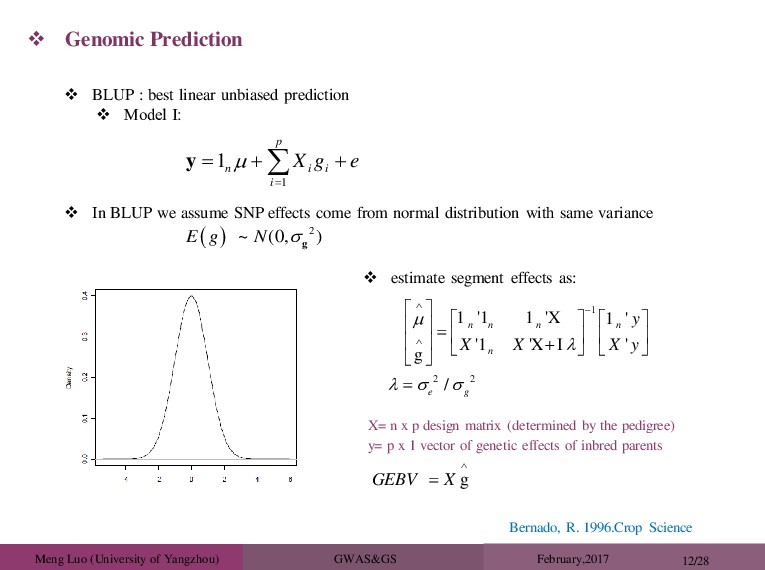
R. 1996.Crop Science Genomic Prediction 1 1 p n i i i X g e y BLUP : best linear unbiased prediction Model Ⅰ: In BLUP we assume SNP effects come from normal distribution with same variance 2 ~ 0, ( ) E g N g estimate segment effects as: 1 2 2 1 '1 1 'X 1 ' '1 'X I ' g / n n n n n e g y X X X y g GEBV X X= n x p design matrix (determined by the pedigree) y= p x 1 vector of genetic effects of inbred parents
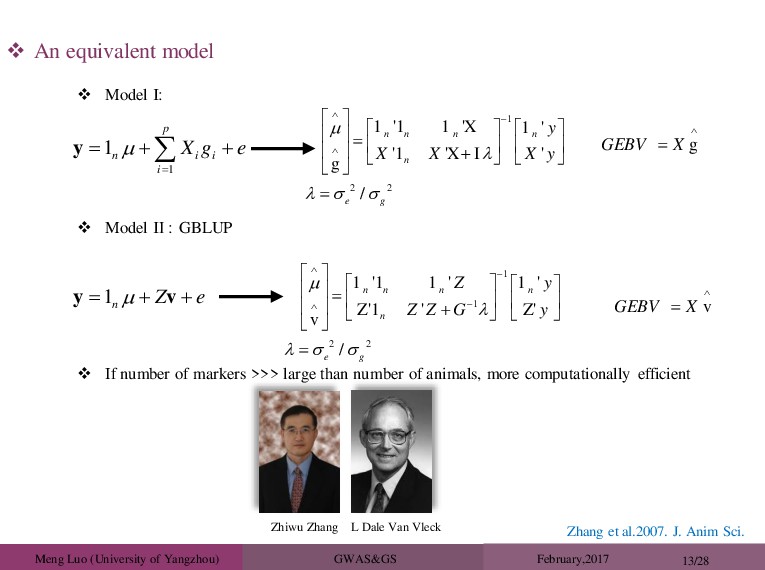
Ⅰ: 1 1 p n i i i X g e y 1 2 2 1 '1 1 'X 1 ' '1 'X I ' g / n n n n n e g y X X X y An equivalent model Model Ⅱ : 1 n Z e y v 1 1 2 2 1 '1 1 ' 1 ' Z'1 ' Z' v / n n n n n e g Z y Z Z G y g GEBV X v GEBV X GBLUP If number of markers >>> large than number of animals, more computationally efficient Zhiwu Zhang L Dale Van Vleck Zhang et al.2007. J. Anim Sci.
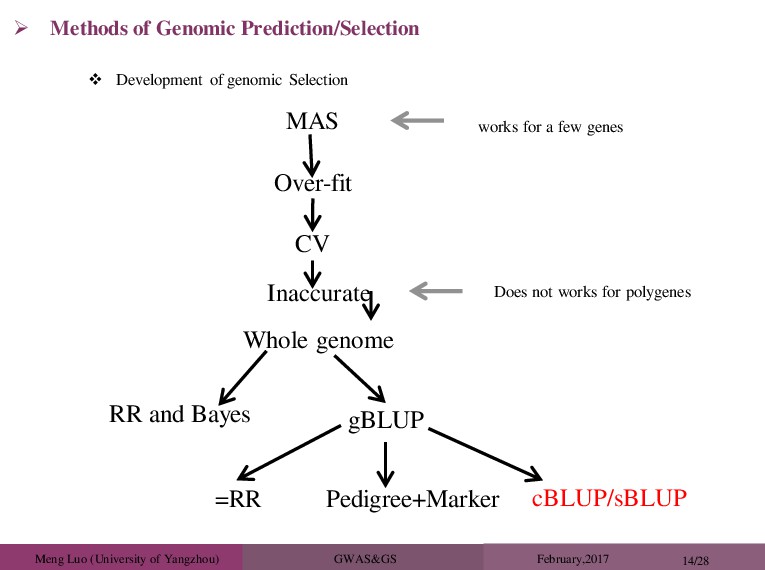
GWAS&GS February,2017 14/28 Methods of Genomic Prediction/Selection MAS Over-fit CV works for a few genes Inaccurate Does not works for polygenes Whole genome RR and Bayes gBLUP =RR Pedigree+Marker cBLUP/sBLUP
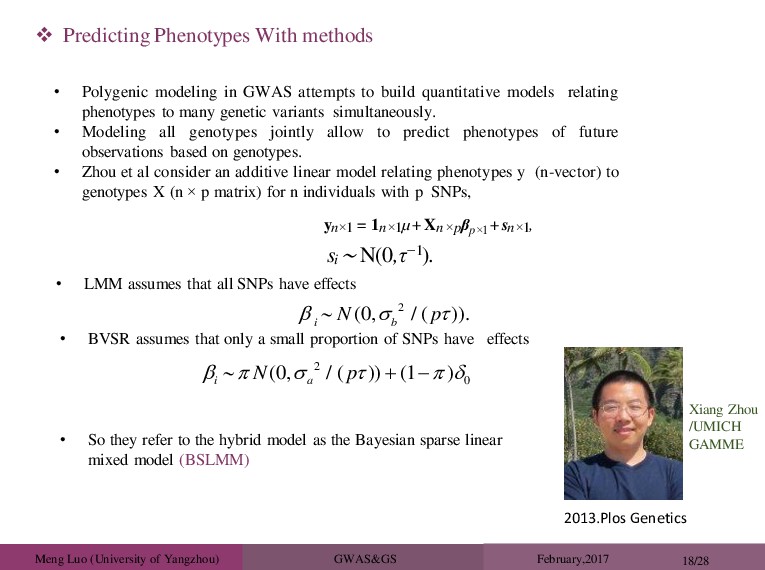
Phenotypes With methods • Polygenic modeling in GWAS attempts to build quantitative models relating phenotypes to many genetic variants simultaneously. • Modeling all genotypes jointly allow to predict phenotypes of future observations based on genotypes. • Zhou et al consider an additive linear model relating phenotypes y (n-vector) to genotypes X (n × p matrix) for n individuals with p SNPs, Xiang Zhou /UMICH GAMME 2013.Plos Genetics yn×1 = 1n×1µ+ Xn×pβp×1+ sn×1, si ∼ N(0,τ−1). • LMM assumes that all SNPs have effects 2 ( 0 ) , / . ( ) i b N p • BVSR assumes that only a small proportion of SNPs have effects 2 0 ( ( 0, / )) ( ) 1 i a N p • So they refer to the hybrid model as the Bayesian sparse linear mixed model (BSLMM)
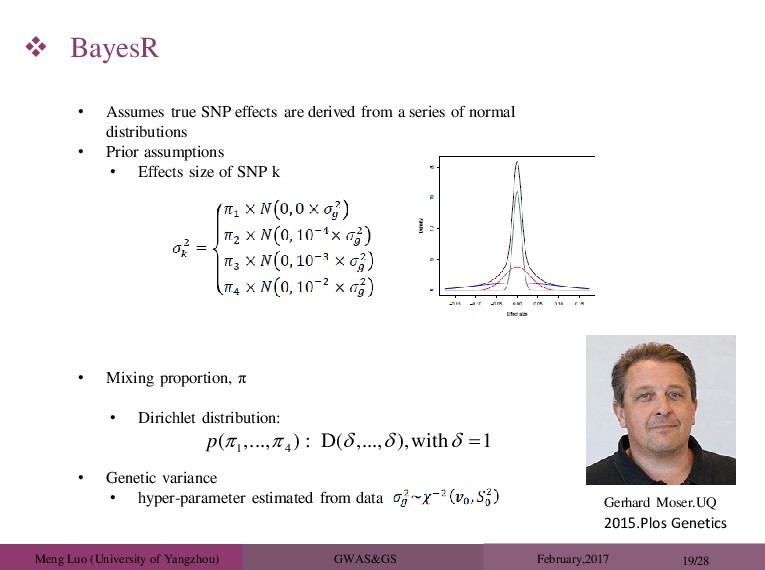
true SNP effects are derived from a series of normal distributions • Prior assumptions • Effects size of SNP k Gerhard Moser.UQ 2015.Plos Genetics BayesR • Mixing proportion, π • Dirichlet distribution: 1 4 ( ,..., ) D( ,..., ),with 1 p : • Genetic variance • hyper-parameter estimated from data
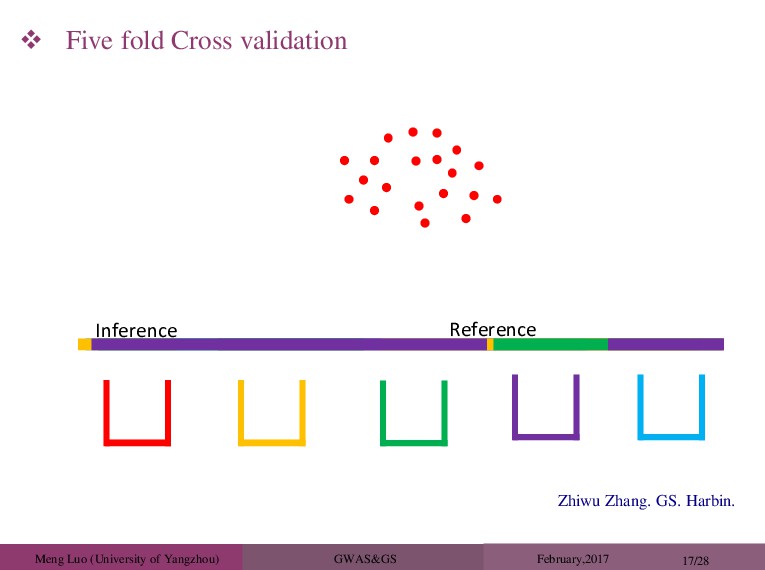
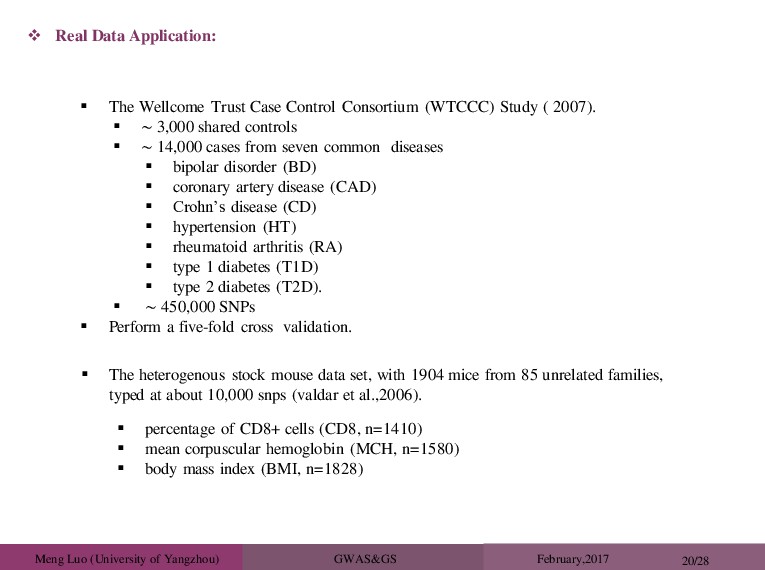
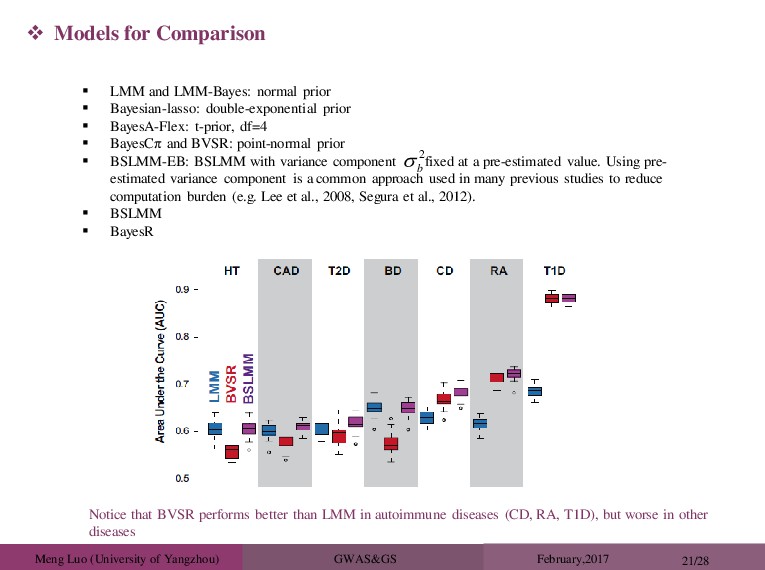
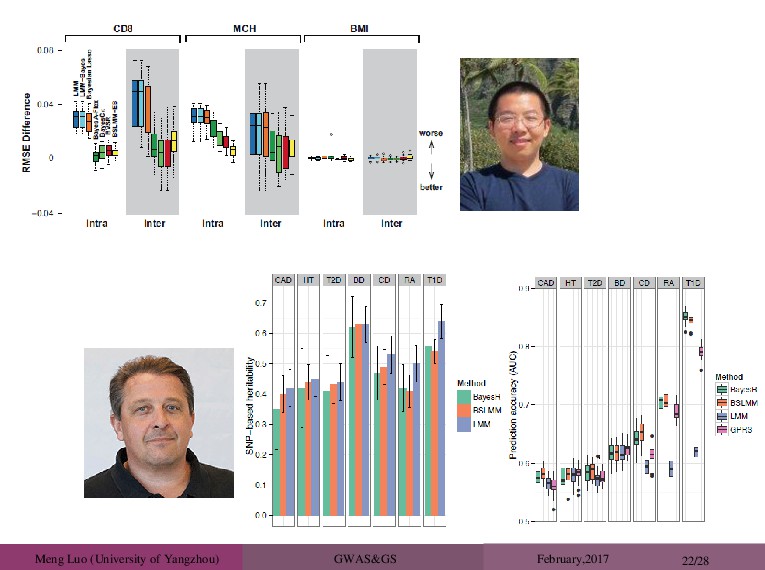
20/28 Real Data Application: The Wellcome Trust Case Control Consortium (WTCCC) Study ( 2007). ∼ 3,000 shared controls ∼ 14,000 cases from seven common diseases bipolar disorder (BD) coronary artery disease (CAD) Crohn’s disease (CD) hypertension (HT) rheumatoid arthritis (RA) type 1 diabetes (T1D) type 2 diabetes (T2D). ∼ 450,000 SNPs Perform a five-fold cross validation. The heterogenous stock mouse data set, with 1904 mice from 85 unrelated families, typed at about 10,000 snps (valdar et al.,2006). percentage of CD8+ cells (CD8, n=1410) mean corpuscular hemoglobin (MCH, n=1580) body mass index (BMI, n=1828)
and LMM-Bayes: normal prior Bayesian-lasso: double-exponential prior BayesA-Flex: t-prior, df=4 BayesCπ and BVSR: point-normal prior BSLMM-EB: BSLMM with variance component fixed at a pre-estimated value. Using pre- estimated variance component is a common approach used in many previous studies to reduce computation burden (e.g. Lee et al., 2008, Segura et al., 2012). BSLMM BayesR Models for Comparison 2 b Notice that BVSR performs better than LMM in autoimmune diseases (CD, RA, T1D), but worse in other diseases
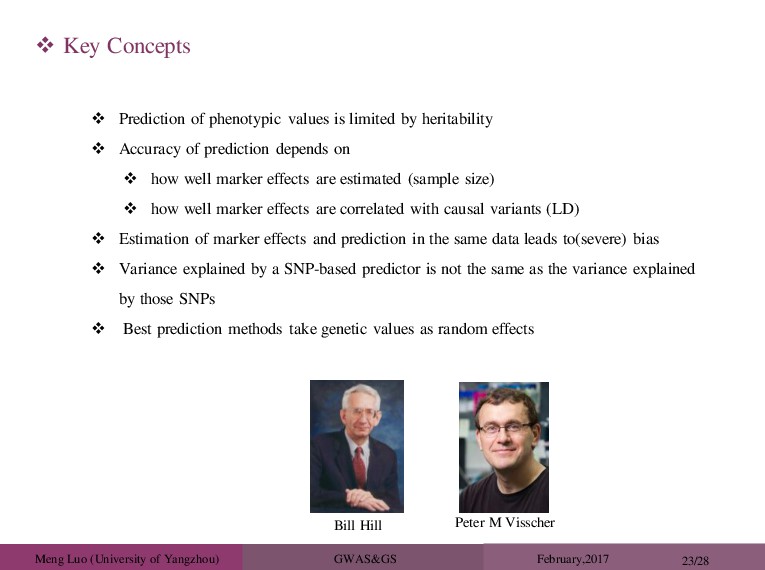
23/28 Prediction of phenotypic values is limited by heritability Accuracy of prediction depends on how well marker effects are estimated (sample size) how well marker effects are correlated with causal variants (LD) Estimation of marker effects and prediction in the same data leads to(severe) bias Variance explained by a SNP-based predictor is not the same as the variance explained by those SNPs Best prediction methods take genetic values as random effects Key Concepts Peter M Visscher Bill Hill
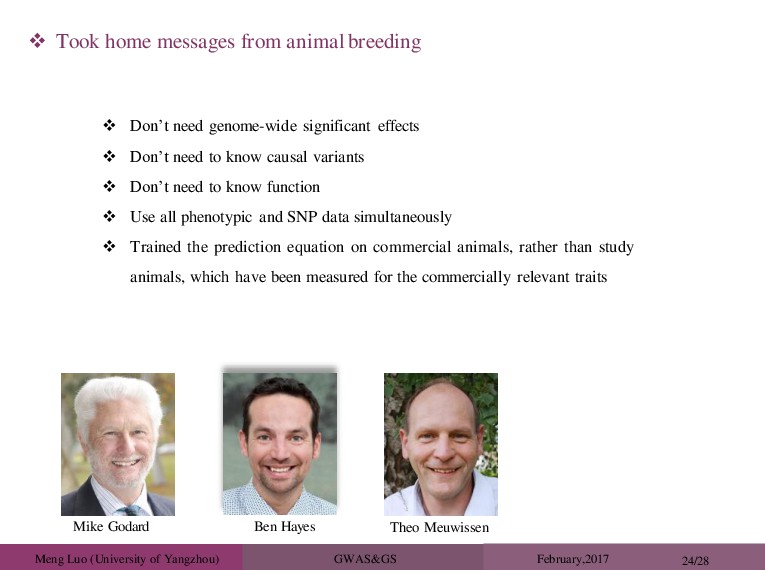
need genome-wide significant effects Don’t need to know causal variants Don’t need to know function Use all phenotypic and SNP data simultaneously Trained the prediction equation on commercial animals, rather than study animals, which have been measured for the commercially relevant traits Mike Godard Ben Hayes Took home messages from animal breeding Theo Meuwissen
Linux And Shell Script Perl And BioPerl Relational Data bases And Biological DB Biological Network Next Generation Sequencing Sequence Analysis Genome Analysis Transcriptome Analysis Metagenome Analysis
NEXT WORK PLAN Finished the TSP (Traveling Salesman Problems) For submitting Finished to use the SSR for GWAS Finished the PHG For GS Analysis Preparing the Interim Evaluation Improving This Talk
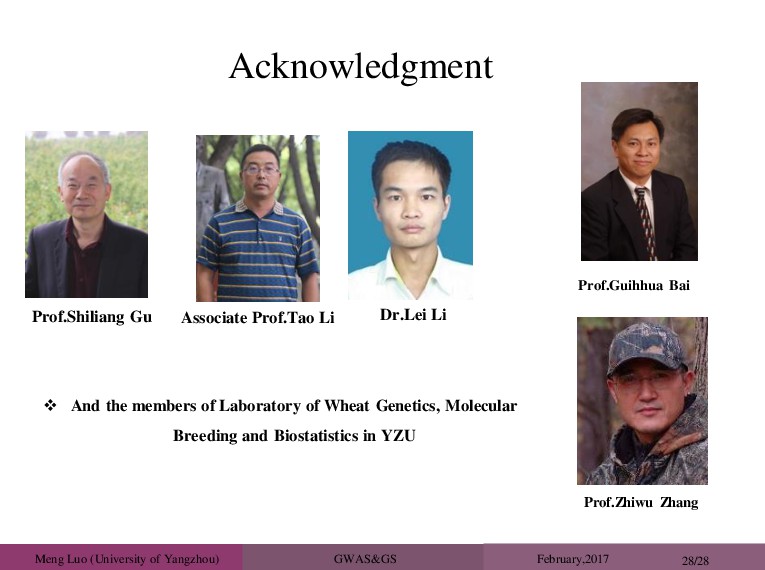
the members of Laboratory of Wheat Genetics, Molecular Breeding and Biostatistics in YZU Meng Luo (University of Yangzhou) GWAS&GS February,2017 28/28 Prof.Zhiwu Zhang Prof.Guihhua Bai