on Marketing Mix Modelling 14.1 billion euros revenue >100 Export to countries 31 Facilities in countries Employees 21,715 Member dairy farmers 15,137 millions of consumers Every day
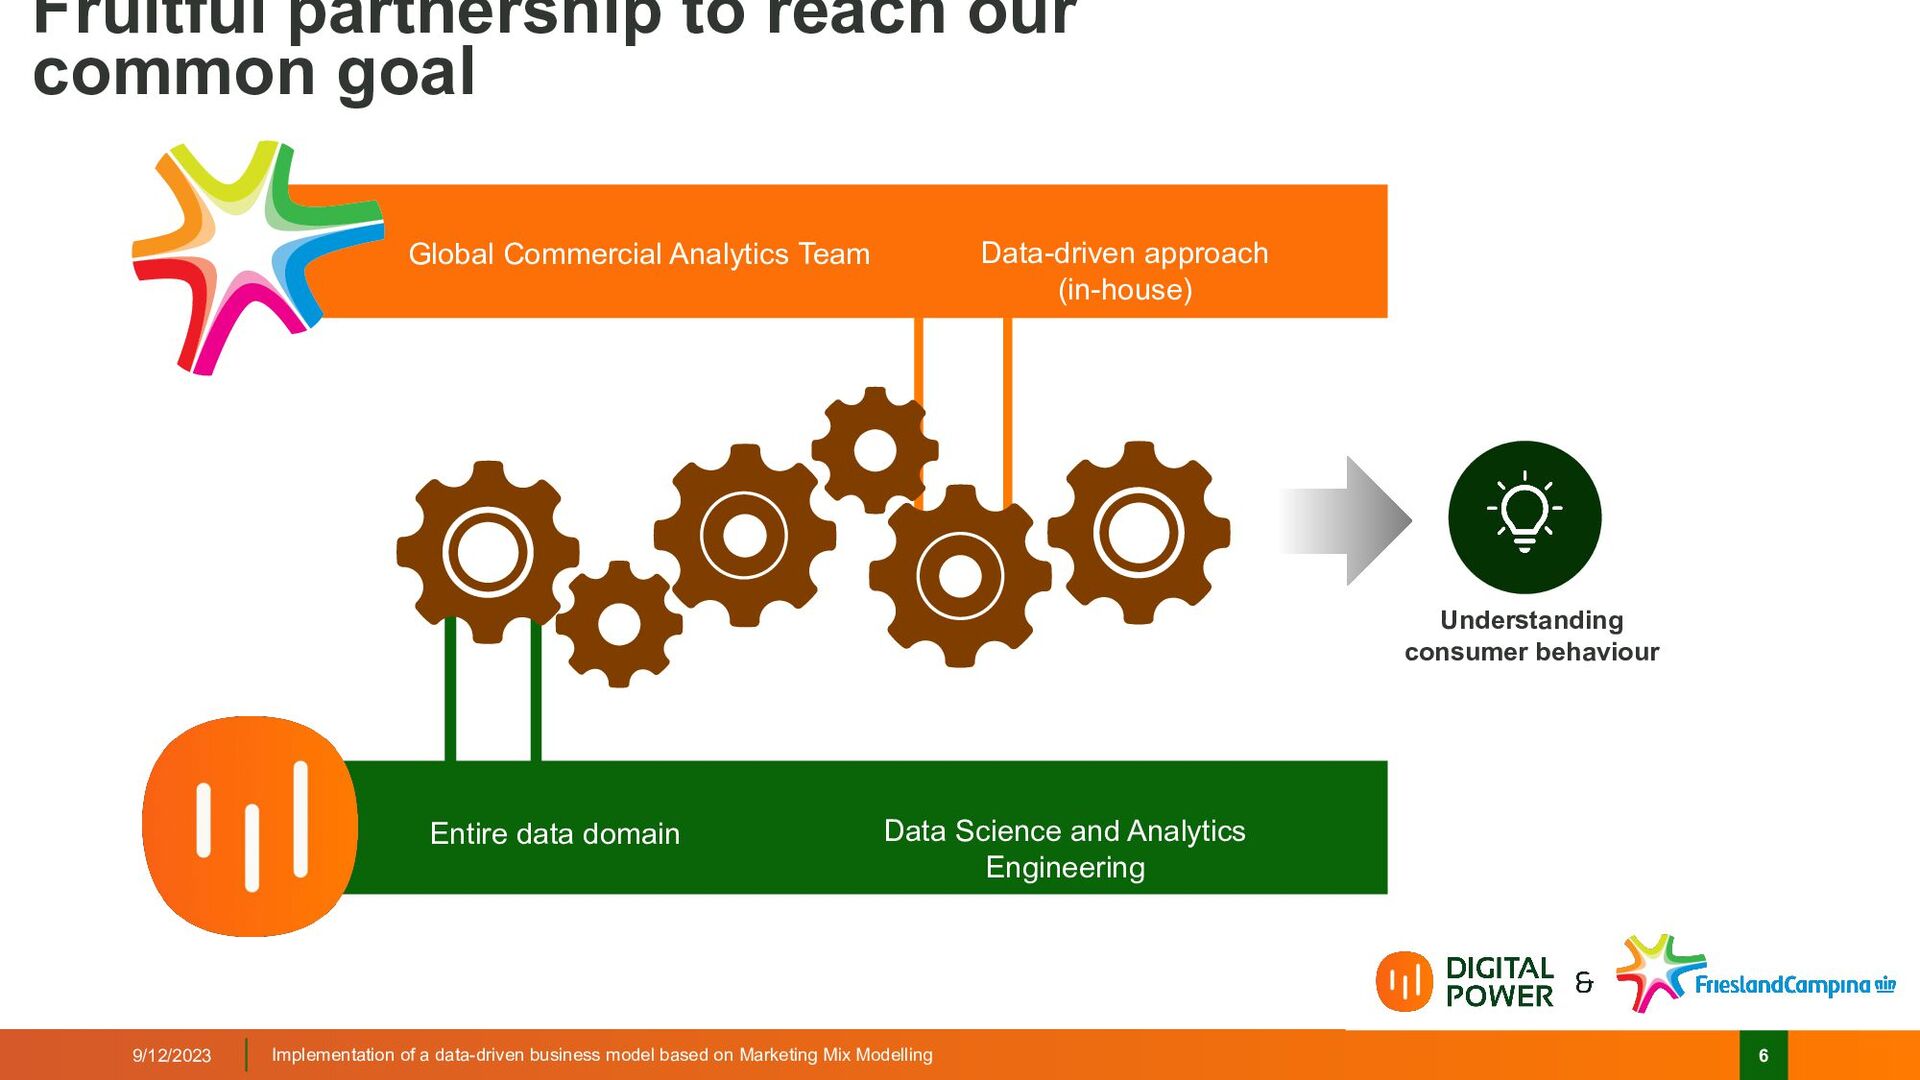
on Marketing Mix Modelling Fruitful partnership to reach our common goal Entire data domain Data Science and Analytics Engineering Global Commercial Analytics Team Data-driven approach (in-house) Understanding consumer behaviour
on Marketing Mix Modelling Identify the most important sales drivers The Power of Marketing Mix Modelling + - Lockdown Promo Price Media Competitor distribution 2 1 3 4 time
on Marketing Mix Modelling How does it technically work? Understanding Marketing Mix Modelling Phase II: Feature selection Which factors explain sales? Multiple Linear Regression Analysis & Competitio n R2 = 0.91 -0.84 +1.45 Phase I: Data ingestion Phase III: Outcome Now Past Future Target Predicted
A Category SALES VOLUME 9/12/2023 Implementation of a data-driven business model based on Marketing Mix Modelling Deep dive on key drivers – Integrated Story Storytelling with Marketing Mix Modelling Brand A Competitor
model based on Marketing Mix Modelling Deep dive on key drivers – Promo effectiveness Storytelling with Marketing Mix Modelling Competitor Switch Category Expansion Changing from other FrieslandCampina product Stock-up Promo Uplift Drive quality Promo Uplift Promo Uplift
model based on Marketing Mix Modelling Deep dive on key drivers – Media optimization Storytelling with Marketing Mix Modelling Uplift saturation Avg. monthly spend Media Uplift Avg. weekly spend Uplift saturation Model Output Media Uplift Media spend Time Media Spend


 mark3t1ng
 pwiseman
 jonyablonski
 akademiya2063
 aki_iinuma
 livdayseo
 nonsquared
 csswizardry
 gr2m
gr2m
 kevinliebholz
 aleyda
 quramy
 tamaranovitovic