Upgrade to Pro
— share decks privately, control downloads, hide ads and more …
Speaker Deck
Features
Speaker Deck
PRO
Sign in
Sign up for free
Search
Search
Ligthtning Talks at MySQL Casual Vol.3
Search
Akinori Yoshida
April 19, 2012
Technology
7.4k
3
Share
Embed
Copy iframe code
Copy JS code
Copy link
Start on current slide
Ligthtning Talks at MySQL Casual Vol.3
Akinori Yoshida
April 19, 2012
More Decks by Akinori Yoshida
See All by Akinori Yoshida
hipchat at mitsubachiworks inc.
marqs
1
8.3k
Google Analytics
marqs
0
180
Other Decks in Technology
See All in Technology
【Claude Code】鹿野さんに聞く 私の推しの並行開発環境 大公開 / claude-code-parallel-2026-07-15
tonkotsuboy_com
6
2.9k
Keeping applications secure by evolving OAuth 2.0 and OpenID Connect
ahus1
PRO
1
150
ヘルスケア領域における AI 活用と その安全性担保のための取り組み (Leveraging AI in Healthcare and Our Efforts to Ensure Its Safety) - Google I/O Extended Tokyo 2026, July 11, 2026
zettaittenani
0
240
アカウントが増えてからでは遅い? ~ マルチアカウント統制の勘所 ~
kenichinakamura
0
210
小さいから、全部わかる。— 常駐AI "xangi" のすすめ
sugupoko
0
290
型は壁、Rustでもバグを直すな、表現できなくせよ
nwiizo
12
1.9k
AIレビューはどこまで任せられるのか?自動化と人が背負うレビューの境界
sansantech
PRO
1
120
プロダクトだけじゃない、社内プロセスにおける自動化・省力化ノススメ
kakehashi
PRO
1
3.2k
cccccc
moznion
0
1.8k
美しいコードを書くためにF#を学んでみた話
yud0uhu
1
390
勉強会企画をアプリで構造化してみた 〜そこで見えた、AIとの付き合い方〜 / I've structured a study group plan using an app.
pauli
0
340
FinOps X 2026 Recap from Engineer Side #JapanFinOps
chacco38
0
270
Featured
See All Featured
jQuery: Nuts, Bolts and Bling
dougneiner
66
8.5k
The Director’s Chair: Orchestrating AI for Truly Effective Learning
tmiket
1
210
Agile Actions for Facilitating Distributed Teams - ADO2019
mkilby
0
220
Building Flexible Design Systems
yeseniaperezcruz
330
40k
職位にかかわらず全員がリーダーシップを発揮するチーム作り / Building a team where everyone can demonstrate leadership regardless of position
madoxten
63
55k
State of Search Keynote: SEO is Dead Long Live SEO
ryanjones
0
220
Paper Plane (Part 1)
katiecoart
PRO
0
9.5k
Taking LLMs out of the black box: A practical guide to human-in-the-loop distillation
inesmontani
PRO
3
2.3k
Statistics for Hackers
jakevdp
799
230k
Building a Scalable Design System with Sketch
lauravandoore
463
34k
Bootstrapping a Software Product
garrettdimon
PRO
307
120k
Designing Powerful Visuals for Engaging Learning
tmiket
1
440
Transcript
MySQL Casual Talks Vol.3 Lightning Talks Akinori Yoshida @marqs
mitsubachiworks inc.
We love Maatkit
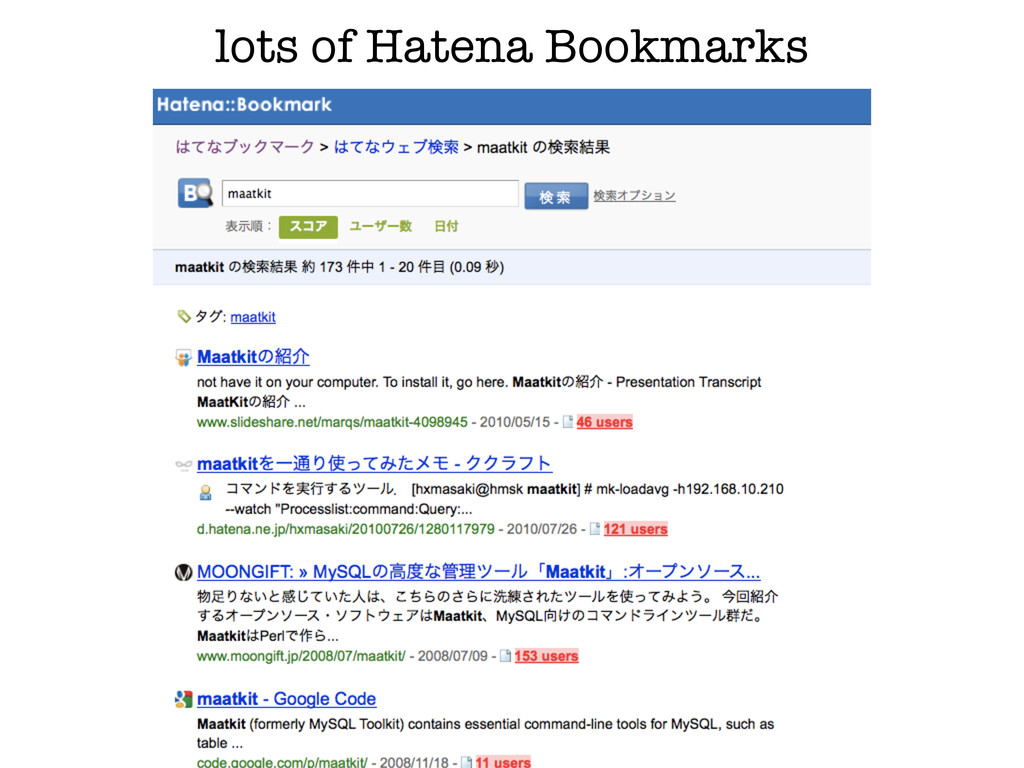
lots of Hatena Bookmarks
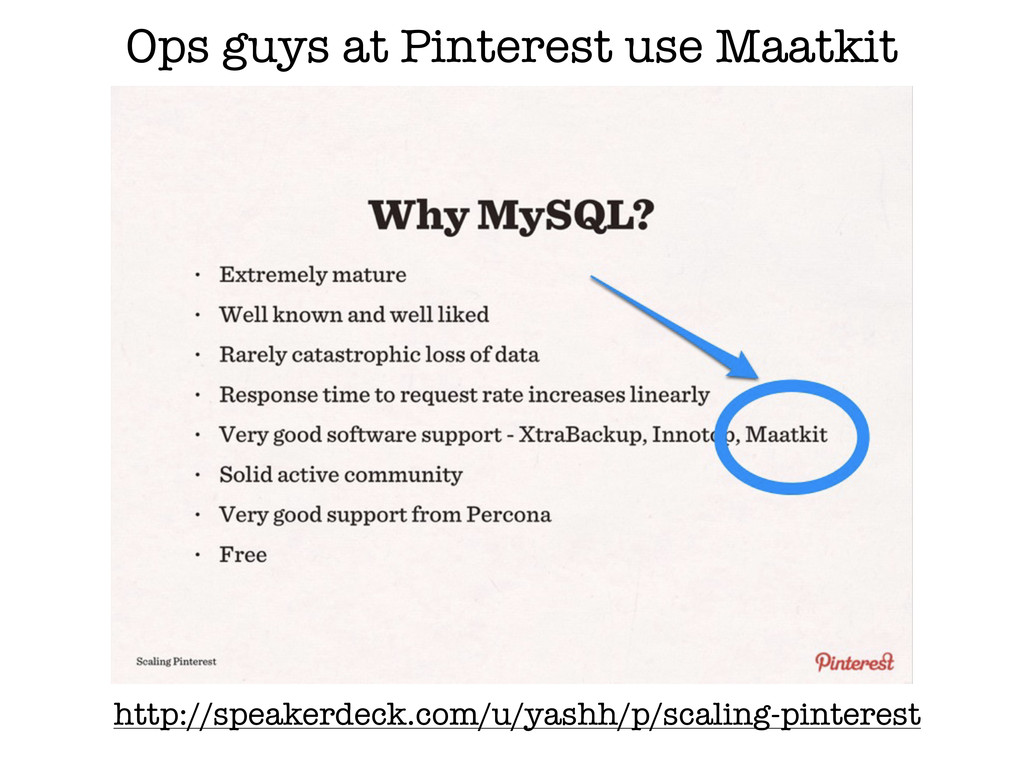
Ops guys at Pinterest use Maatkit http://speakerdeck.com/u/yashh/p/scaling-pinterest
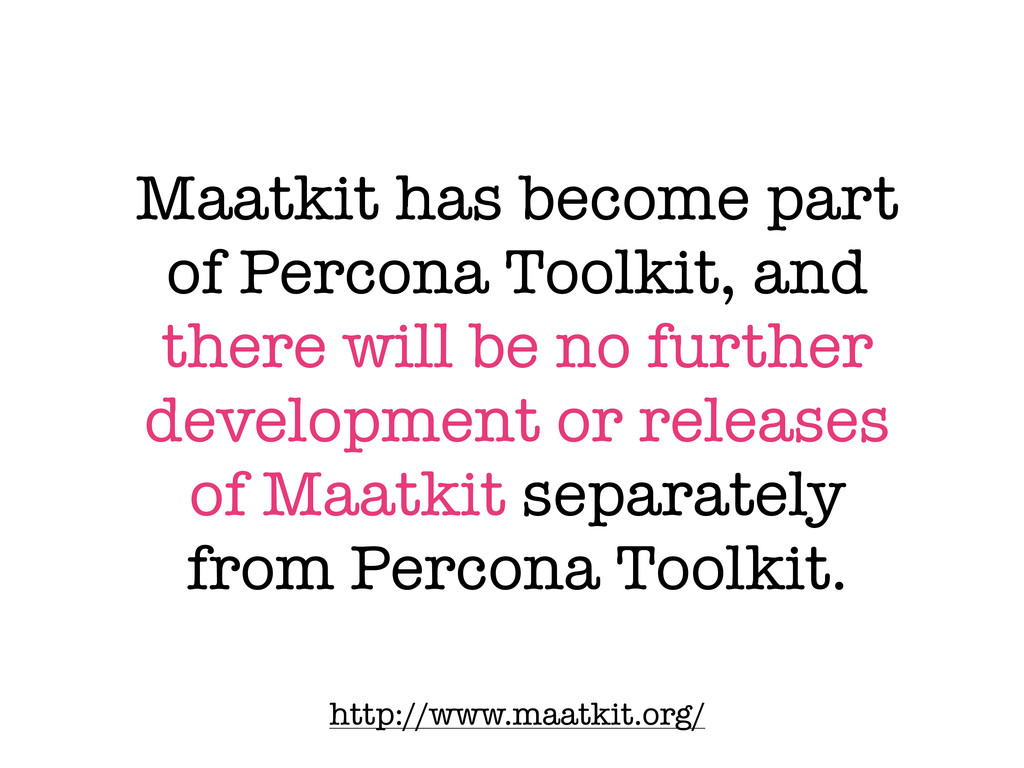
Maatkit has become part of Percona Toolkit, and there will
be no further development or releases of Maatkit separately from Percona Toolkit. http://www.maatkit.org/
Maatkit Percona Toolkit
Percona Toolkit is derived from Maatkit and Aspersa, two of
the best- known toolkits for MySQL server administration. It is developed and supported by Percona Inc. http://www.percona.com/software/percona-toolkit/
some new tools.
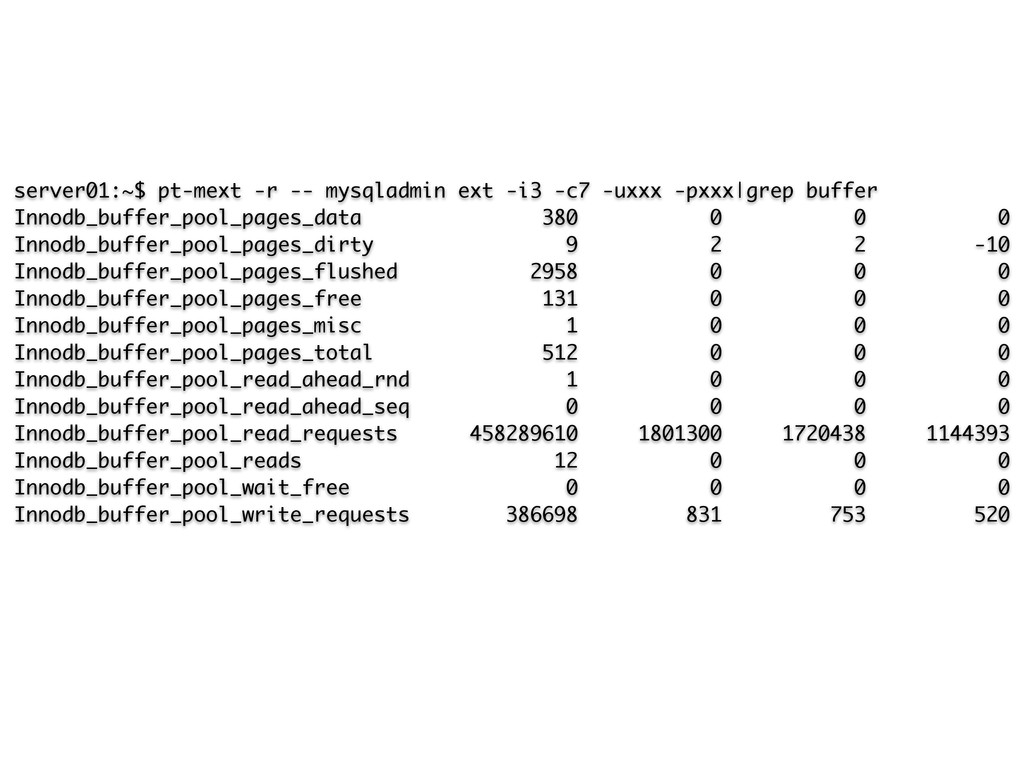
pt-mext
Look at many samples of MySQL SHOW GLOBAL STATUS side-by-side.
http://www.percona.com/doc/percona-toolkit/2.1/pt-mext.html
server01:~$ pt-mext -r -- mysqladmin ext -i3 -c7 -uxxx -pxxx|grep
buffer Innodb_buffer_pool_pages_data 380 0 0 0 Innodb_buffer_pool_pages_dirty 9 2 2 -10 Innodb_buffer_pool_pages_flushed 2958 0 0 0 Innodb_buffer_pool_pages_free 131 0 0 0 Innodb_buffer_pool_pages_misc 1 0 0 0 Innodb_buffer_pool_pages_total 512 0 0 0 Innodb_buffer_pool_read_ahead_rnd 1 0 0 0 Innodb_buffer_pool_read_ahead_seq 0 0 0 0 Innodb_buffer_pool_read_requests 458289610 1801300 1720438 1144393 Innodb_buffer_pool_reads 12 0 0 0 Innodb_buffer_pool_wait_free 0 0 0 0 Innodb_buffer_pool_write_requests 386698 831 753 520
pt-online-schema-change
@kazeburo
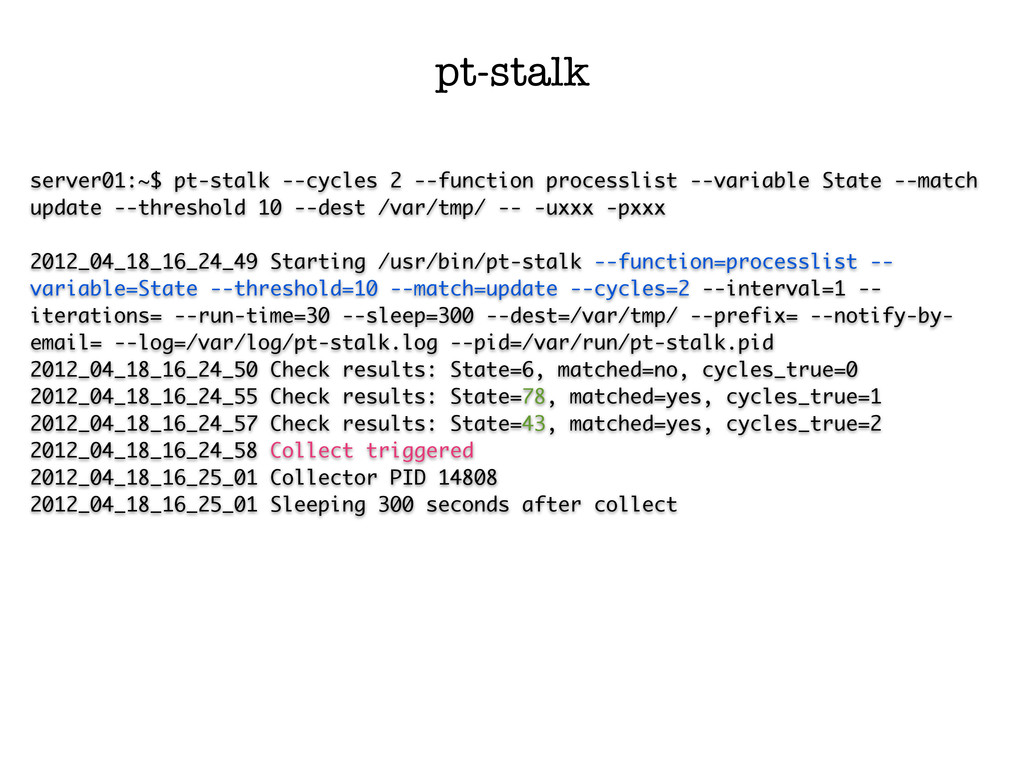
pt-stalk
How do you solve intermittent MySQL problems when you can’t
observe them? That’s why pt-stalk exists. http://www.percona.com/doc/percona-toolkit/2.1/pt-stalk.html
define the trigger with the --function, --variable, and -- threshold
options http://www.percona.com/doc/percona-toolkit/2.1/pt-stalk.html
server01:~$ pt-stalk --cycles 2 --function processlist --variable State --match update
--threshold 10 --dest /var/tmp/ -- -uxxx -pxxx 2012_04_18_16_24_49 Starting /usr/bin/pt-stalk --function=processlist -- variable=State --threshold=10 --match=update --cycles=2 --interval=1 -- iterations= --run-time=30 --sleep=300 --dest=/var/tmp/ --prefix= --notify-by- email= --log=/var/log/pt-stalk.log --pid=/var/run/pt-stalk.pid 2012_04_18_16_24_50 Check results: State=6, matched=no, cycles_true=0 2012_04_18_16_24_55 Check results: State=78, matched=yes, cycles_true=1 2012_04_18_16_24_57 Check results: State=43, matched=yes, cycles_true=2 2012_04_18_16_24_58 Collect triggered 2012_04_18_16_25_01 Collector PID 14808 2012_04_18_16_25_01 Sleeping 300 seconds after collect pt-stalk
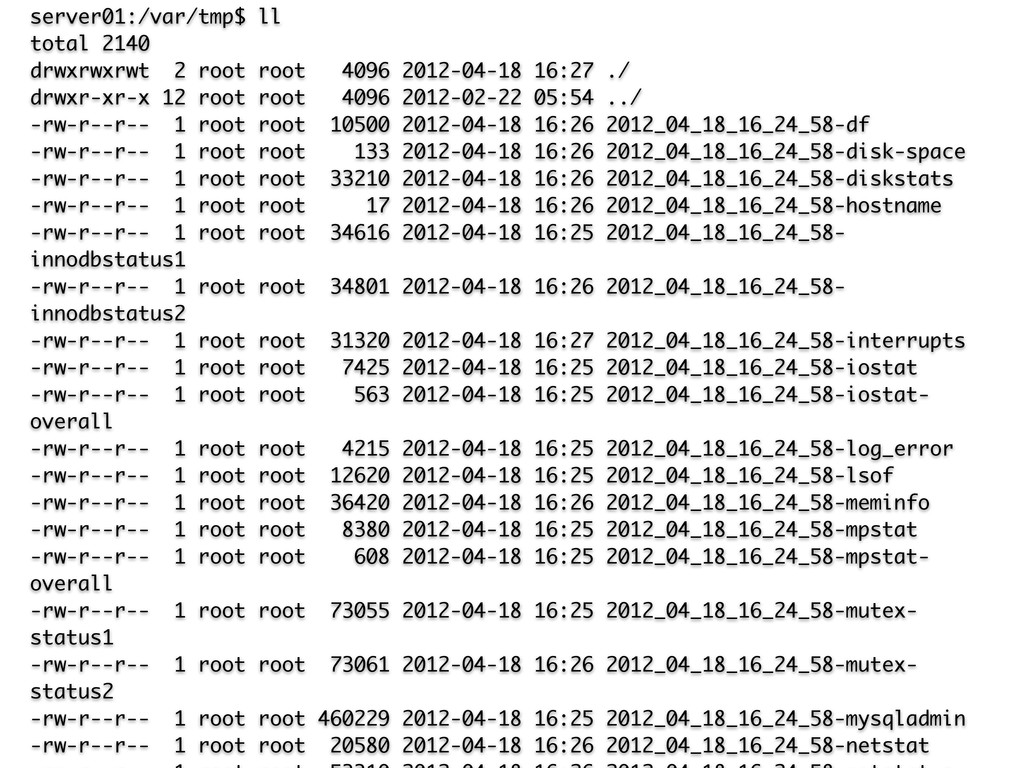
server01:/var/tmp$ ll total 2140 drwxrwxrwt 2 root root 4096 2012-04-18
16:27 ./ drwxr-xr-x 12 root root 4096 2012-02-22 05:54 ../ -rw-r--r-- 1 root root 10500 2012-04-18 16:26 2012_04_18_16_24_58-df -rw-r--r-- 1 root root 133 2012-04-18 16:26 2012_04_18_16_24_58-disk-space -rw-r--r-- 1 root root 33210 2012-04-18 16:26 2012_04_18_16_24_58-diskstats -rw-r--r-- 1 root root 17 2012-04-18 16:26 2012_04_18_16_24_58-hostname -rw-r--r-- 1 root root 34616 2012-04-18 16:25 2012_04_18_16_24_58- innodbstatus1 -rw-r--r-- 1 root root 34801 2012-04-18 16:26 2012_04_18_16_24_58- innodbstatus2 -rw-r--r-- 1 root root 31320 2012-04-18 16:27 2012_04_18_16_24_58-interrupts -rw-r--r-- 1 root root 7425 2012-04-18 16:25 2012_04_18_16_24_58-iostat -rw-r--r-- 1 root root 563 2012-04-18 16:25 2012_04_18_16_24_58-iostat- overall -rw-r--r-- 1 root root 4215 2012-04-18 16:25 2012_04_18_16_24_58-log_error -rw-r--r-- 1 root root 12620 2012-04-18 16:25 2012_04_18_16_24_58-lsof -rw-r--r-- 1 root root 36420 2012-04-18 16:26 2012_04_18_16_24_58-meminfo -rw-r--r-- 1 root root 8380 2012-04-18 16:25 2012_04_18_16_24_58-mpstat -rw-r--r-- 1 root root 608 2012-04-18 16:25 2012_04_18_16_24_58-mpstat- overall -rw-r--r-- 1 root root 73055 2012-04-18 16:25 2012_04_18_16_24_58-mutex- status1 -rw-r--r-- 1 root root 73061 2012-04-18 16:26 2012_04_18_16_24_58-mutex- status2 -rw-r--r-- 1 root root 460229 2012-04-18 16:25 2012_04_18_16_24_58-mysqladmin -rw-r--r-- 1 root root 20580 2012-04-18 16:26 2012_04_18_16_24_58-netstat
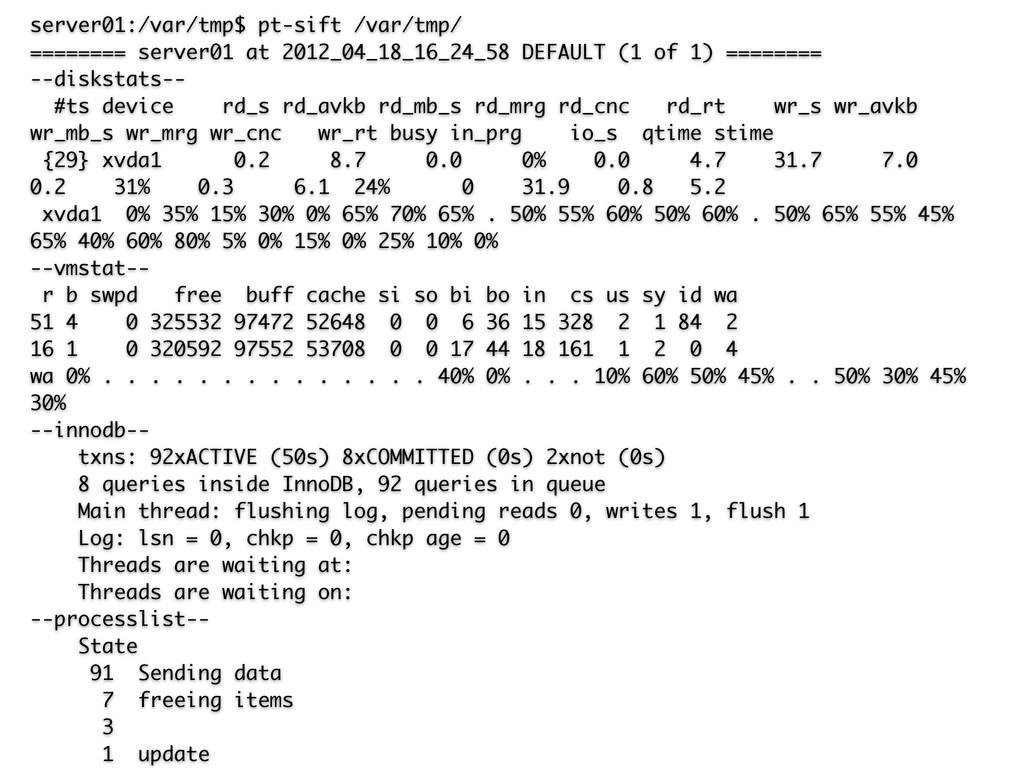
server01:/var/tmp$ pt-sift /var/tmp/ ======== server01 at 2012_04_18_16_24_58 DEFAULT (1 of
1) ======== --diskstats-- #ts device rd_s rd_avkb rd_mb_s rd_mrg rd_cnc rd_rt wr_s wr_avkb wr_mb_s wr_mrg wr_cnc wr_rt busy in_prg io_s qtime stime {29} xvda1 0.2 8.7 0.0 0% 0.0 4.7 31.7 7.0 0.2 31% 0.3 6.1 24% 0 31.9 0.8 5.2 xvda1 0% 35% 15% 30% 0% 65% 70% 65% . 50% 55% 60% 50% 60% . 50% 65% 55% 45% 65% 40% 60% 80% 5% 0% 15% 0% 25% 10% 0% --vmstat-- r b swpd free buff cache si so bi bo in cs us sy id wa 51 4 0 325532 97472 52648 0 0 6 36 15 328 2 1 84 2 16 1 0 320592 97552 53708 0 0 17 44 18 161 1 2 0 4 wa 0% . . . . . . . . . . . . . . 40% 0% . . . 10% 60% 50% 45% . . 50% 30% 45% 30% --innodb-- txns: 92xACTIVE (50s) 8xCOMMITTED (0s) 2xnot (0s) 8 queries inside InnoDB, 92 queries in queue Main thread: flushing log, pending reads 0, writes 1, flush 1 Log: lsn = 0, chkp = 0, chkp age = 0 Threads are waiting at: Threads are waiting on: --processlist-- State 91 Sending data 7 freeing items 3 1 update
very powerful if we can set appropriate trigger :)
one big drawback
Percona Toolkit does *not* have a tool correspond to mk-slave-move
http://www.percona.com/software/percona-toolkit/
thanks!!