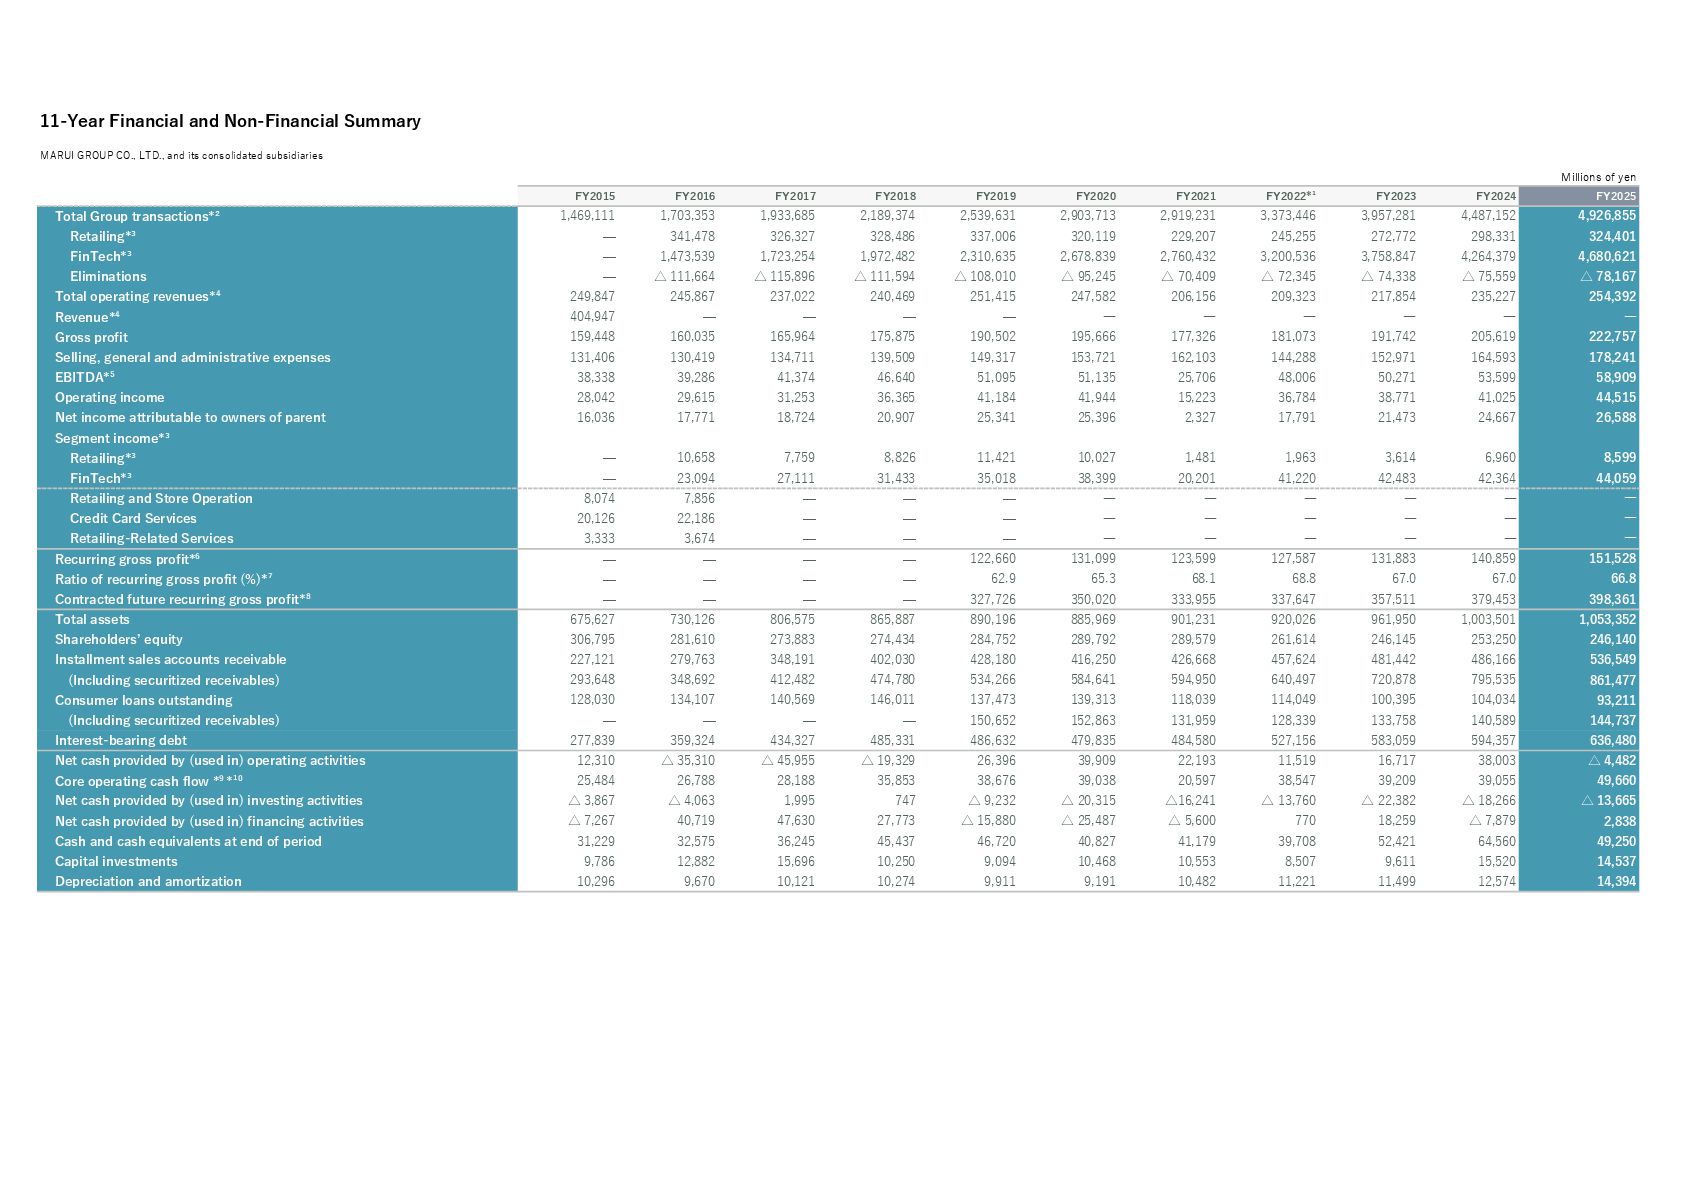
FY2022*¹ FY2023 FY2024 FY2025 Total Group transactions*² 1,469,111 1,703,353 1,933,685 2,189,374 2,539,631 2,903,713 2,919,231 3,373,446 3,957,281 4,487,152 4,926,855 Retailing*³ ̶ 341,478 326,327 328,486 337,006 320,119 229,207 245,255 272,772 298,331 324,401 FinTech*³ ̶ 1,473,539 1,723,254 1,972,482 2,310,635 2,678,839 2,760,432 3,200,536 3,758,847 4,264,379 4,680,621 Eliminations ̶ △ 111,664 △ 115,896 △ 111,594 △ 108,010 △ 95,245 △ 70,409 △ 72,345 △ 74,338 △ 75,559 △ 78,167 Total operating revenues*⁴ 249,847 245,867 237,022 240,469 251,415 247,582 206,156 209,323 217,854 235,227 254,392 Revenue*⁴ 404,947 ̶ ̶ ̶ ̶ ― ― ― ― ― ― Gross profit 159,448 160,035 165,964 175,875 190,502 195,666 177,326 181,073 191,742 205,619 222,757 Selling, general and administrative expenses 131,406 130,419 134,711 139,509 149,317 153,721 162,103 144,288 152,971 164,593 178,241 EBITDA*⁵ 38,338 39,286 41,374 46,640 51,095 51,135 25,706 48,006 50,271 53,599 58,909 Operating income 28,042 29,615 31,253 36,365 41,184 41,944 15,223 36,784 38,771 41,025 44,515 Net income attributable to owners of parent 16,036 17,771 18,724 20,907 25,341 25,396 2,327 17,791 21,473 24,667 26,588 Segment income*³ Retailing*³ ̶ 10,658 7,759 8,826 11,421 10,027 1,481 1,963 3,614 6,960 8,599 FinTech*³ ̶ 23,094 27,111 31,433 35,018 38,399 20,201 41,220 42,483 42,364 44,059 Retailing and Store Operation 8,074 7,856 ̶ ̶ ̶ ― ― ― ― ― ― Credit Card Services 20,126 22,186 ̶ ̶ ̶ ― ― ― ― ― ― Retailing-Related Services 3,333 3,674 ̶ ̶ ̶ ― ― ― ― ― ― Recurring gross profit*⁶ ̶ ̶ ̶ ̶ 122,660 131,099 123,599 127,587 131,883 140,859 151,528 Ratio of recurring gross profit (%)*⁷ ̶ ̶ ̶ ̶ 62.9 65.3 68.1 68.8 67.0 67.0 66.8 Contracted future recurring gross profit*⁸ ̶ ̶ ̶ ̶ 327,726 350,020 333,955 337,647 357,511 379,453 398,361 Total assets 675,627 730,126 806,575 865,887 890,196 885,969 901,231 920,026 961,950 1,003,501 1,053,352 Shareholders’ equity 306,795 281,610 273,883 274,434 284,752 289,792 289,579 261,614 246,145 253,250 246,140 Installment sales accounts receivable 227,121 279,763 348,191 402,030 428,180 416,250 426,668 457,624 481,442 486,166 536,549 (Including securitized receivables) 293,648 348,692 412,482 474,780 534,266 584,641 594,950 640,497 720,878 795,535 861,477 Consumer loans outstanding 128,030 134,107 140,569 146,011 137,473 139,313 118,039 114,049 100,395 104,034 93,211 (Including securitized receivables) ̶ ̶ ̶ ̶ 150,652 152,863 131,959 128,339 133,758 140,589 144,737 Interest-bearing debt 277,839 359,324 434,327 485,331 486,632 479,835 484,580 527,156 583,059 594,357 636,480 Net cash provided by (used in) operating activities 12,310 △ 35,310 △ 45,955 △ 19,329 26,396 39,909 22,193 11,519 16,717 38,003 △ 4,482 Core operating cash flow *⁹ *¹⁰ 25,484 26,788 28,188 35,853 38,676 39,038 20,597 38,547 39,209 39,055 49,660 Net cash provided by (used in) investing activities △ 3,867 △ 4,063 1,995 747 △ 9,232 △ 20,315 △16,241 △ 13,760 △ 22,382 △ 18,266 △ 13,665 Net cash provided by (used in) financing activities △ 7,267 40,719 47,630 27,773 △ 15,880 △ 25,487 △ 5,600 770 18,259 △ 7,879 2,838 Cash and cash equivalents at end of period 31,229 32,575 36,245 45,437 46,720 40,827 41,179 39,708 52,421 64,560 49,250 Capital investments 9,786 12,882 15,696 10,250 9,094 10,468 10,553 8,507 9,611 15,520 14,537 Depreciation and amortization 10,296 9,670 10,121 10,274 9,911 9,191 10,482 11,221 11,499 12,574 14,394 11-Year Financial and Non-Financial Summary MARUI GROUP CO., LTD., and its consolidated subsidiaries