human mobility and behaviour International Workshop on the Impact of Human Mobility in Pervasive Systems and Applications (PerMoby) 19 March 2012 Gualtiero Colombo, Martin Chorley, Matthew Williams, Stuart Allen, Roger Whitaker Cardiff University School of Computer Science & Informatics
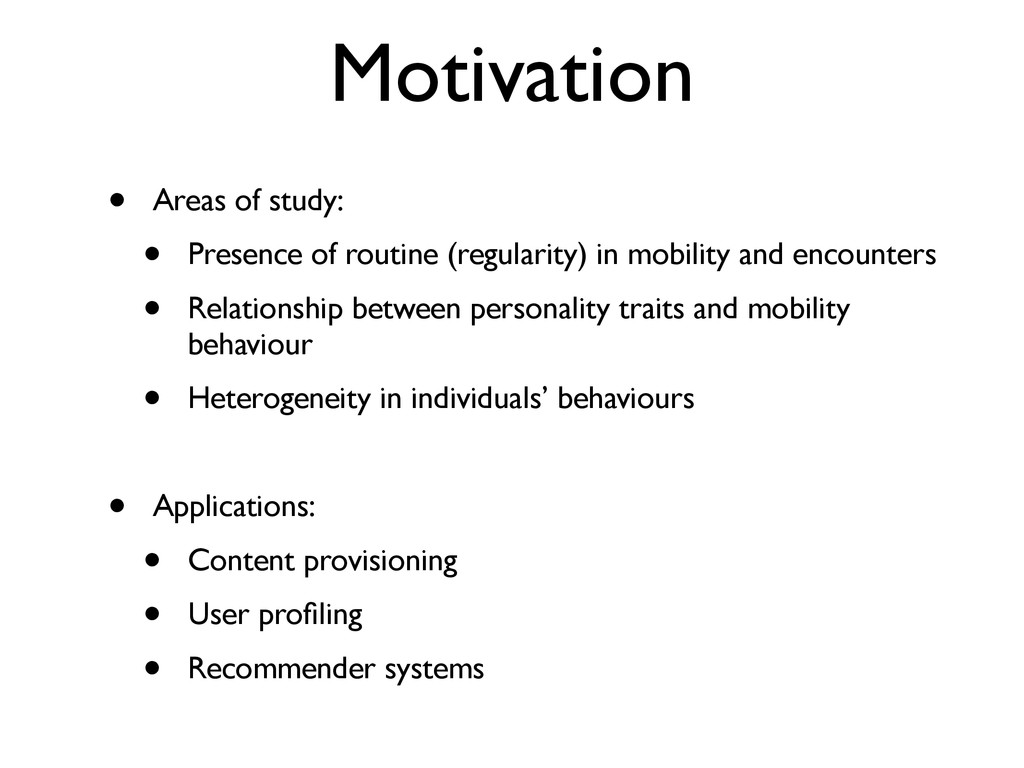
in mobility and encounters • Relationship between personality traits and mobility behaviour • Heterogeneity in individuals’ behaviours • Applications: • Content provisioning • User profiling • Recommender systems
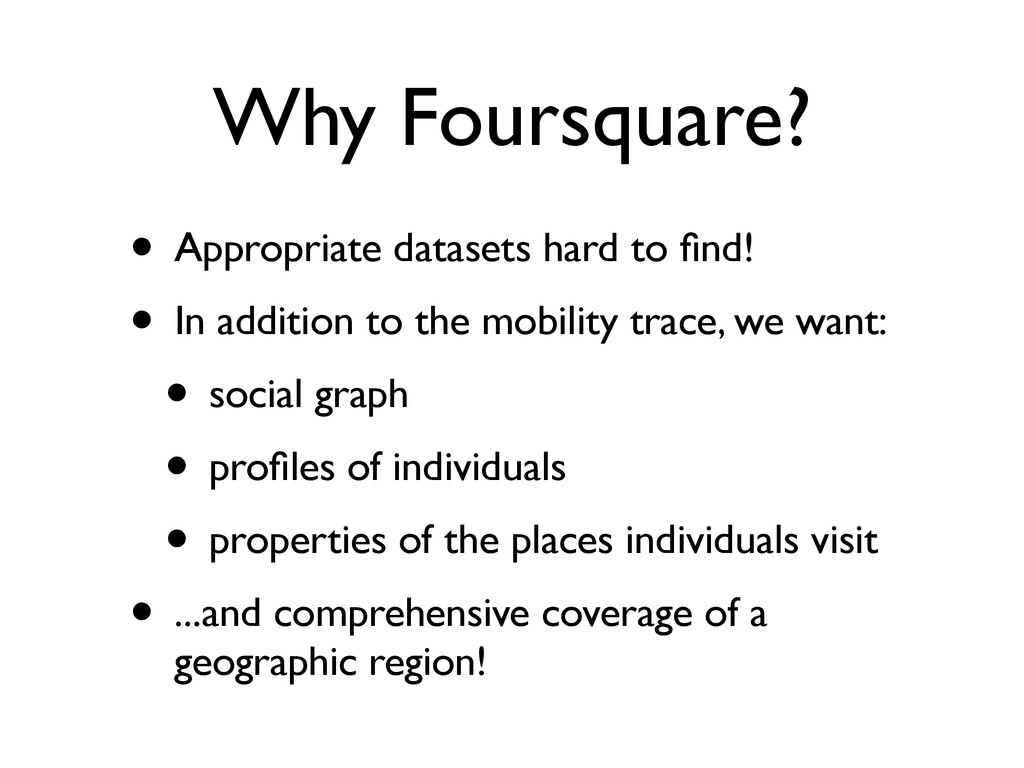
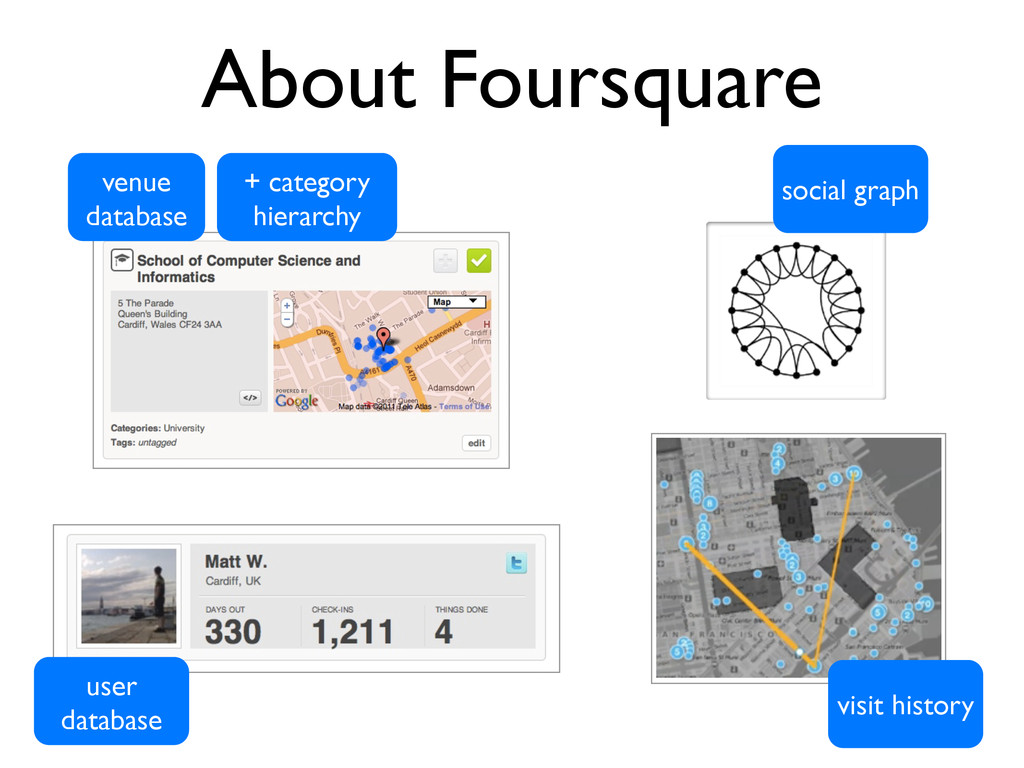
addition to the mobility trace, we want: • social graph • profiles of individuals • properties of the places individuals visit • ...and comprehensive coverage of a geographic region!
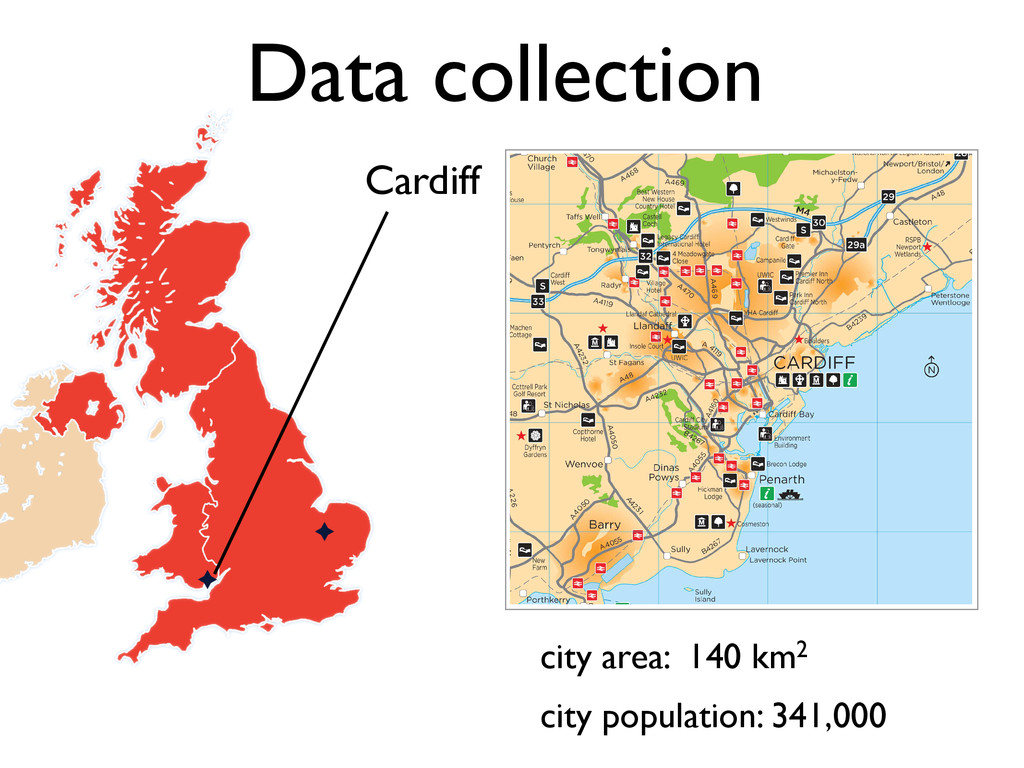
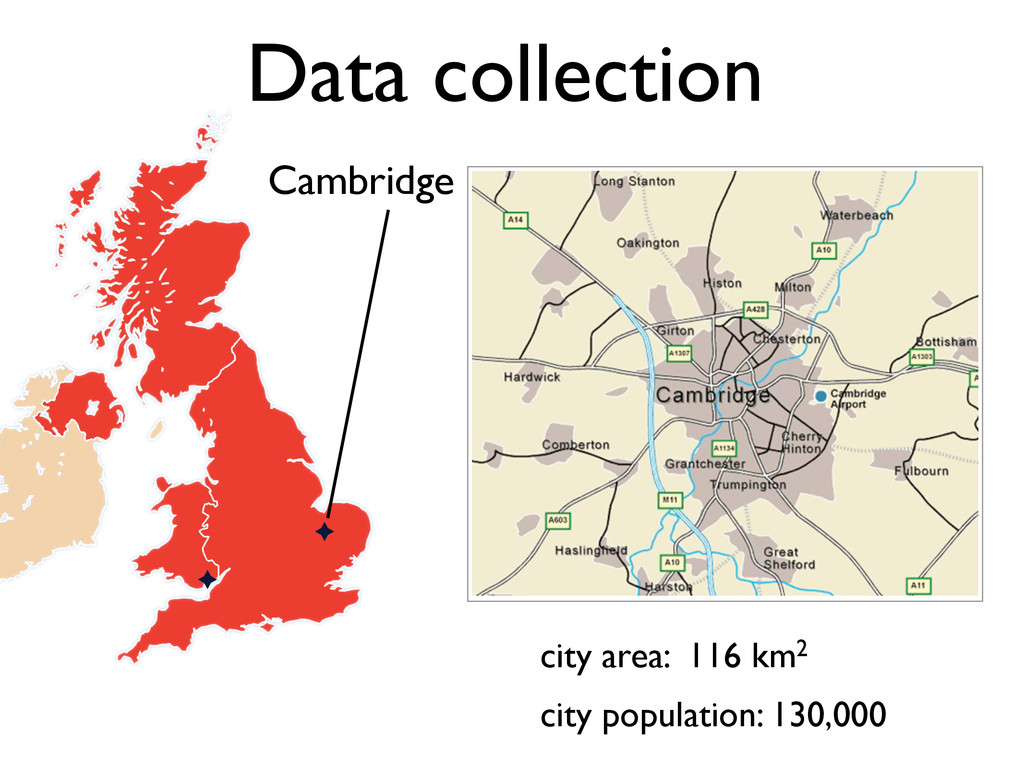
visit) # venues (≥ 1 visit) Checkins Checkins Checkins City pop. Collection area # users (≥ 1 visit) # venues (≥ 1 visit) Total per venue per user 320,000 7.0 x 9.0 km 1,701 1,234 13,299 10.78 7.82 120,000 5.0 x 3.5 km 1,196 852 6,464 7.59 5.40 Collection period: Mon 21st March – Fri 13th May 53 continuous days Cardiff Camb.
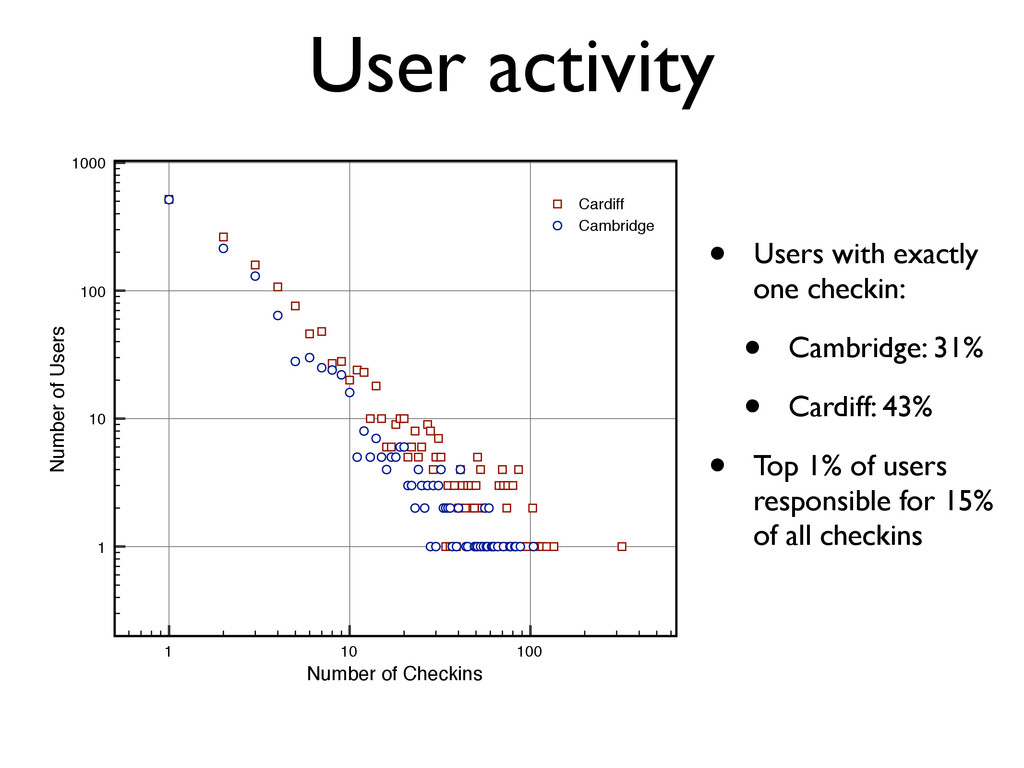
100 1000 Number of Users Cardiff Cambridge • Users with exactly one checkin: • Cambridge: 31% • Cardiff: 43% • Top 1% of users responsible for 15% of all checkins
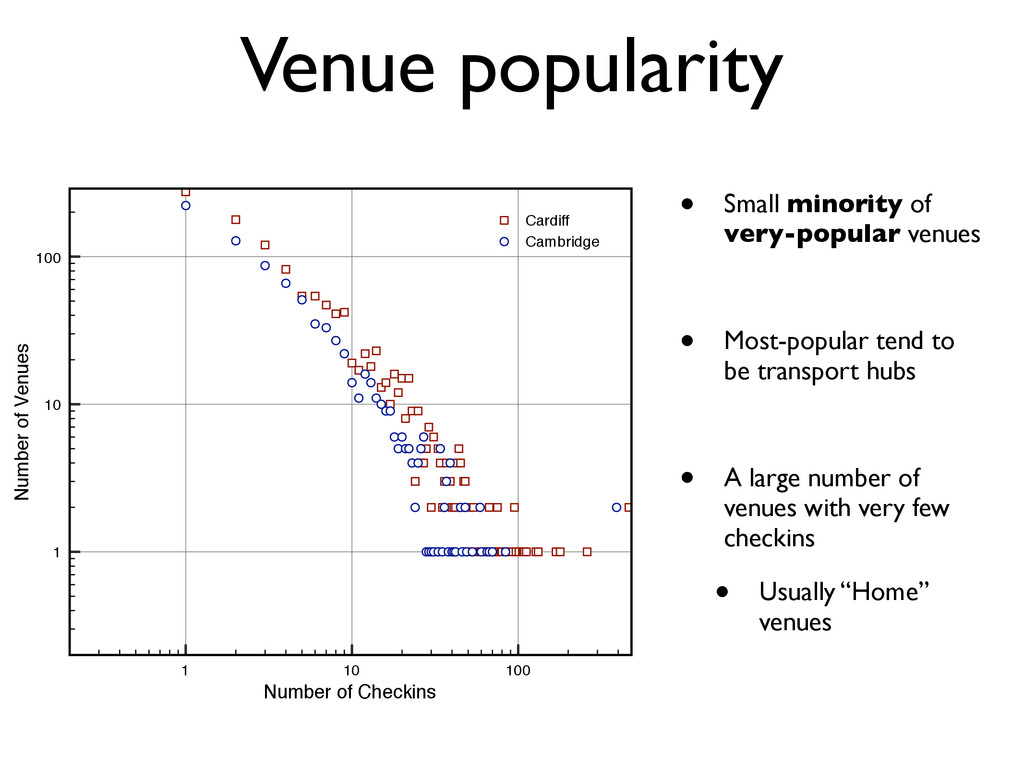
100 Number of Venues Cardiff Cambridge • Small minority of very-popular venues • Most-popular tend to be transport hubs • A large number of venues with very few checkins • Usually “Home” venues
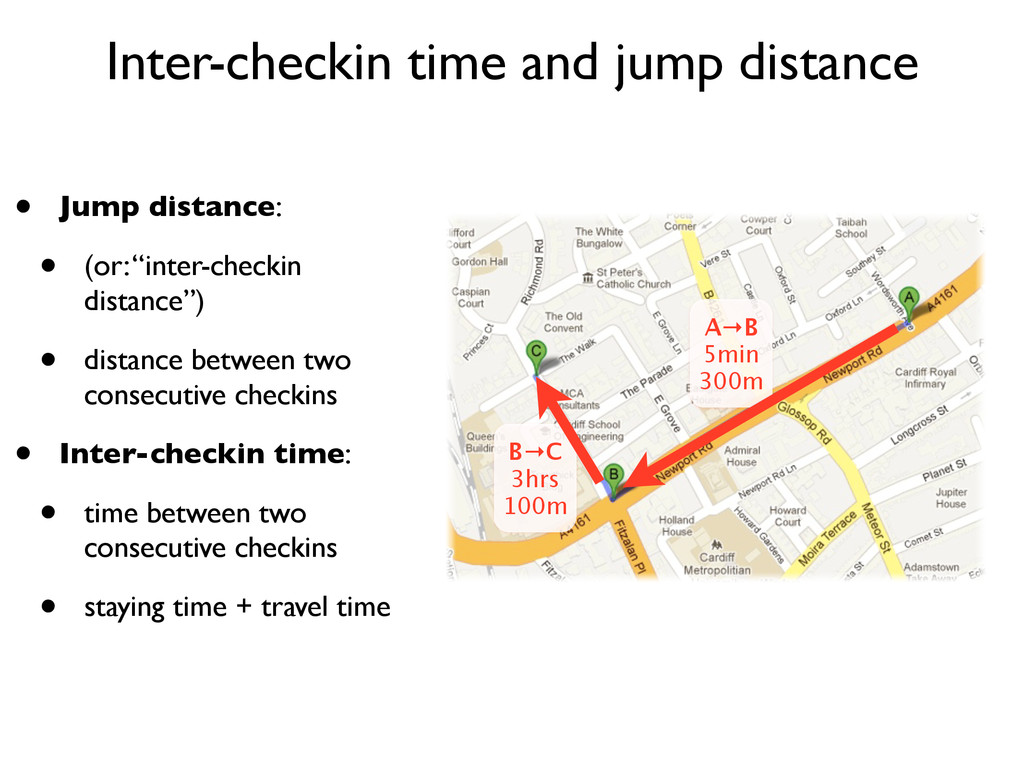
100m • Jump distance: • (or: “inter-checkin distance”) • distance between two consecutive checkins • Inter-checkin time: • time between two consecutive checkins • staying time + travel time
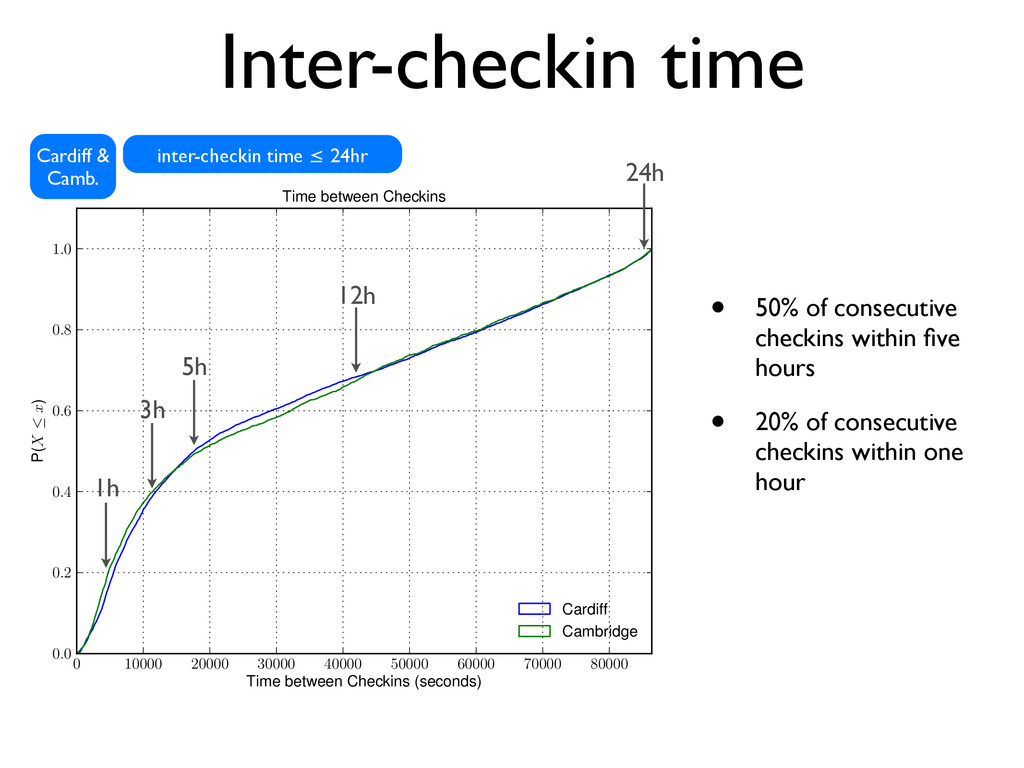
between Checkins (seconds) 0.0 0.2 0.4 0.6 0.8 1.0 P(X x) Time between Checkins Cardiff Cambridge Inter-checkin time • 50% of consecutive checkins within five hours • 20% of consecutive checkins within one hour Cardiff & Camb. 1h 3h 12h 24h 5h inter-checkin time ≤ 24hr
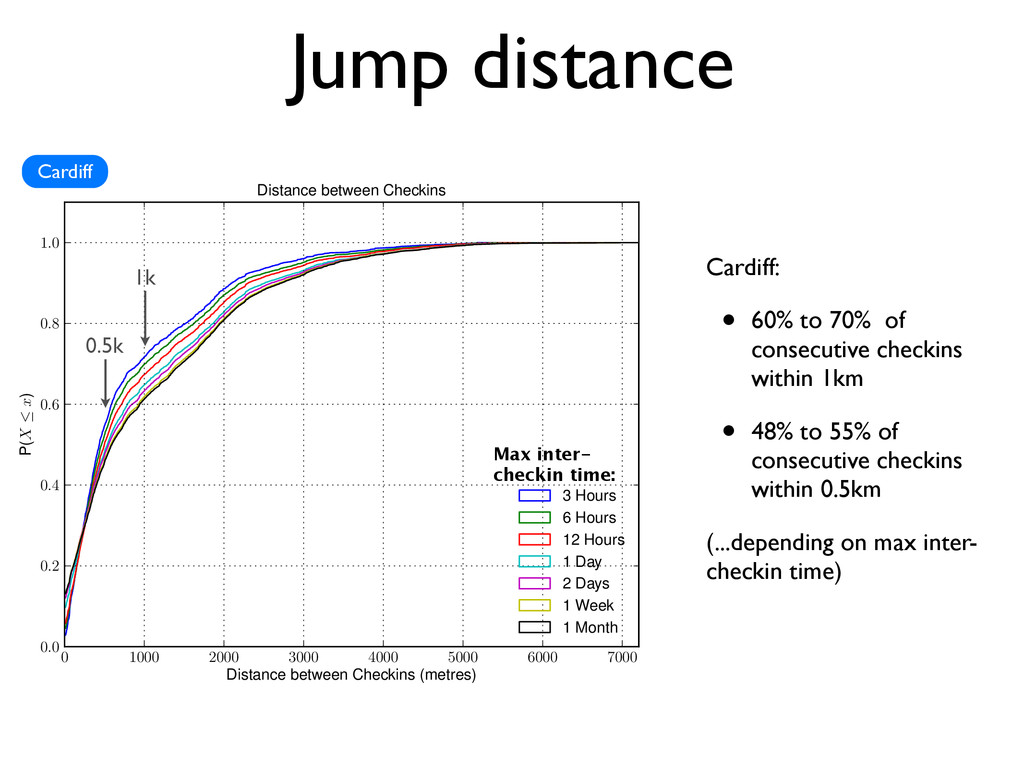
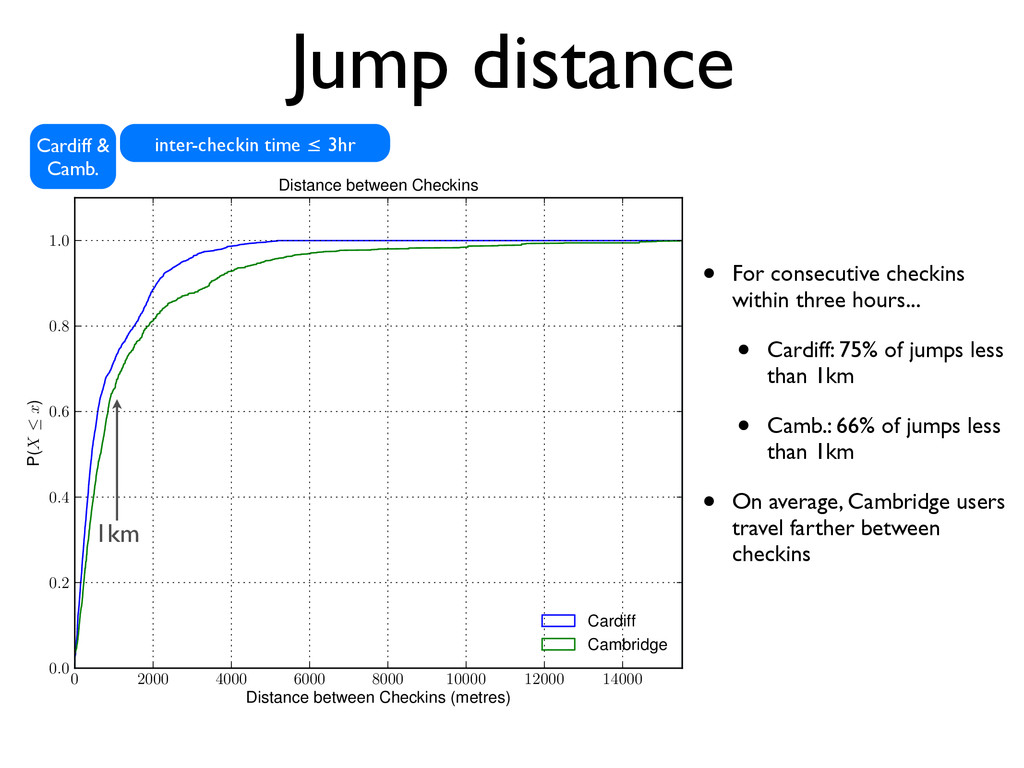
Checkins (metres) 0.0 0.2 0.4 0.6 0.8 1.0 P(X x) Distance between Checkins Cardiff Cambridge Jump distance • For consecutive checkins within three hours... • Cardiff: 75% of jumps less than 1km • Camb.: 66% of jumps less than 1km • On average, Cambridge users travel farther between checkins Cardiff & Camb. 1km inter-checkin time ≤ 3hr
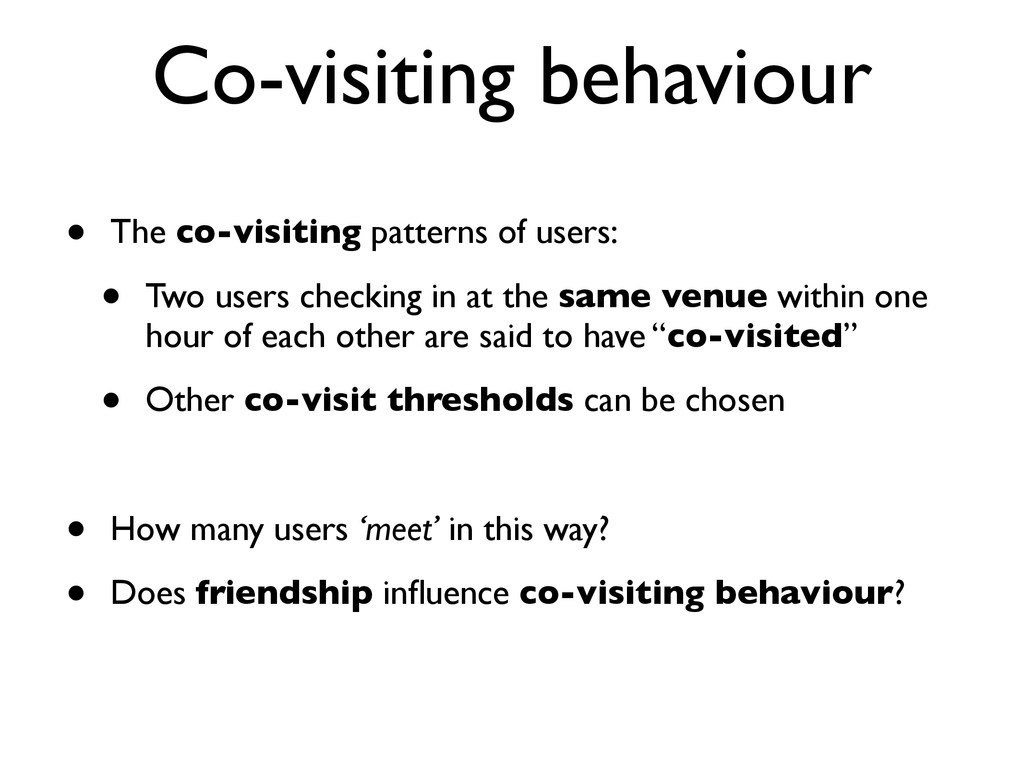
users checking in at the same venue within one hour of each other are said to have “co-visited” • Other co-visit thresholds can be chosen • How many users ‘meet’ in this way? • Does friendship influence co-visiting behaviour?
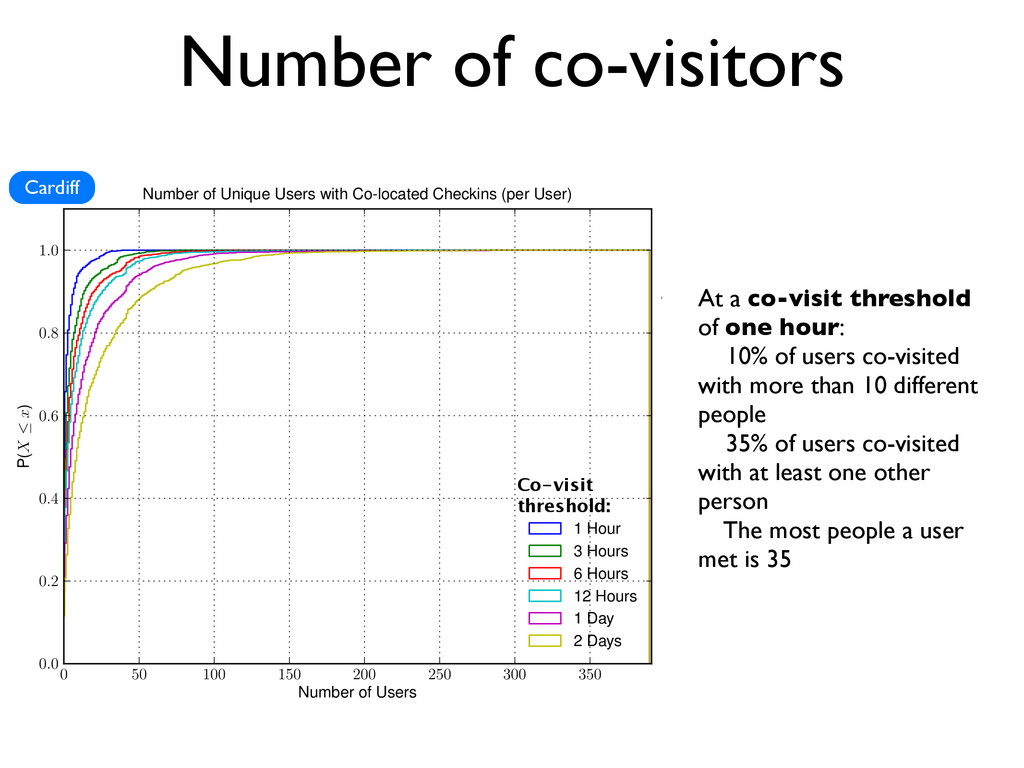
hour: 10% of users co-visited with more than 10 different people 35% of users co-visited with at least one other person The most people a user met is 35 0 50 100 150 200 250 300 350 Number of Users 0.0 0.2 0.4 0.6 0.8 1.0 P(X x) Number of Unique Users with Co-located Checkins (per User) 1 Hour 3 Hours 6 Hours 12 Hours 1 Day 2 Days Cardiff Co-visit threshold:
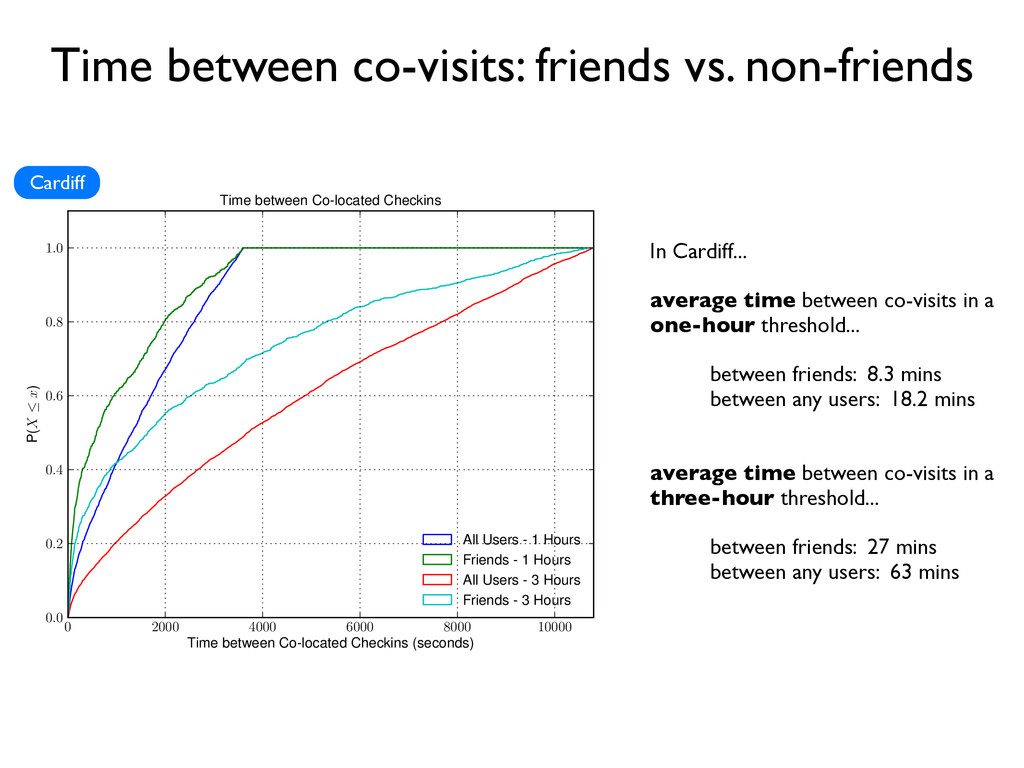
between co-visits in a one-hour threshold... between friends: 8.3 mins between any users: 18.2 mins average time between co-visits in a three-hour threshold... between friends: 27 mins between any users: 63 mins 0 2000 4000 6000 8000 10000 Time between Co-located Checkins (seconds) 0.0 0.2 0.4 0.6 0.8 1.0 P(X x) Time between Co-located Checkins All Users - 1 Hours Friends - 1 Hours All Users - 3 Hours Friends - 3 Hours Cardiff
• Look at n-grams frequencies... ... Central Train Station Starbucks School of ComSc Uni Cafe → → → → →... 8:30am 8:45am 9:00am 10:30am A-B-C-D-A-B-C-C-A-B-C example string: sequence count (#repeats) ABC 3 BCD 1 CDA 1 BCC 1 CCA 1 CAB 1 DAB 1 3-grams
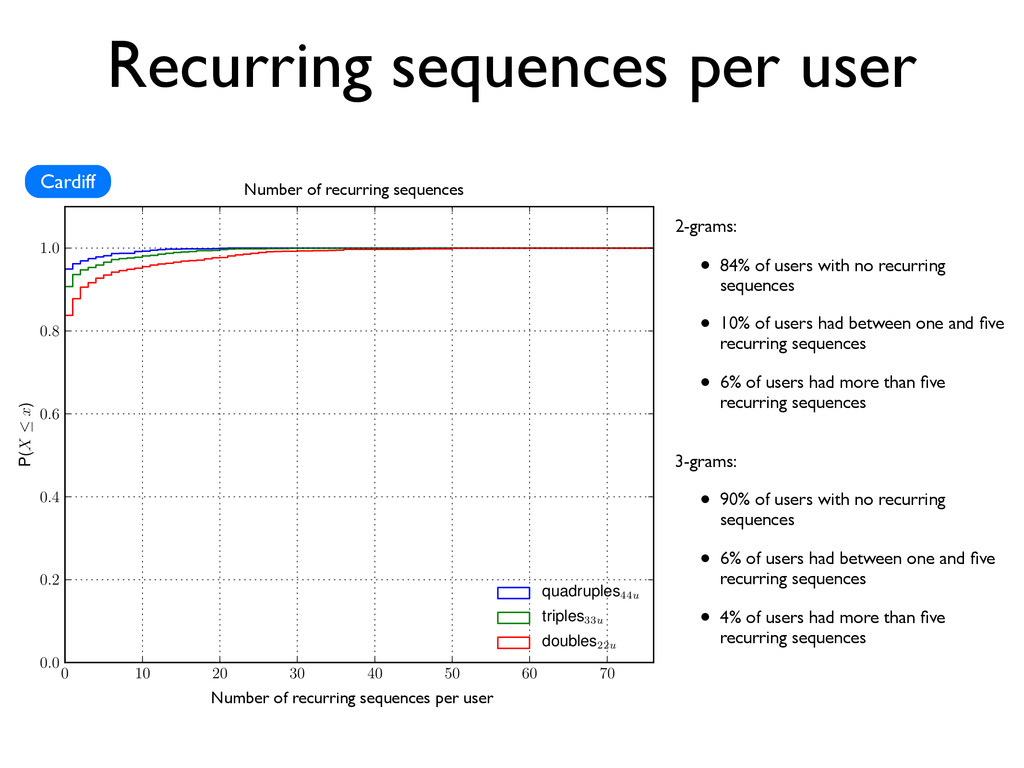
60 70 Number of unique tuples 0.0 0.2 0.4 0.6 0.8 1.0 P(X x) Distribution of unique tuples quadruples44u triples33u doubles22u Number of recurring sequences per user Number of recurring sequences Cardiff 2-grams: • 84% of users with no recurring sequences • 10% of users had between one and five recurring sequences • 6% of users had more than five recurring sequences 3-grams: • 90% of users with no recurring sequences • 6% of users had between one and five recurring sequences • 4% of users had more than five recurring sequences
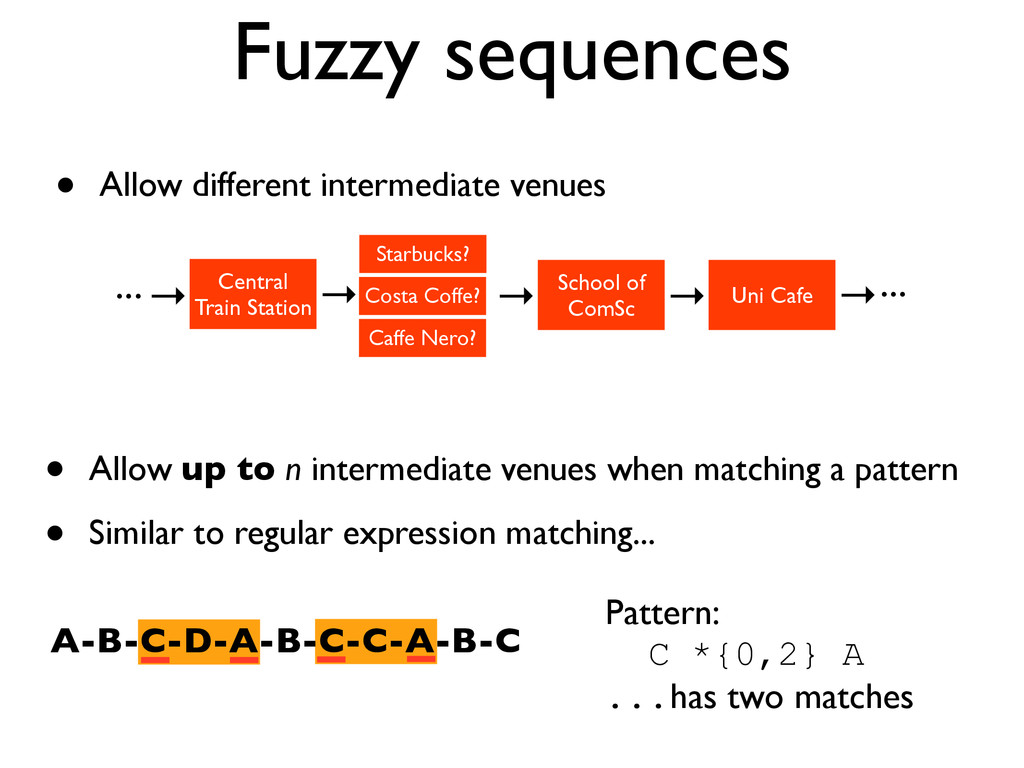
Station Starbucks? School of ComSc Uni Cafe → → → → →... Costa Coffe? Caffe Nero? • Allow up to n intermediate venues when matching a pattern • Similar to regular expression matching... Pattern: C *{0,2} A ...has two matches A-B-C-D-A-B-C-C-A-B-C
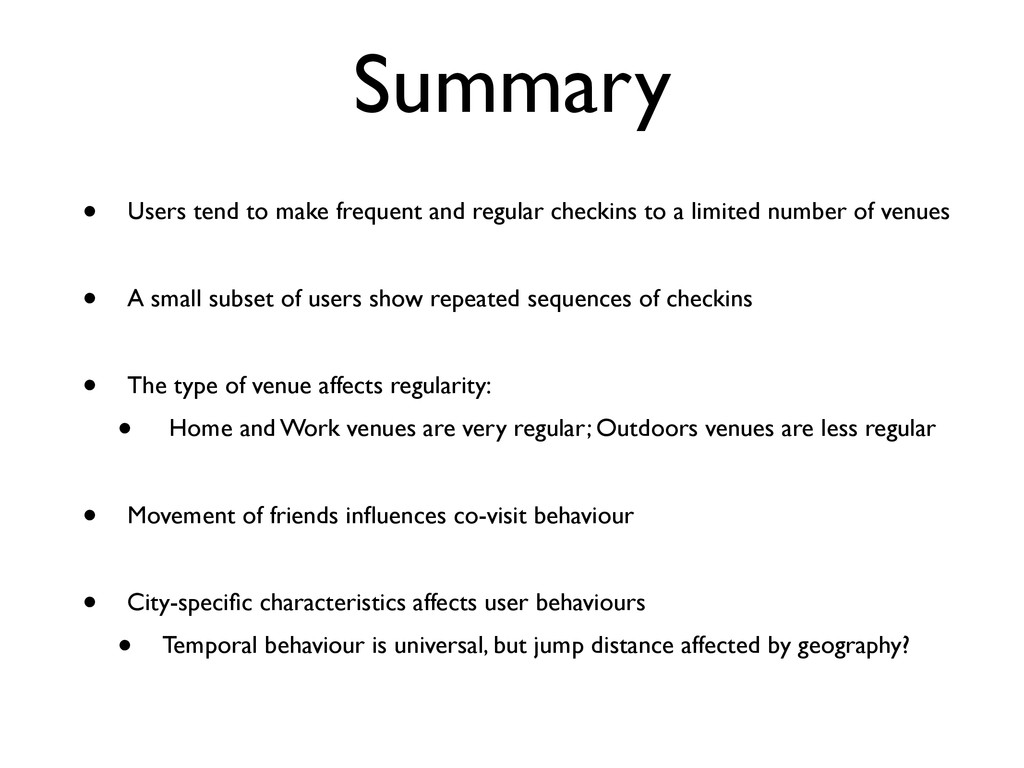
to a limited number of venues • A small subset of users show repeated sequences of checkins • The type of venue affects regularity: • Home and Work venues are very regular; Outdoors venues are less regular • Movement of friends influences co-visit behaviour • City-specific characteristics affects user behaviours • Temporal behaviour is universal, but jump distance affected by geography?
heterogeneity • Influence of friendship on co-visiting behaviour -- causality or commonality? • Relationship between personality traits and visiting behaviour
![Thanks for listening! Questions? Matt Williams www.mattjw.net [email protected] @voxmjw www.gplus.to/mattjw](https://files.speakerdeck.com/presentations/8a05059526164e37aaf82537ce86ed75/slide_31.jpg)