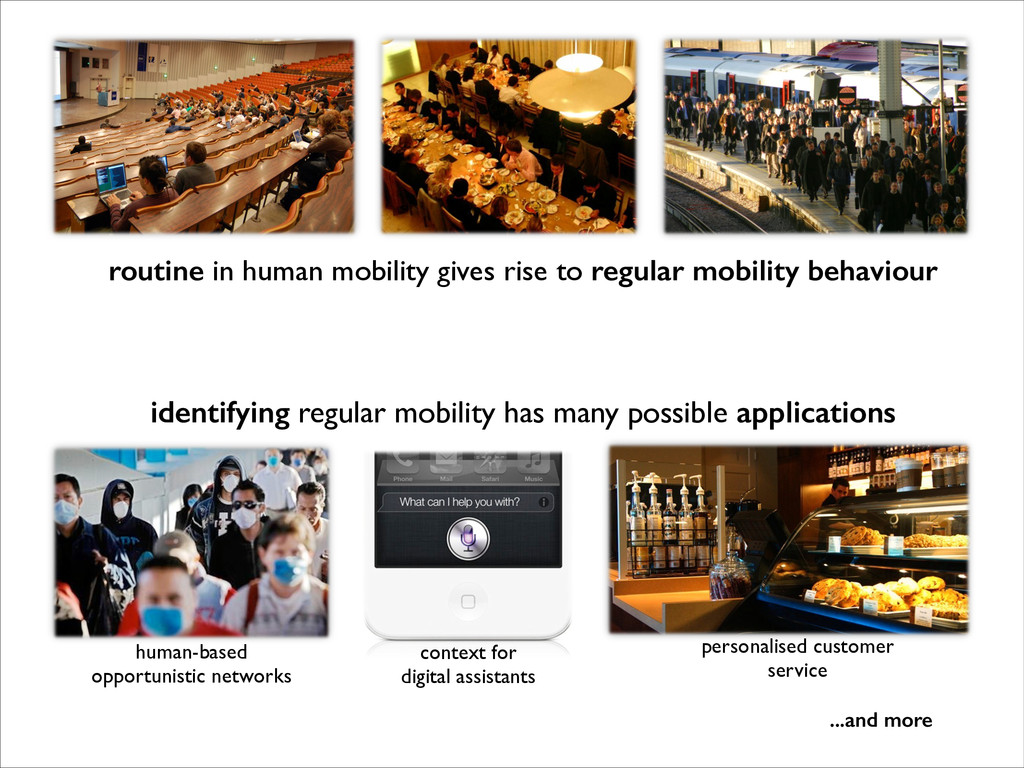
identifying regular mobility has many possible applications personalised customer service human-based opportunistic networks context for digital assistants ...and more
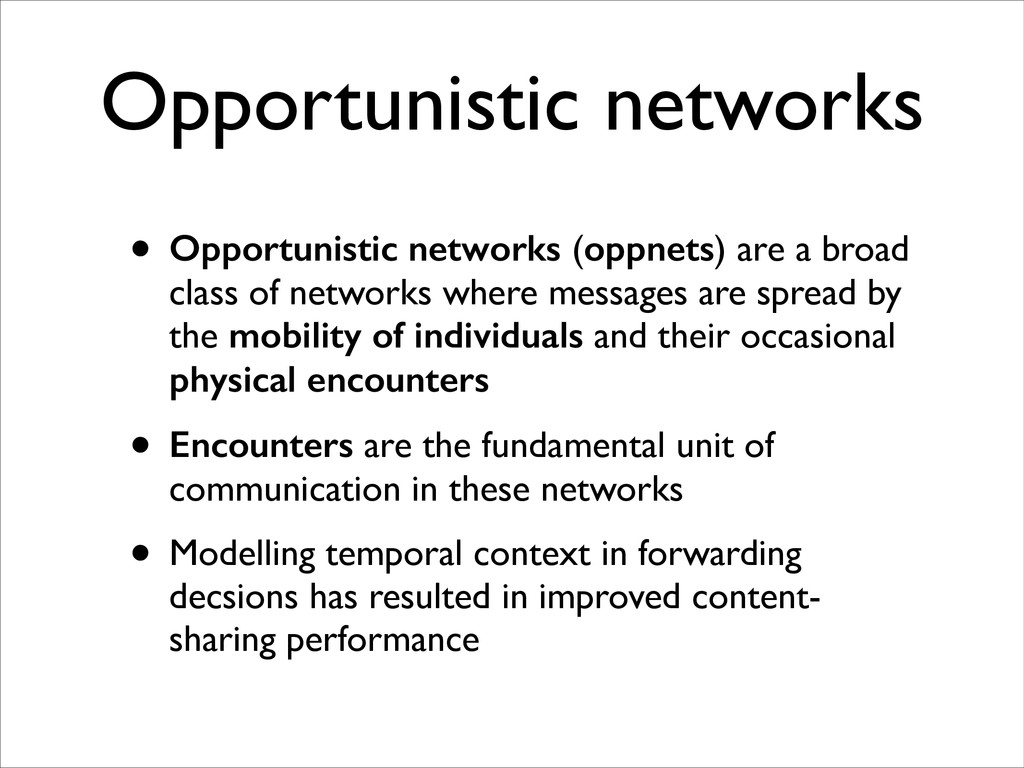
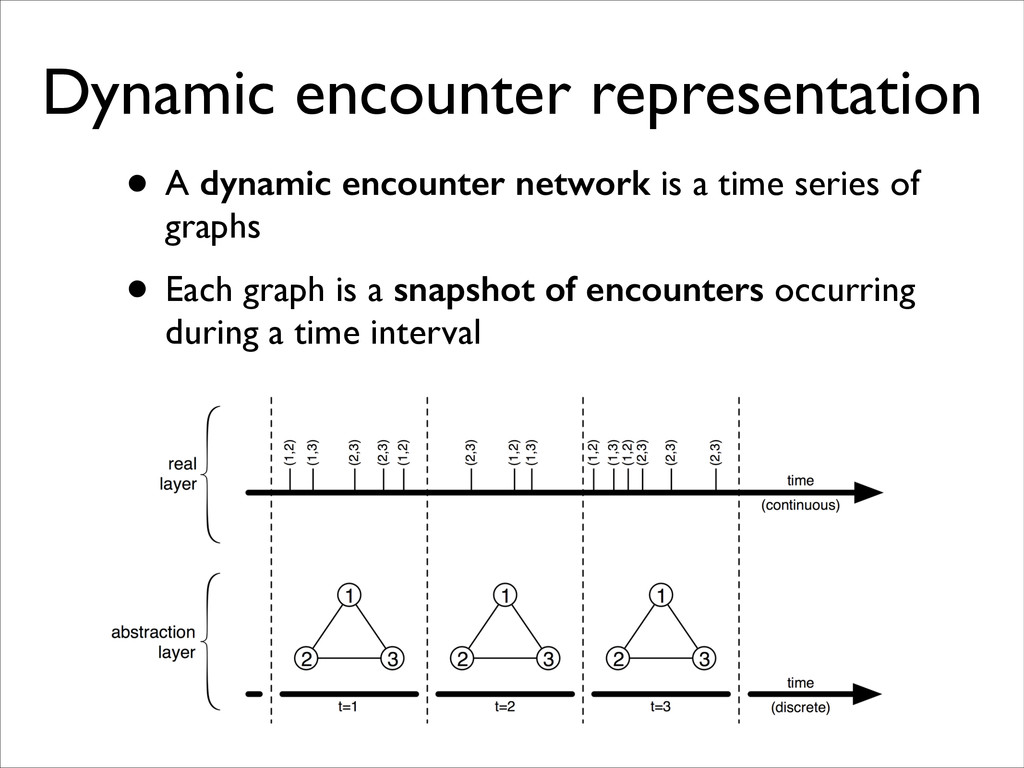
of networks where messages are spread by the mobility of individuals and their occasional physical encounters • Encounters are the fundamental unit of communication in these networks • Modelling temporal context in forwarding decsions has resulted in improved content- sharing performance
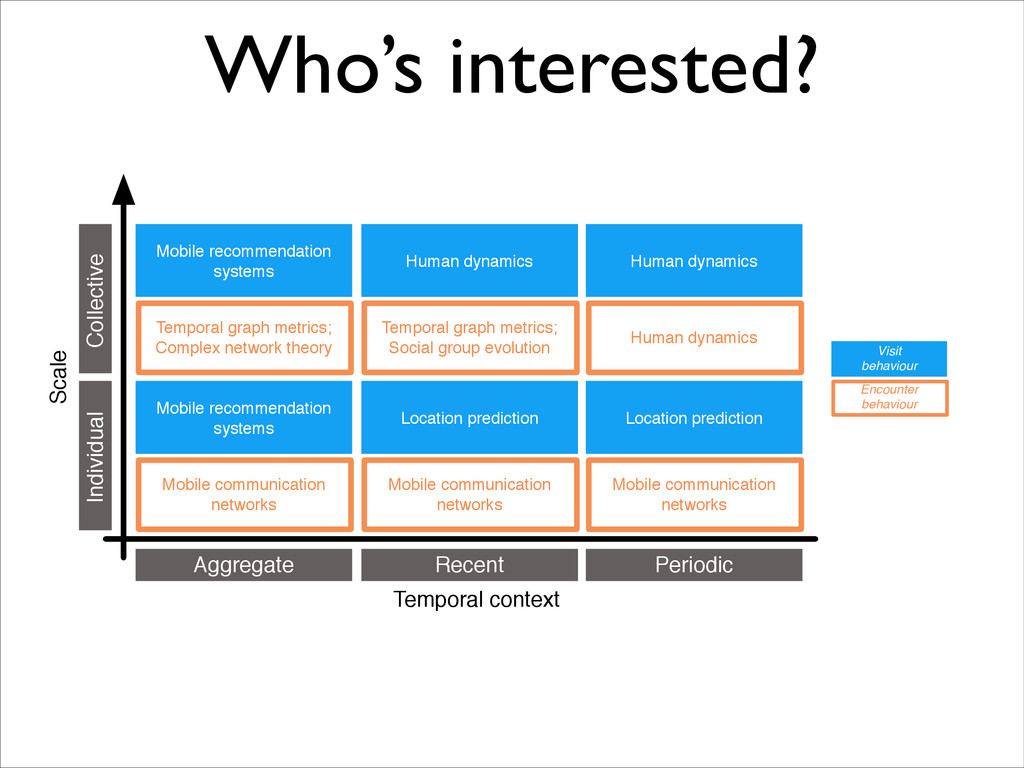
Location prediction Mobile recommendation systems Human dynamics Human dynamics Temporal graph metrics; Complex network theory Temporal graph metrics; Social group evolution Human dynamics Mobile communication networks Mobile communication networks Mobile communication networks Visit behaviour Encounter behaviour Temporal context Scale Who’s interested?
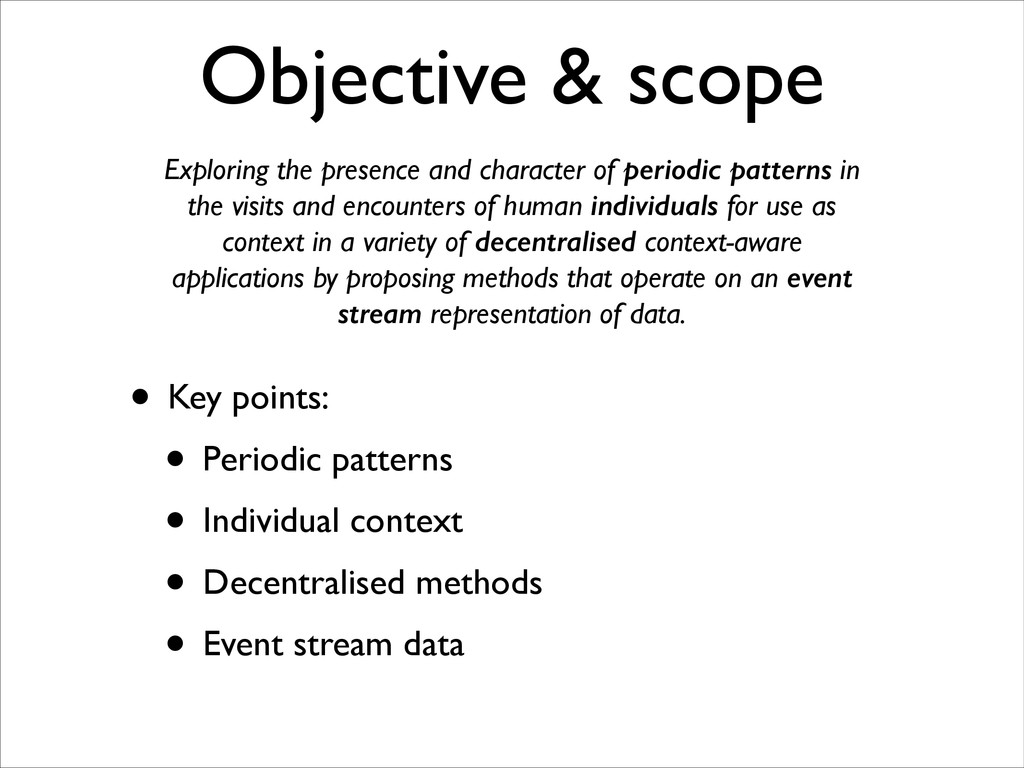
Individual context • Decentralised methods • Event stream data Exploring the presence and character of periodic patterns in the visits and encounters of human individuals for use as context in a variety of decentralised context-aware applications by proposing methods that operate on an event stream representation of data.
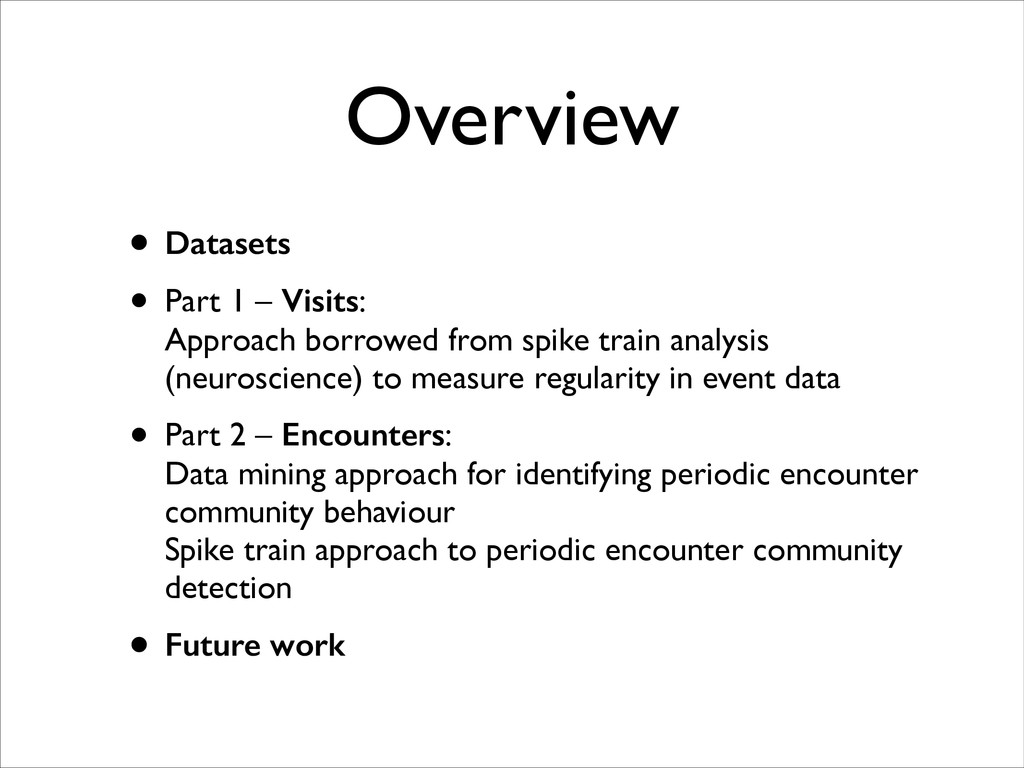
borrowed from spike train analysis (neuroscience) to measure regularity in event data • Part 2 – Encounters: Data mining approach for identifying periodic encounter community behaviour Spike train approach to periodic encounter community detection • Future work
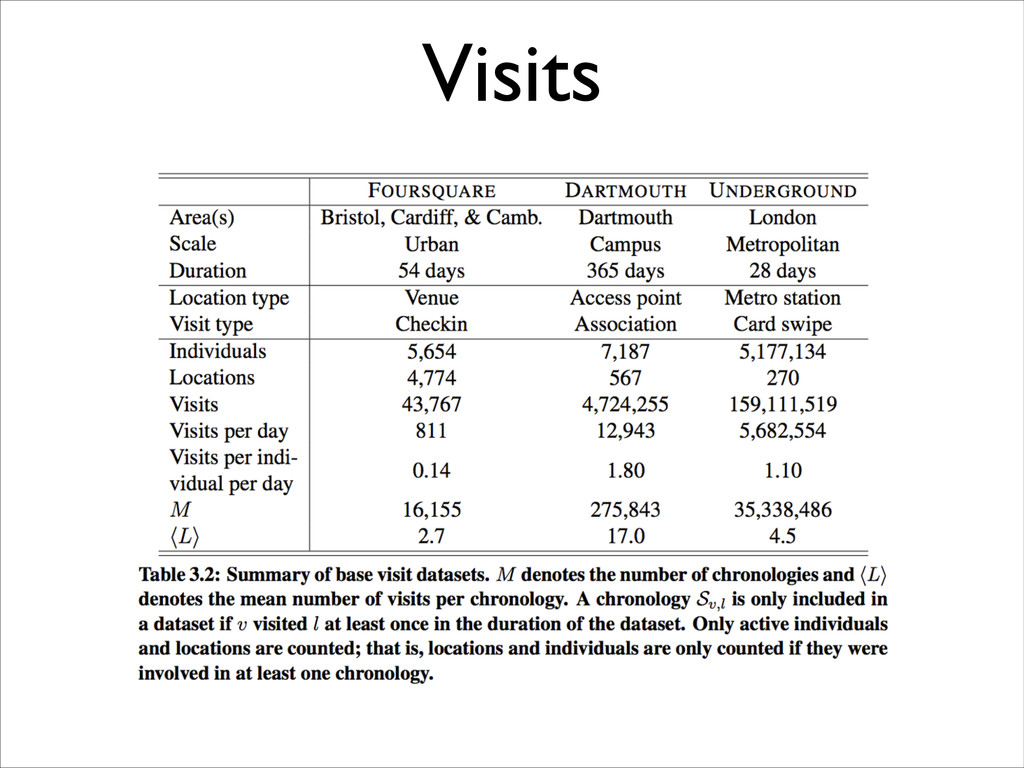
by the Oyster card automated fare collection system • Locations: London Underground stations • Users: passengers using the Oyster card system • Includes ~80 million journeys made during 28 days
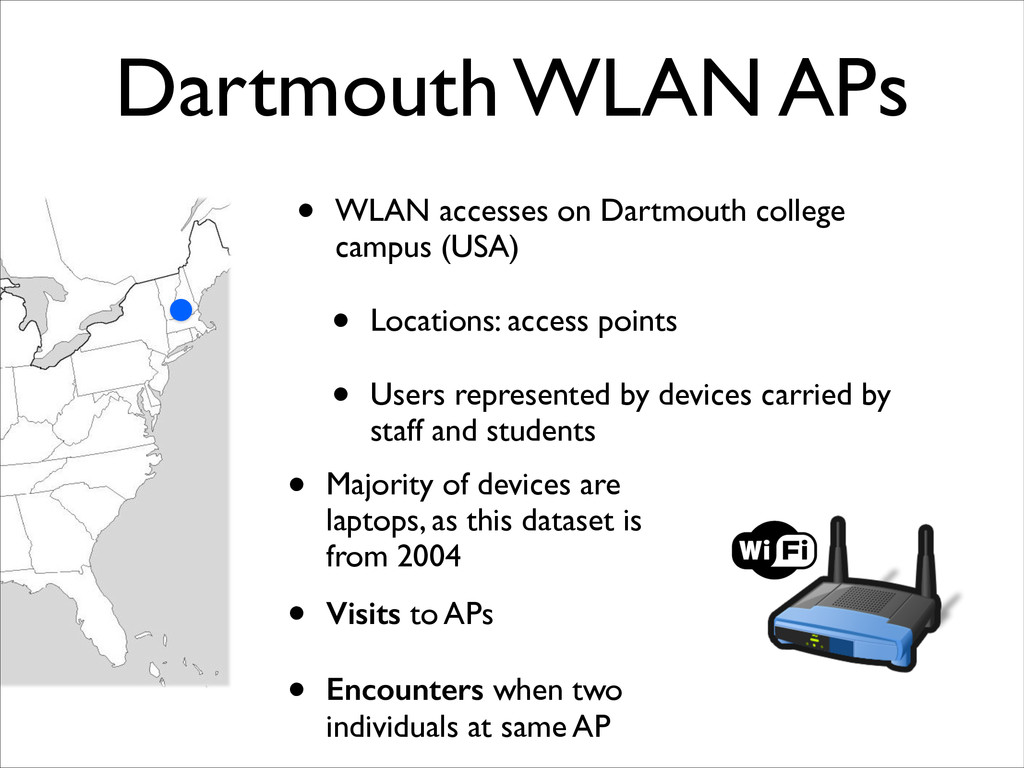
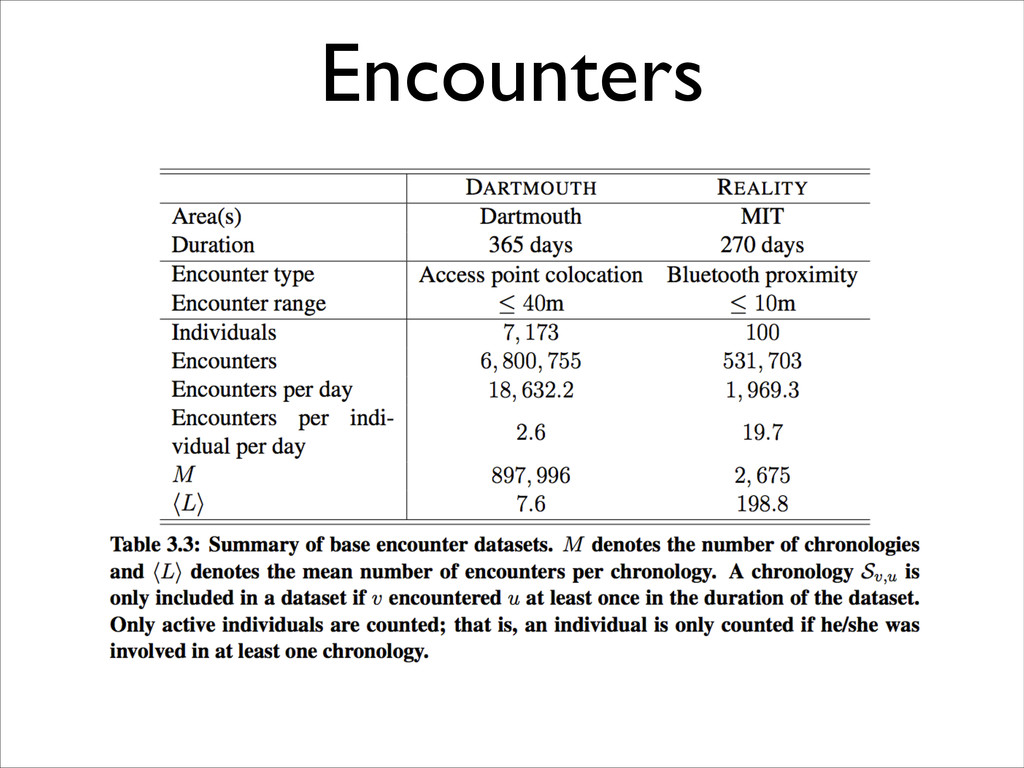
(USA) • Locations: access points • Users represented by devices carried by staff and students • Majority of devices are laptops, as this dataset is from 2004 • Visits to APs • Encounters when two individuals at same AP
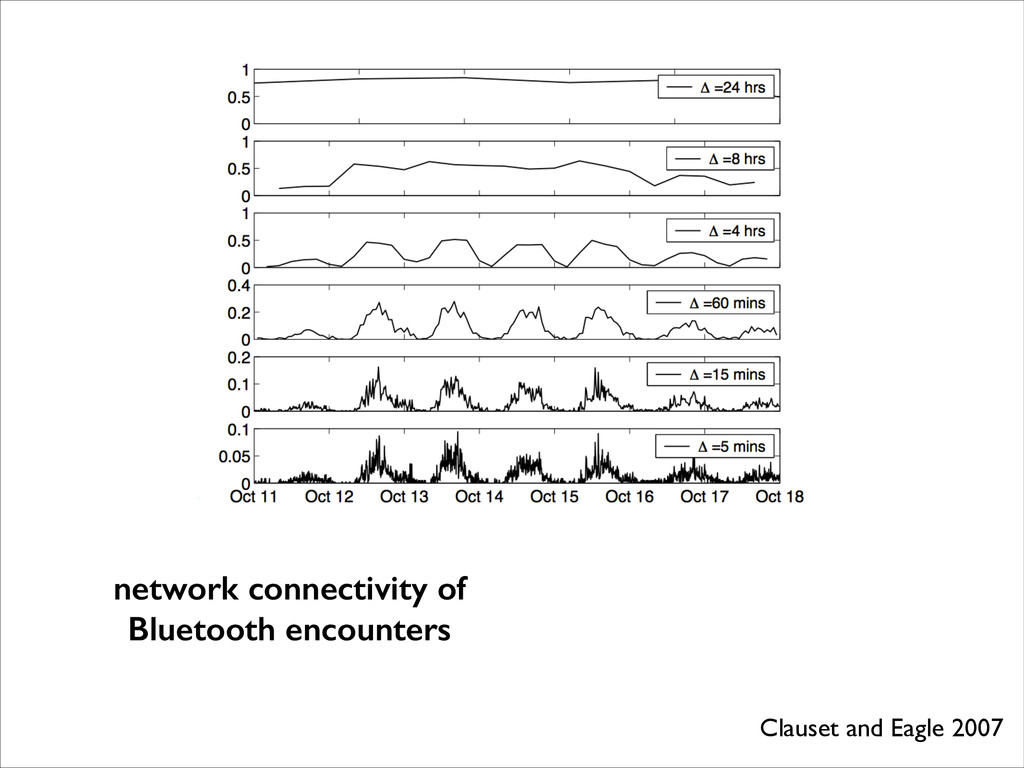
with Bluetooth encounter logging software (they were aware!) • Tracked for 9 months during 2004 and 2005 • Logged ~7 million encounters among the 100 students
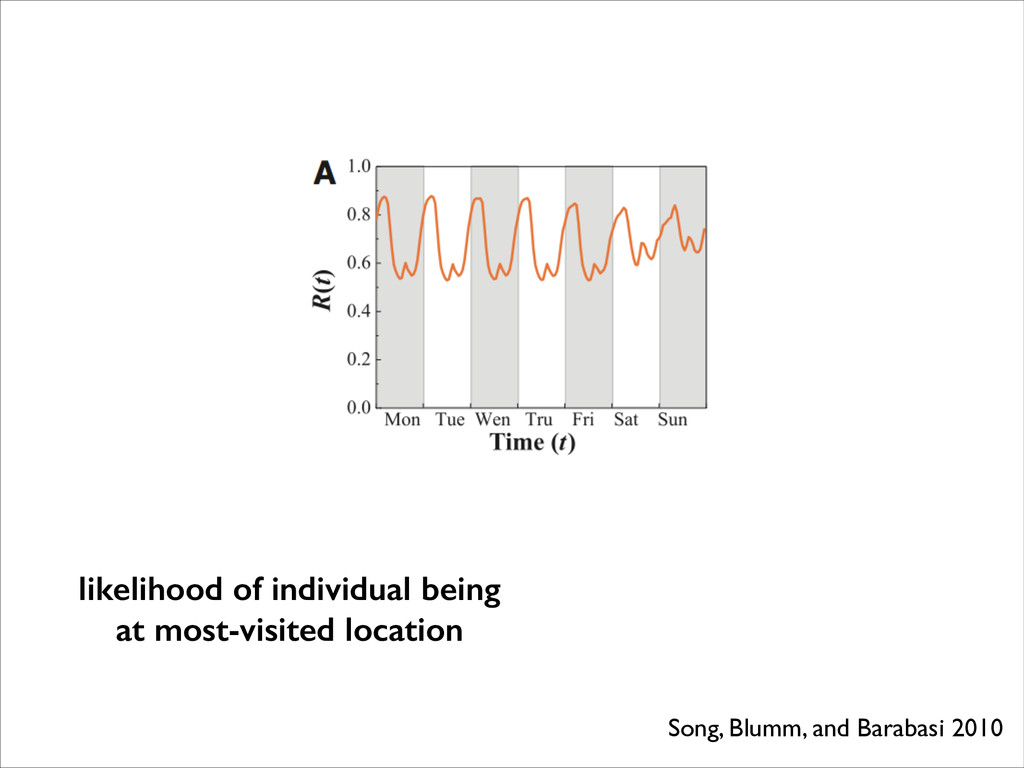
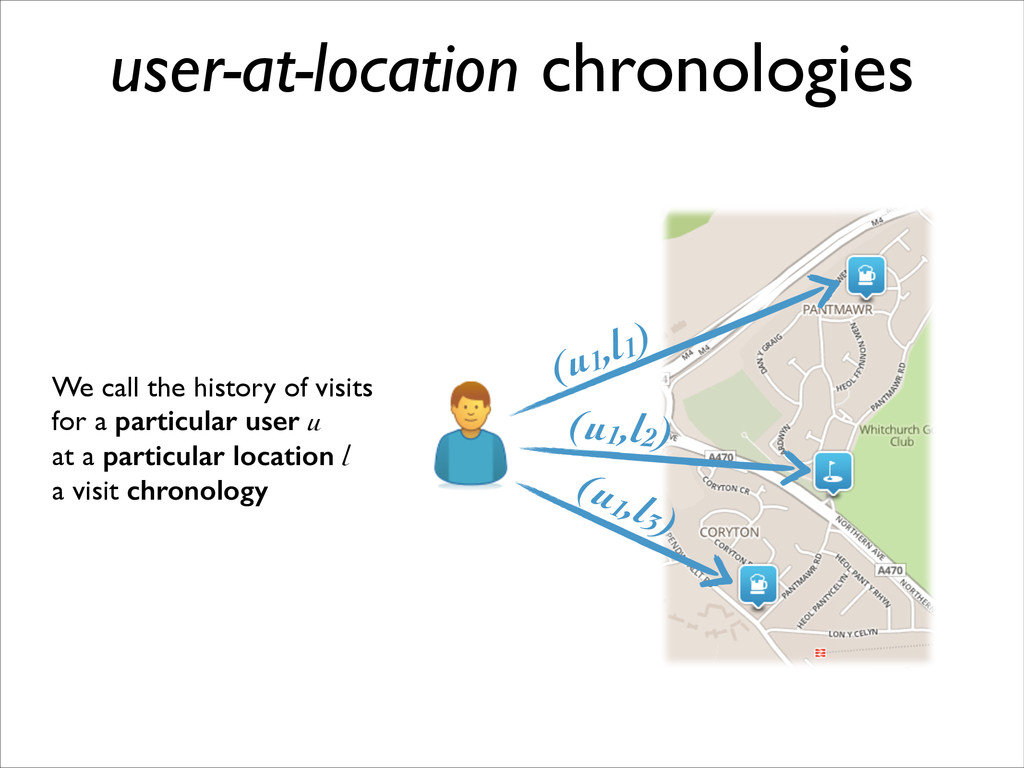
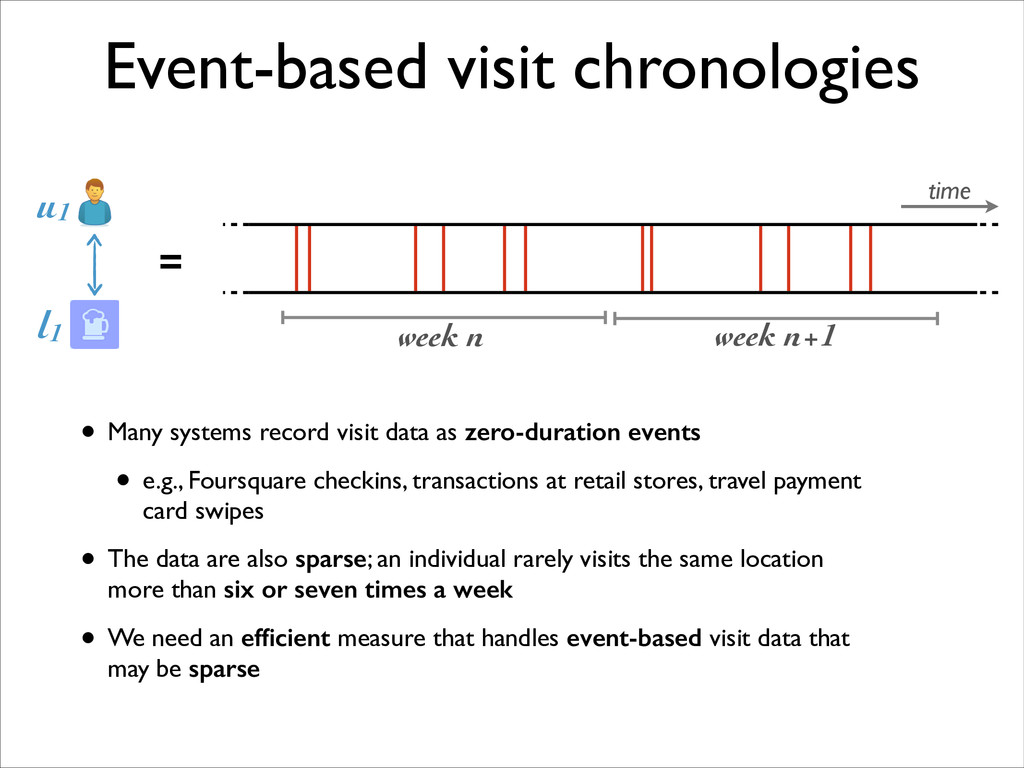
zero-duration events • e.g., Foursquare checkins, transactions at retail stores, travel payment card swipes • The data are also sparse; an individual rarely visits the same location more than six or seven times a week • We need an efficient measure that handles event-based visit data that may be sparse week n week n+1 = time u1 l1
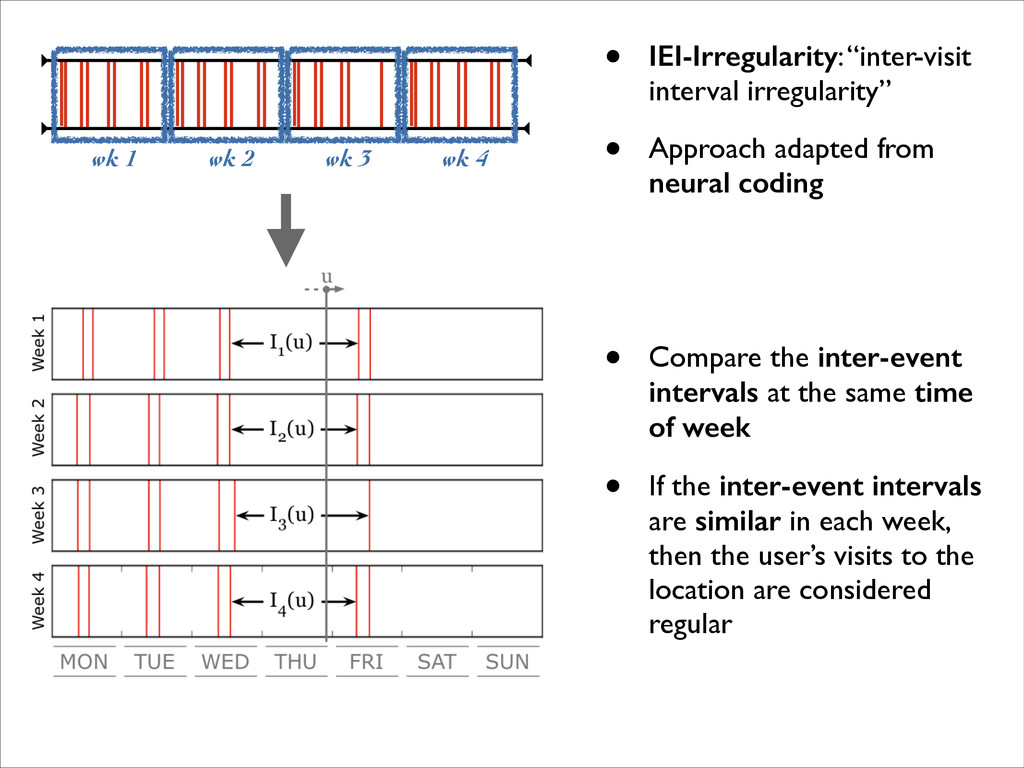
“inter-visit interval irregularity” • Approach adapted from neural coding ! ! • Compare the inter-event intervals at the same time of week • If the inter-event intervals are similar in each week, then the user’s visits to the location are considered regular
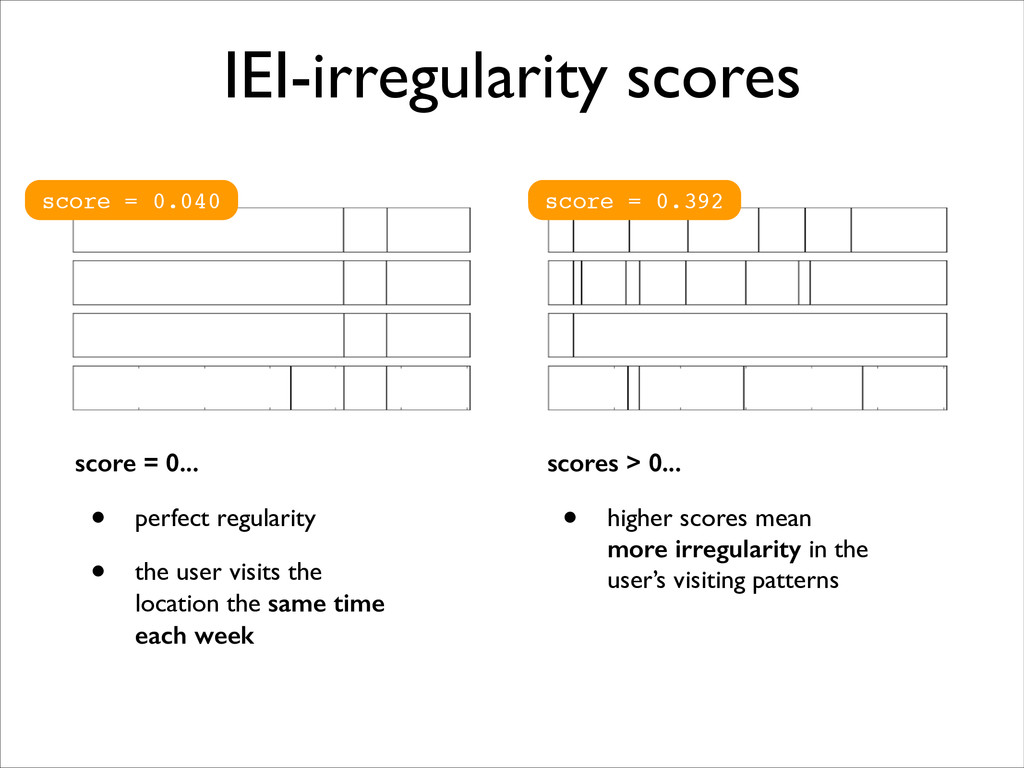
0... • perfect regularity • the user visits the location the same time each week scores > 0... • higher scores mean more irregularity in the user’s visiting patterns
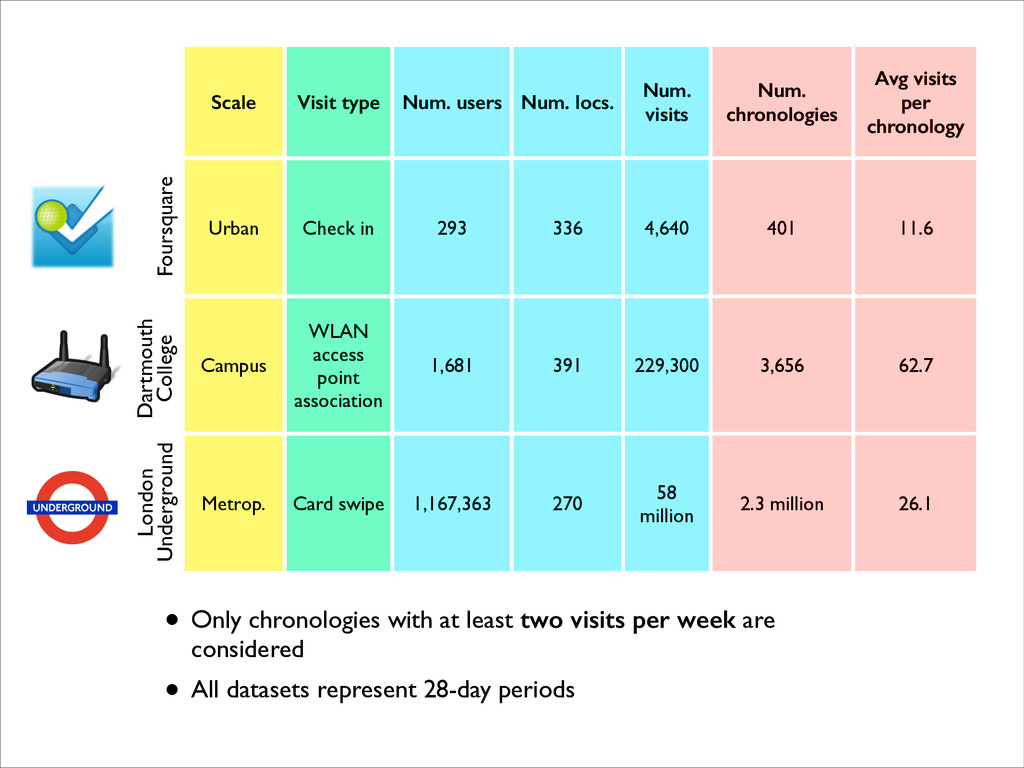
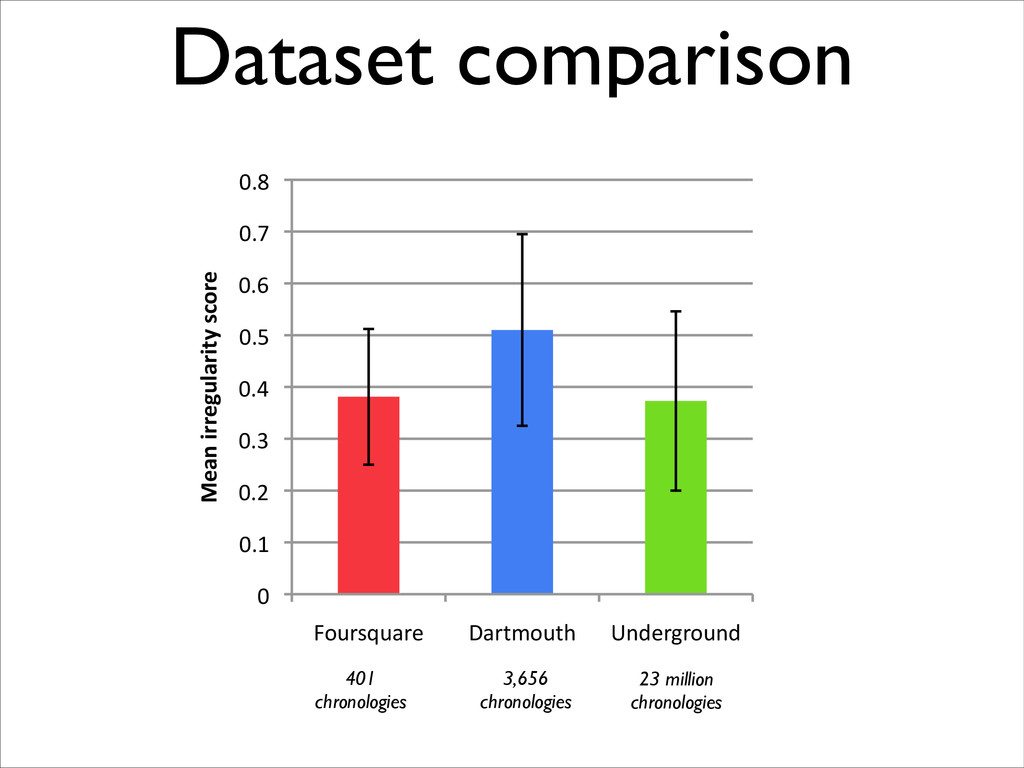
chronologies Avg visits per chronology Urban Check in 293 336 4,640 401 11.6 Campus WLAN access point association 1,681 391 229,300 3,656 62.7 Metrop. Card swipe 1,167,363 270 58 million 2.3 million 26.1 Foursquare London Underground • Only chronologies with at least two visits per week are considered • All datasets represent 28-day periods Dartmouth College
you have a regular pattern with it? • Self-reported surveys show that Underground passengers do not associate regular with frequent – what do the data say? London Underground
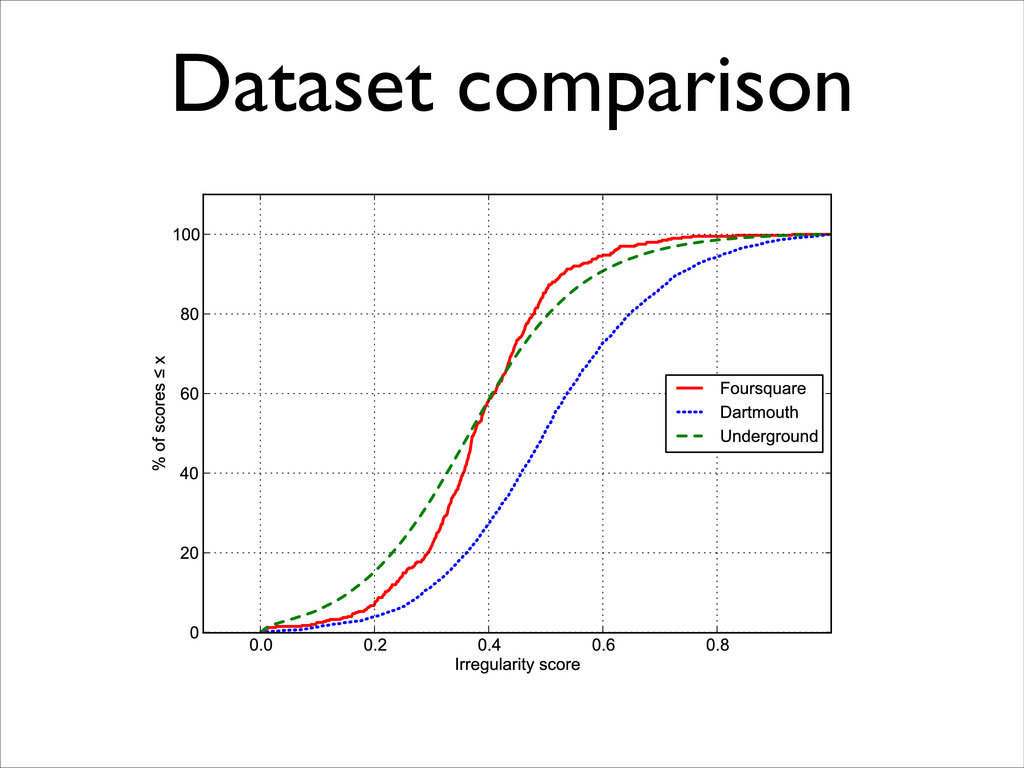
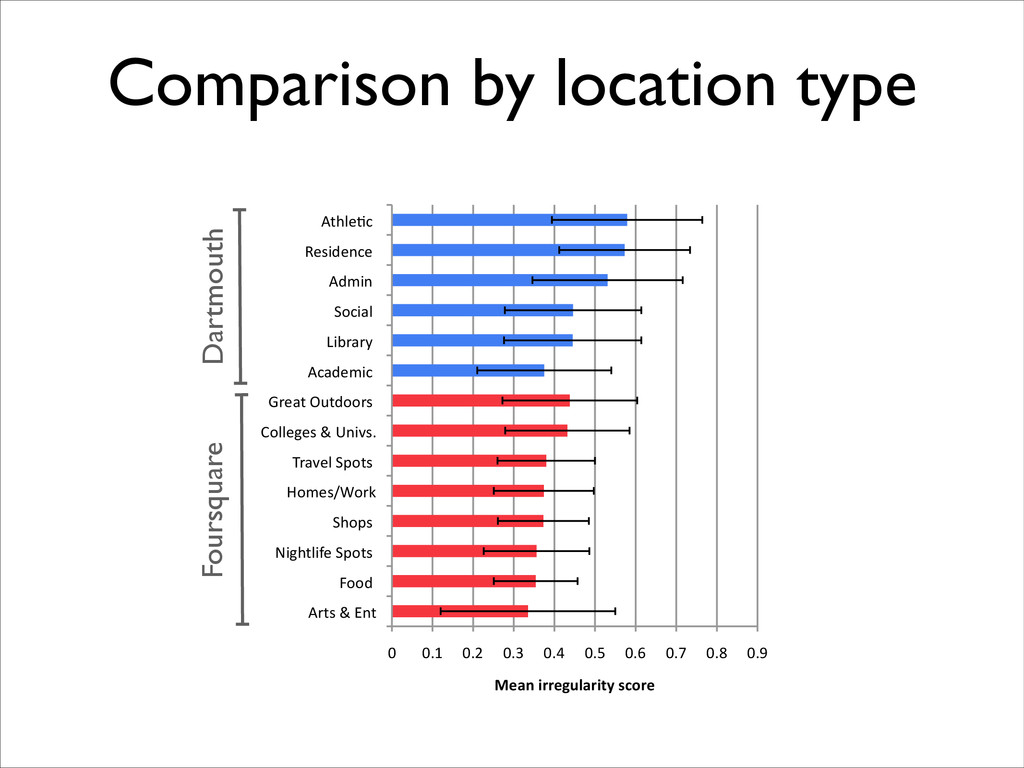
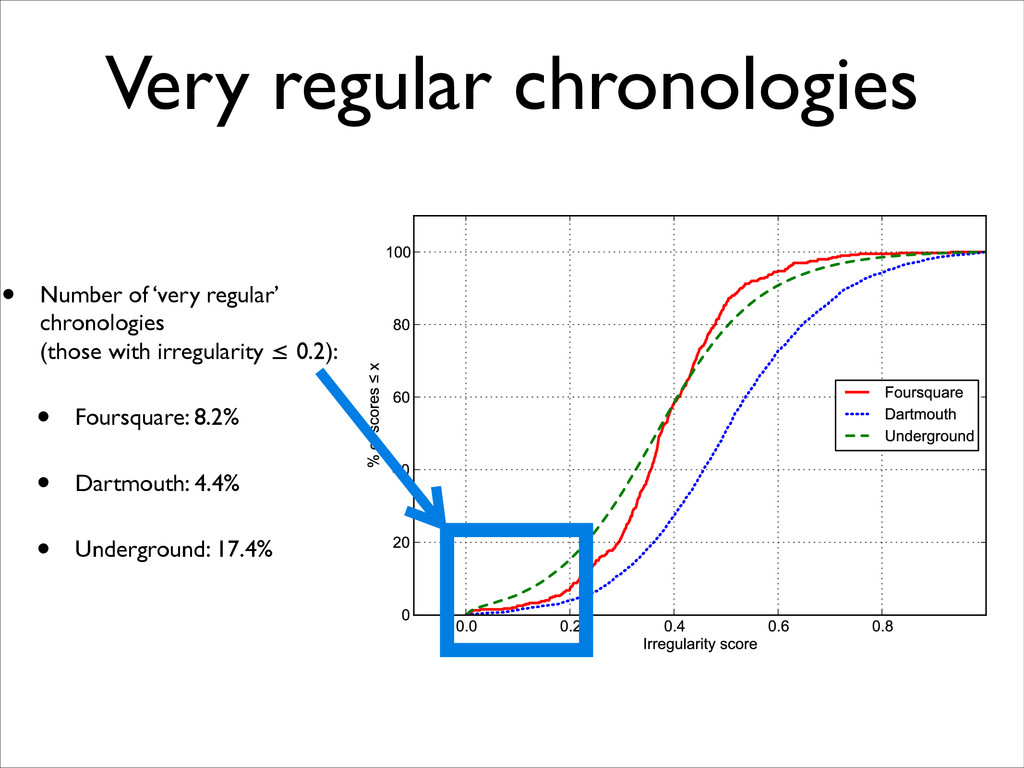
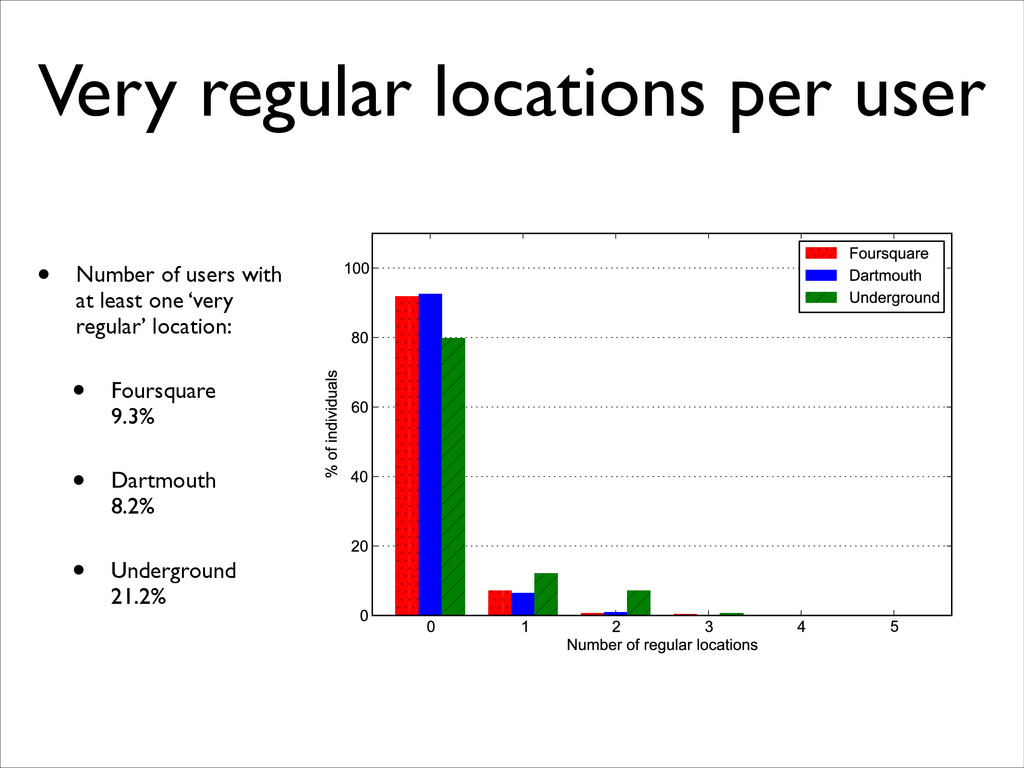
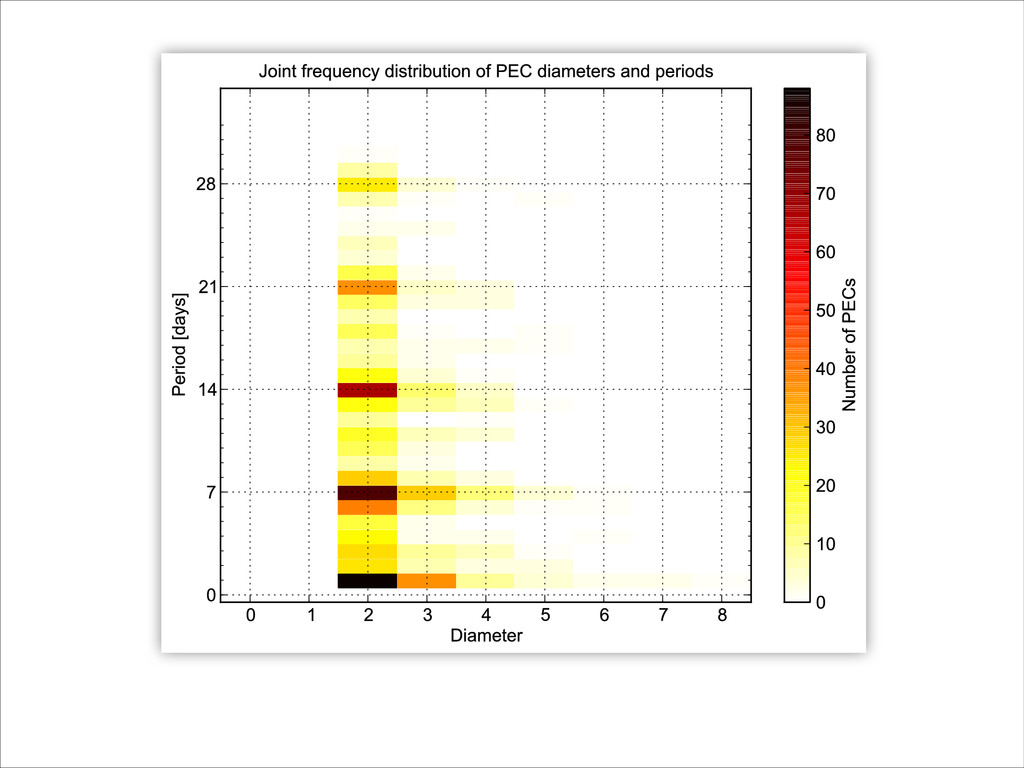
week-on-week irregularity in event-based visit data • Small core of users (8% to 21%) in each dataset with at least one regular location • Core largest for an urban transit system • Frequency and regularity have no linear correlation ! • University campus access point visiting patterns least regular • Flexible and spontaneous student behaviour, and finer-grained movements • Urban transit system most regular • Significant commuter population following rigid routines
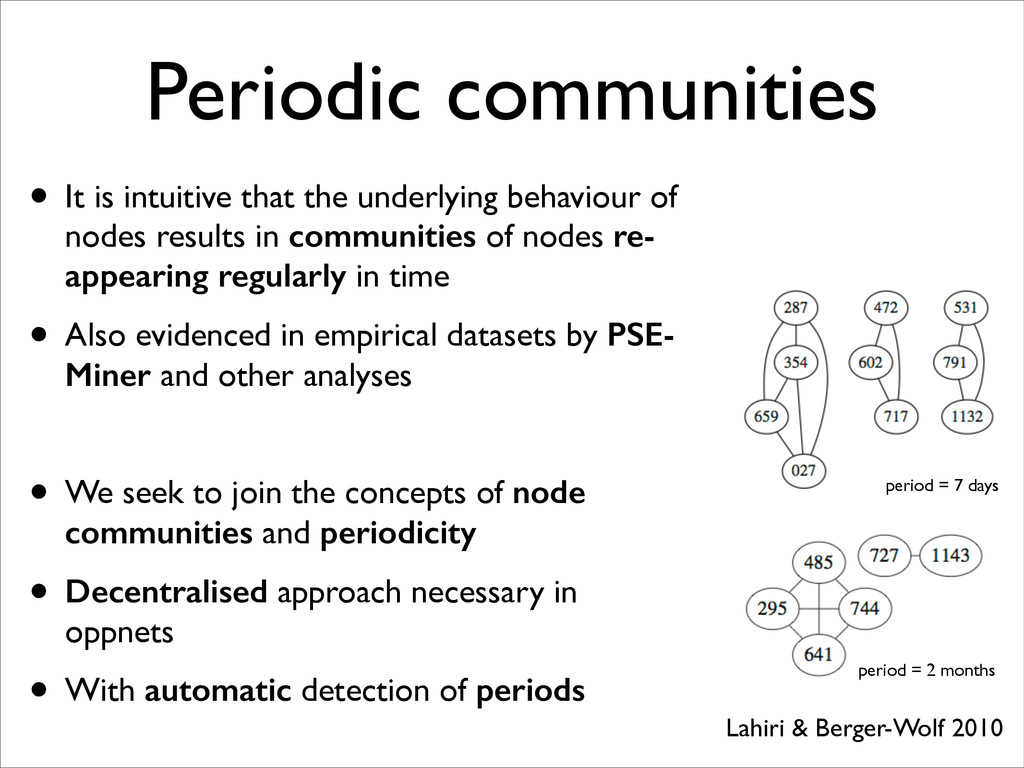
of nodes results in communities of nodes re- appearing regularly in time • Also evidenced in empirical datasets by PSE- Miner and other analyses ! • We seek to join the concepts of node communities and periodicity • Decentralised approach necessary in oppnets • With automatic detection of periods period = 7 days period = 2 months Lahiri & Berger-Wolf 2010
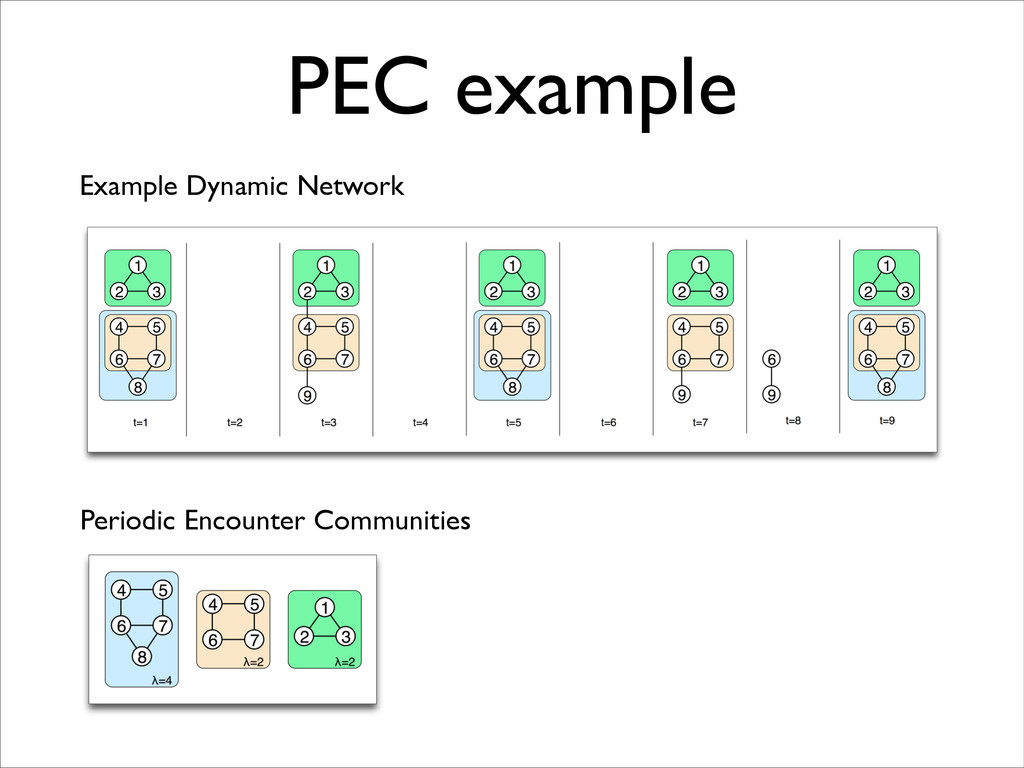
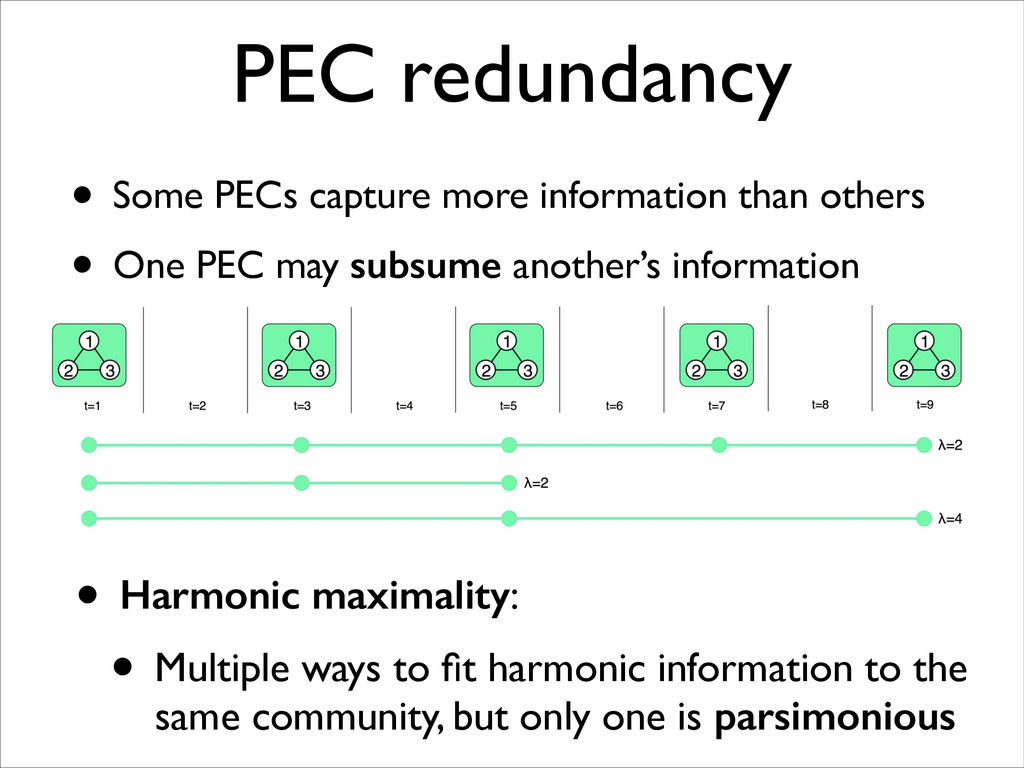
harmonic information to the same community, but only one is parsimonious • Some PECs capture more information than others • One PEC may subsume another’s information
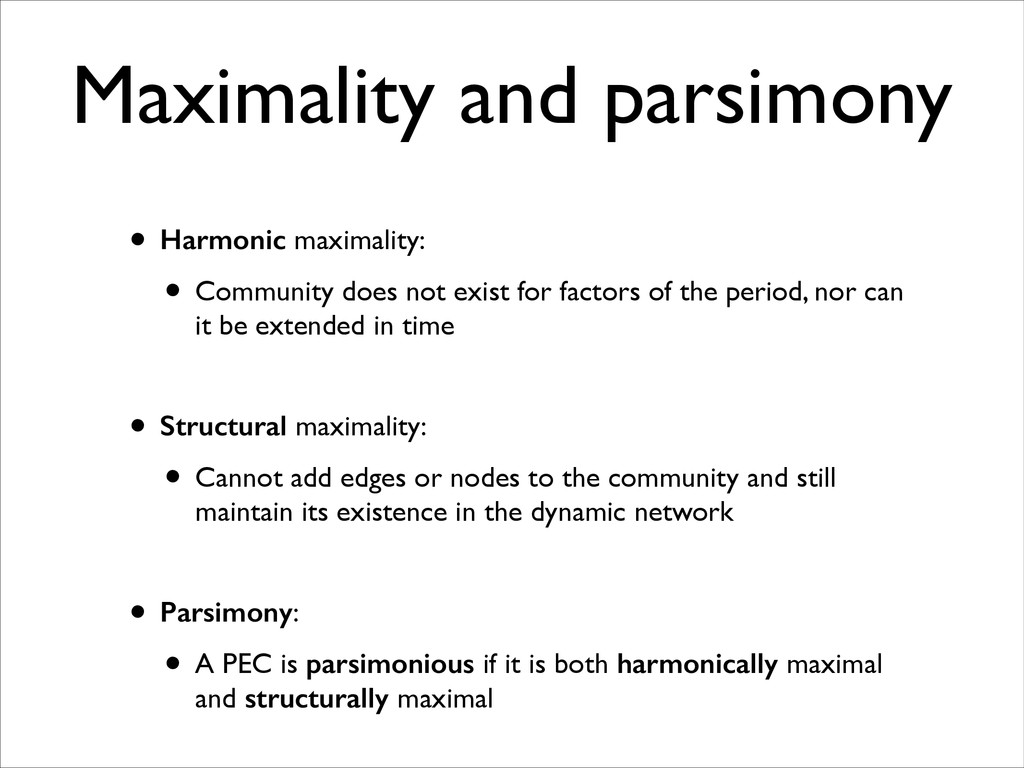
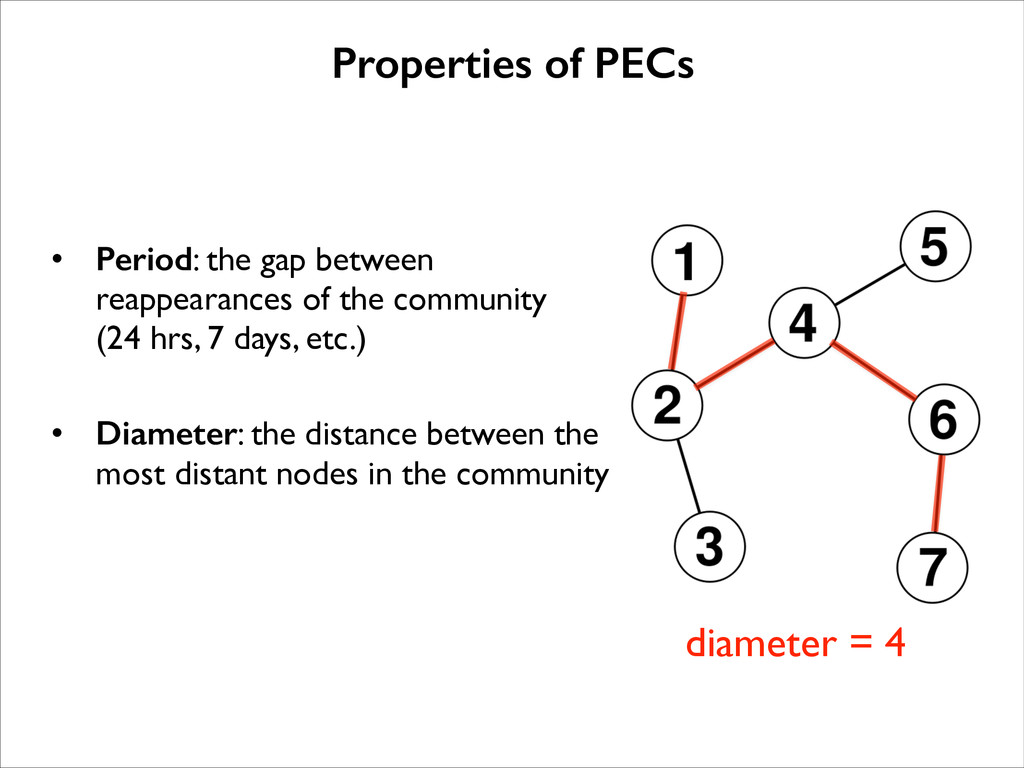
exist for factors of the period, nor can it be extended in time ! • Structural maximality: • Cannot add edges or nodes to the community and still maintain its existence in the dynamic network ! • Parsimony: • A PEC is parsimonious if it is both harmonically maximal and structurally maximal
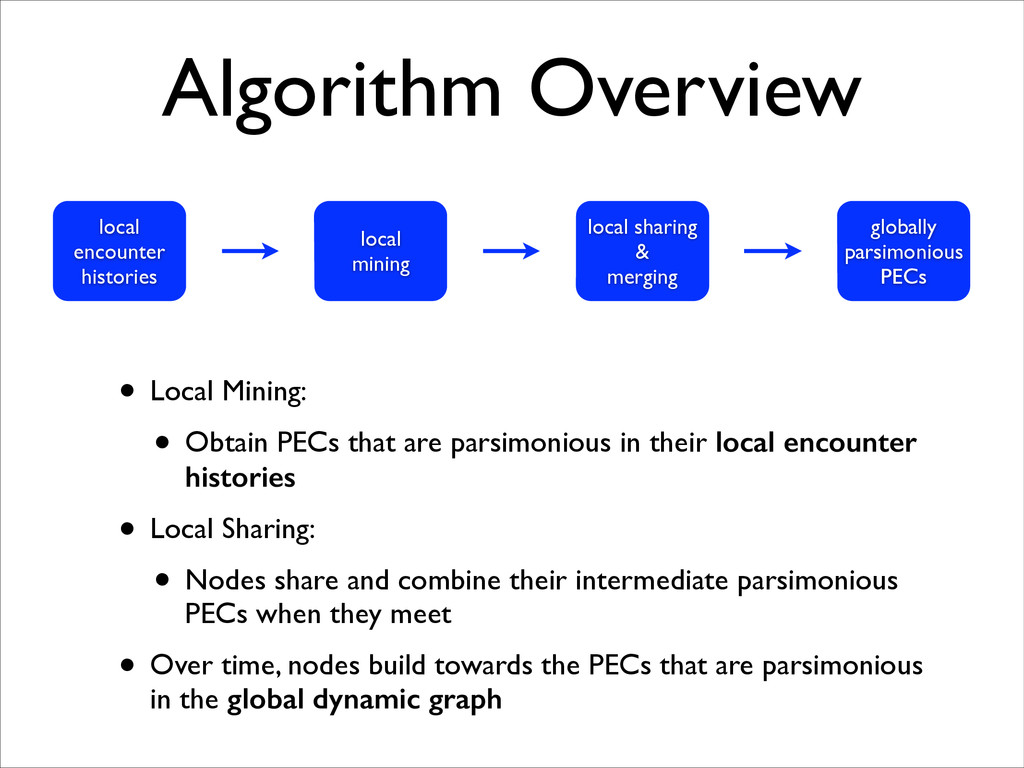
parsimonious in their local encounter histories • Local Sharing: • Nodes share and combine their intermediate parsimonious PECs when they meet • Over time, nodes build towards the PECs that are parsimonious in the global dynamic graph local mining local sharing & merging globally parsimonious PECs local encounter histories
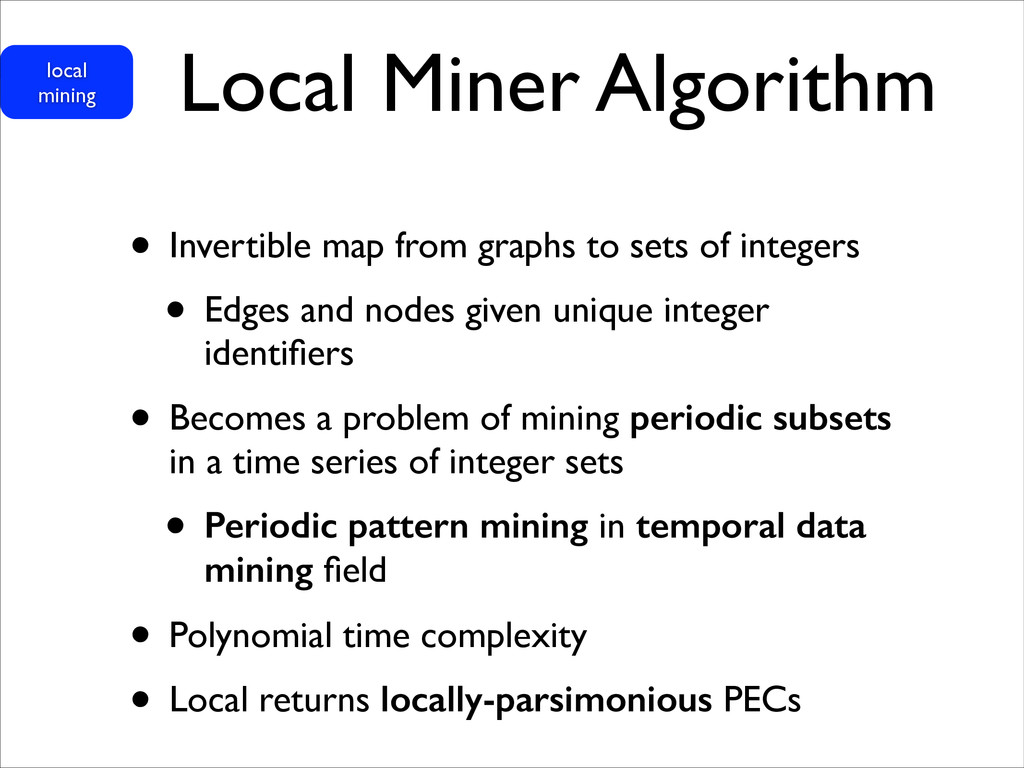
of integers • Edges and nodes given unique integer identifiers • Becomes a problem of mining periodic subsets in a time series of integer sets • Periodic pattern mining in temporal data mining field • Polynomial time complexity • Local returns locally-parsimonious PECs local mining
hold: • their communities intersect • the PECs are harmonically equal, or one harmonically subsumes the other • If compatible, there are three generation cases: case action harmonic equality merge communities keep harmonic information P1 harmonically subsumes P2 merge communities harmonic information from P2 P2 harmonically subsumes P1 merge communities harmonic information from P1 local sharing & merging
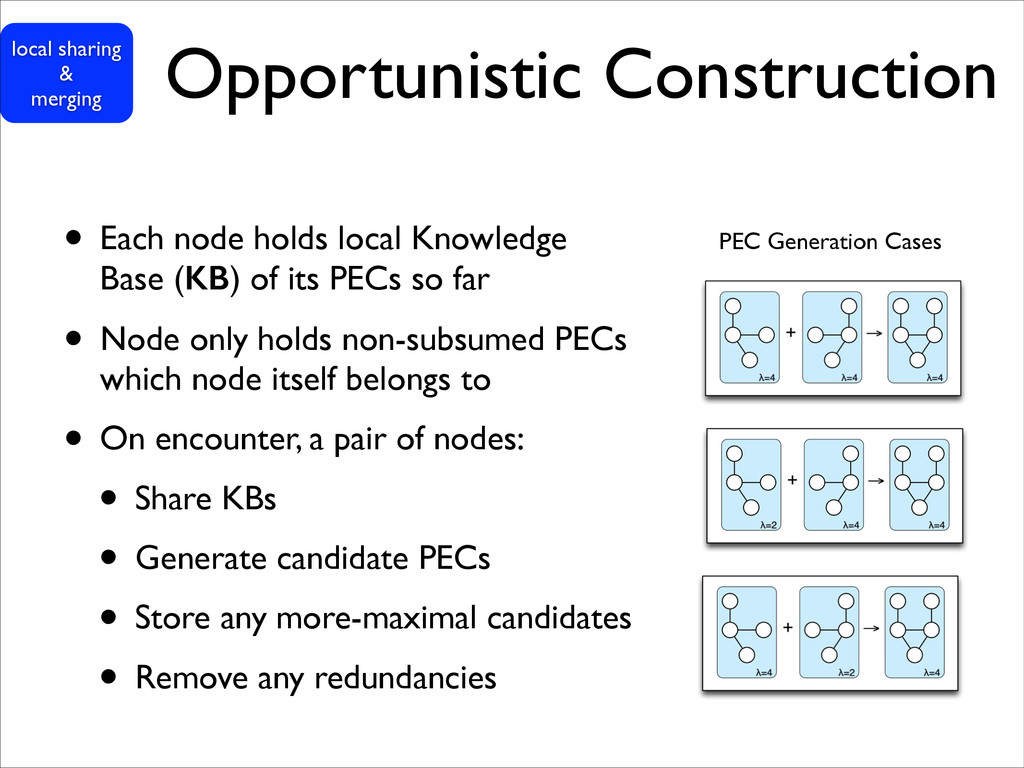
of its PECs so far • Node only holds non-subsumed PECs which node itself belongs to • On encounter, a pair of nodes: • Share KBs • Generate candidate PECs • Store any more-maximal candidates • Remove any redundancies PEC Generation Cases local sharing & merging
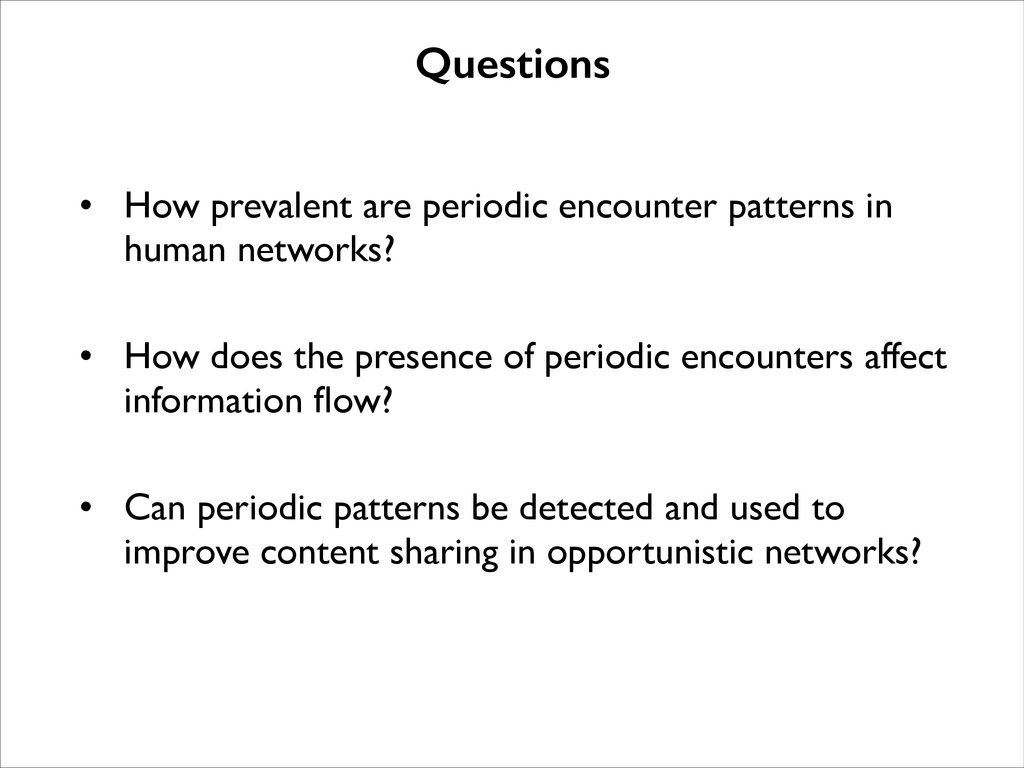
! • How does the presence of periodic encounters affect information flow? ! • Can periodic patterns be detected and used to improve content sharing in opportunistic networks? Questions
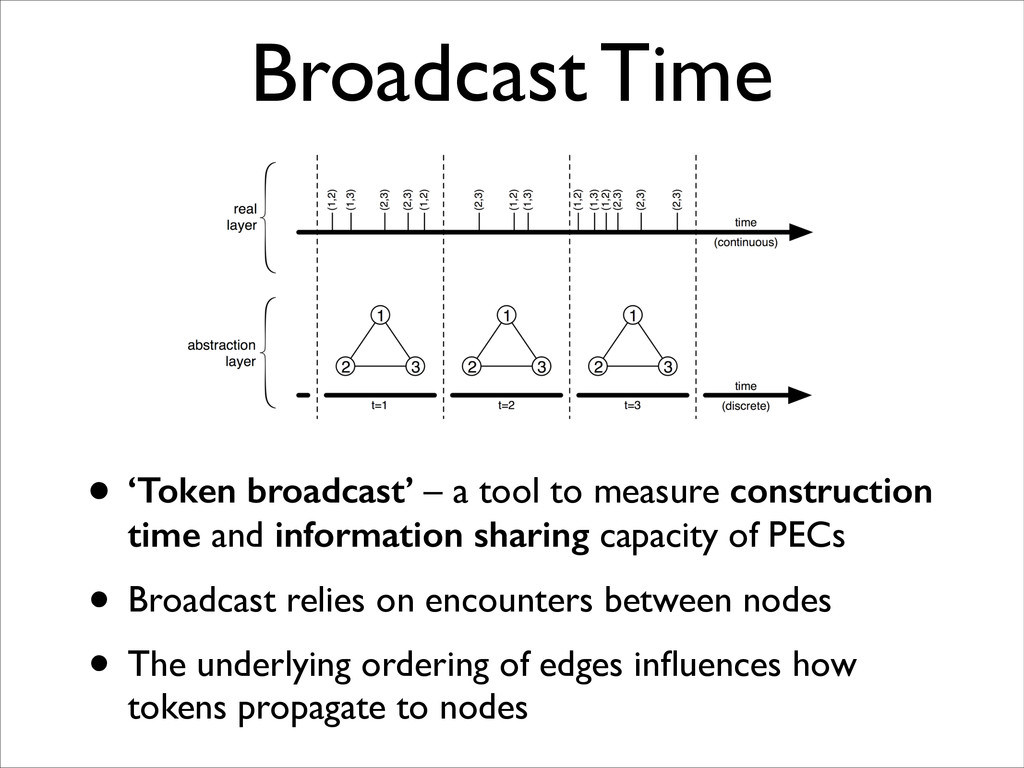
construction time and information sharing capacity of PECs • Broadcast relies on encounters between nodes • The underlying ordering of edges influences how tokens propagate to nodes
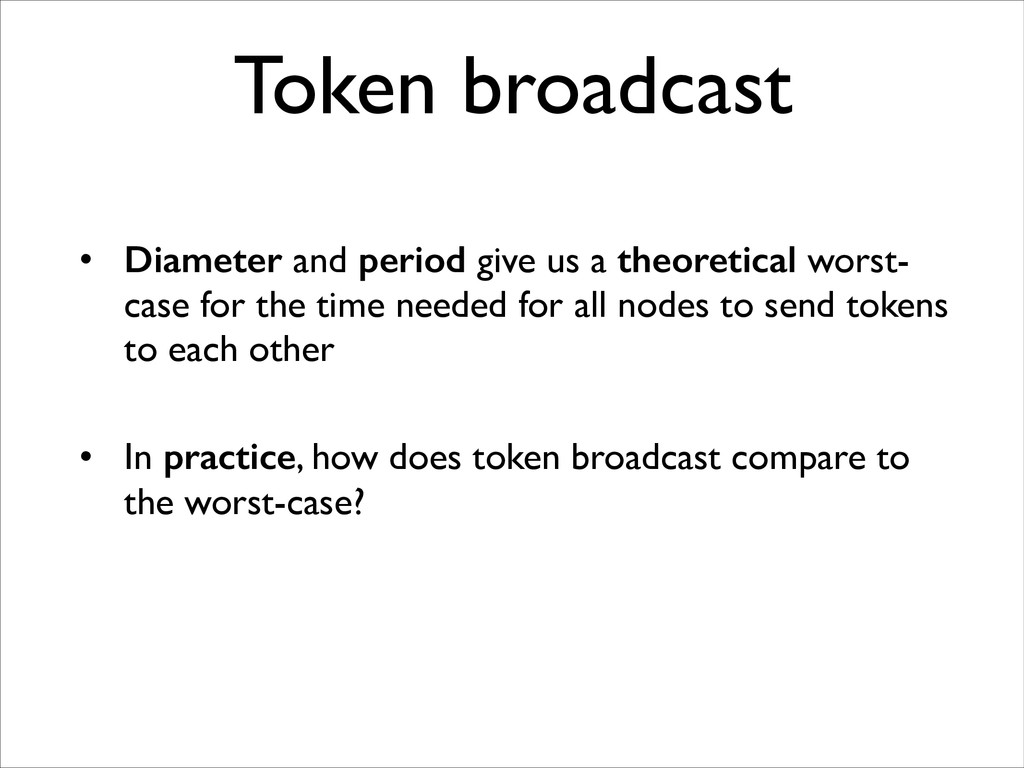
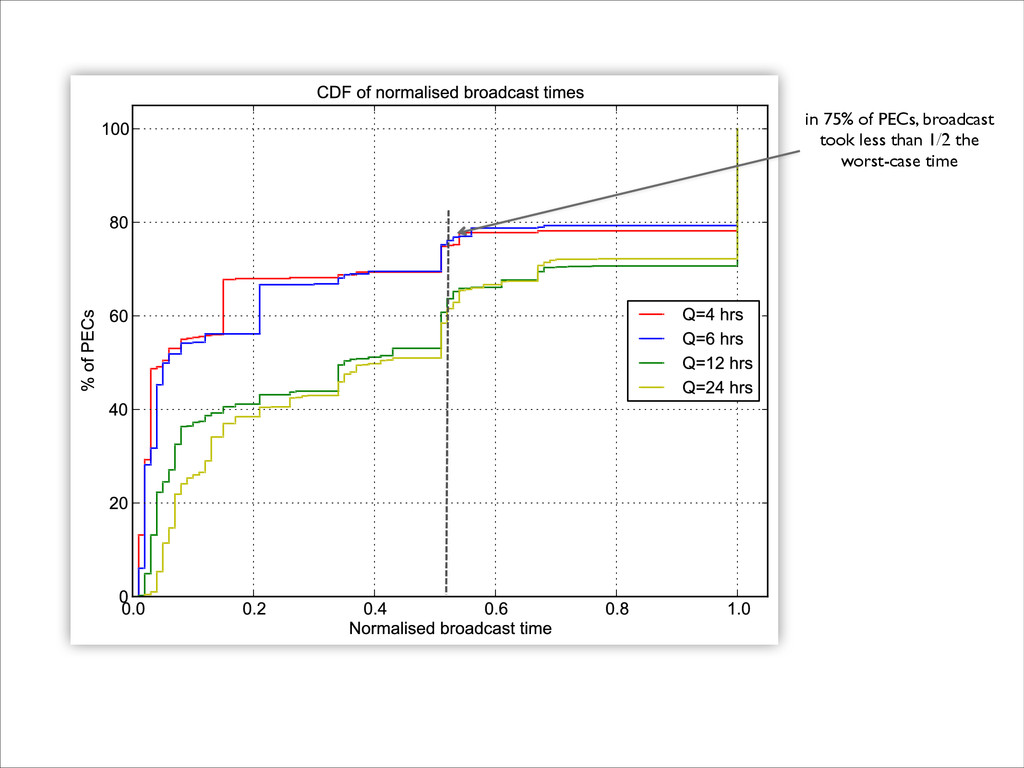
case for the time needed for all nodes to send tokens to each other ! • In practice, how does token broadcast compare to the worst-case? Token broadcast
decentrally, and with automatic periodicity identification • Time for globally parsimonious PEC construction is bounded by PEC period and diameter • On real data (Bluetooth encounters at MIT), construction time is much better than the analytic worst-case
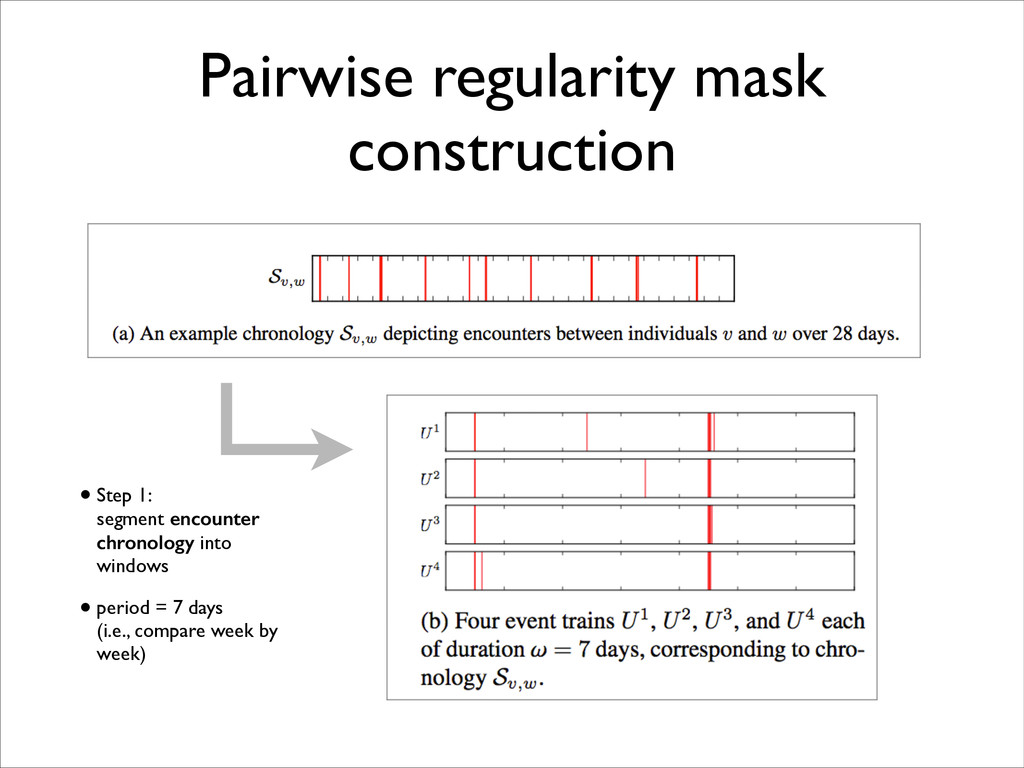
a time-resolved manner • Let’s replace the discrete-time harmonic information used in PEC detection with a time- resolved measure based on inter-event intervals (IEIs) • Assumption: we’re looking for encounter patterns at a single period that we select a priori
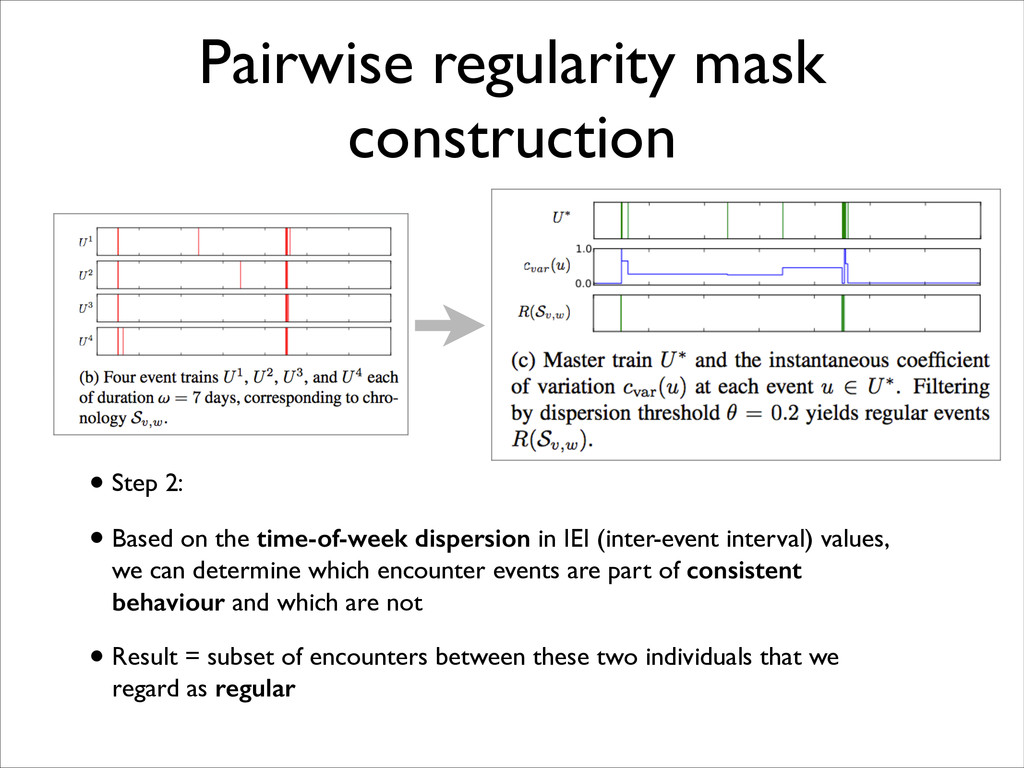
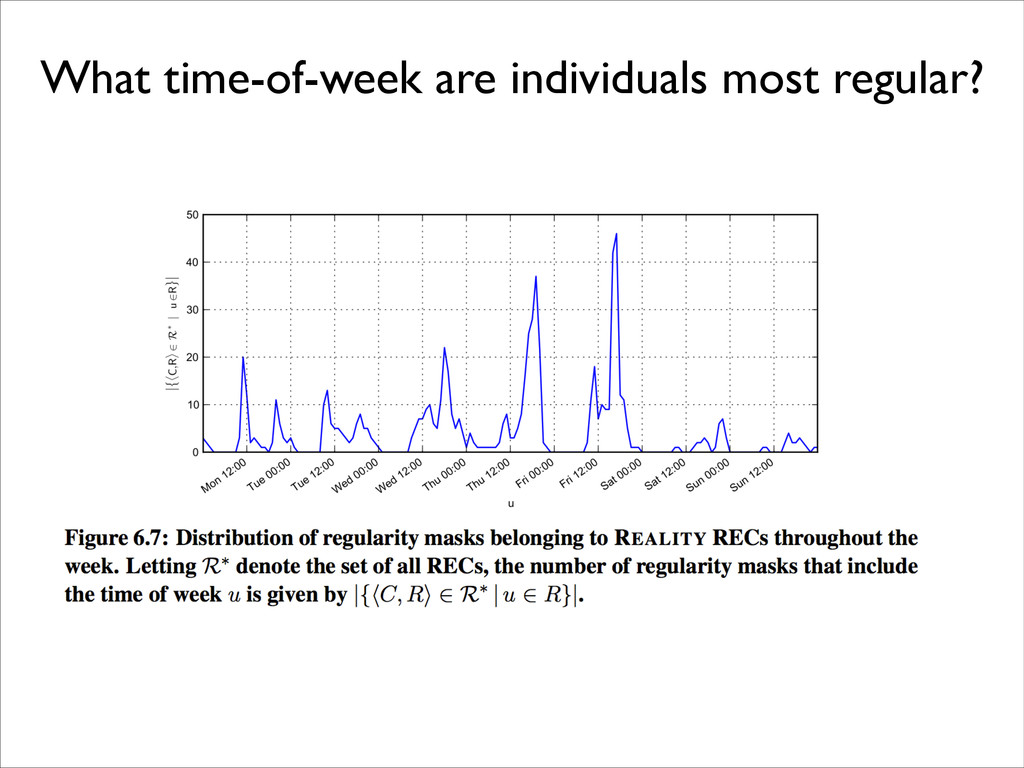
the time-of-week dispersion in IEI (inter-event interval) values, we can determine which encounter events are part of consistent behaviour and which are not • Result = subset of encounters between these two individuals that we regard as regular
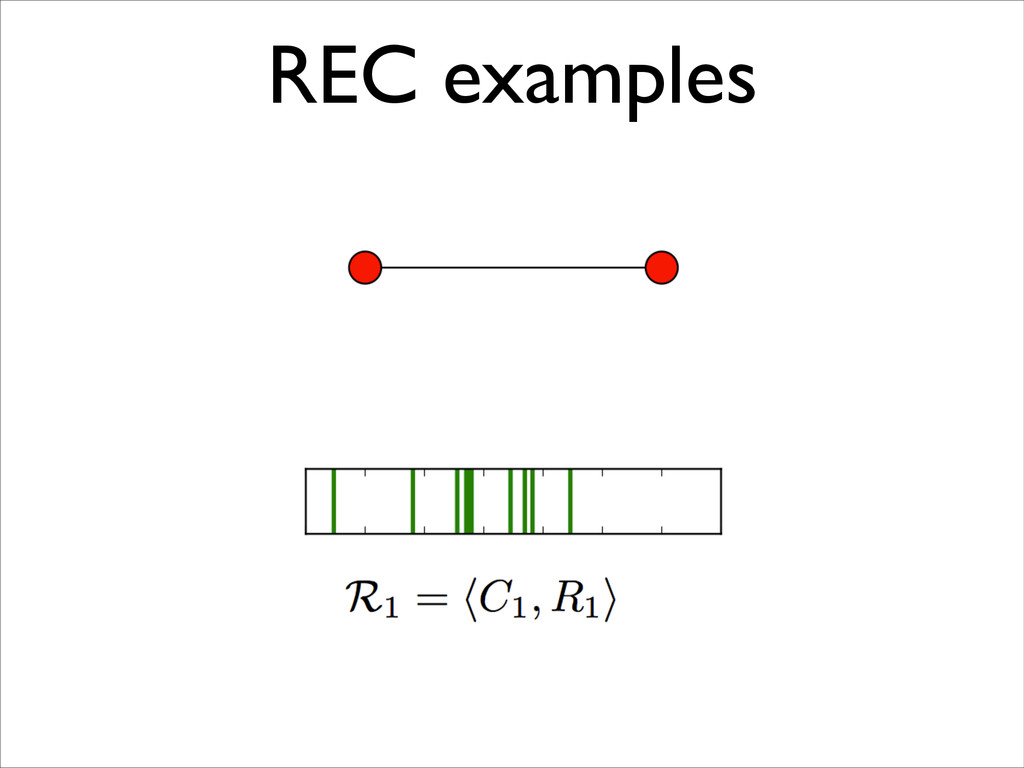
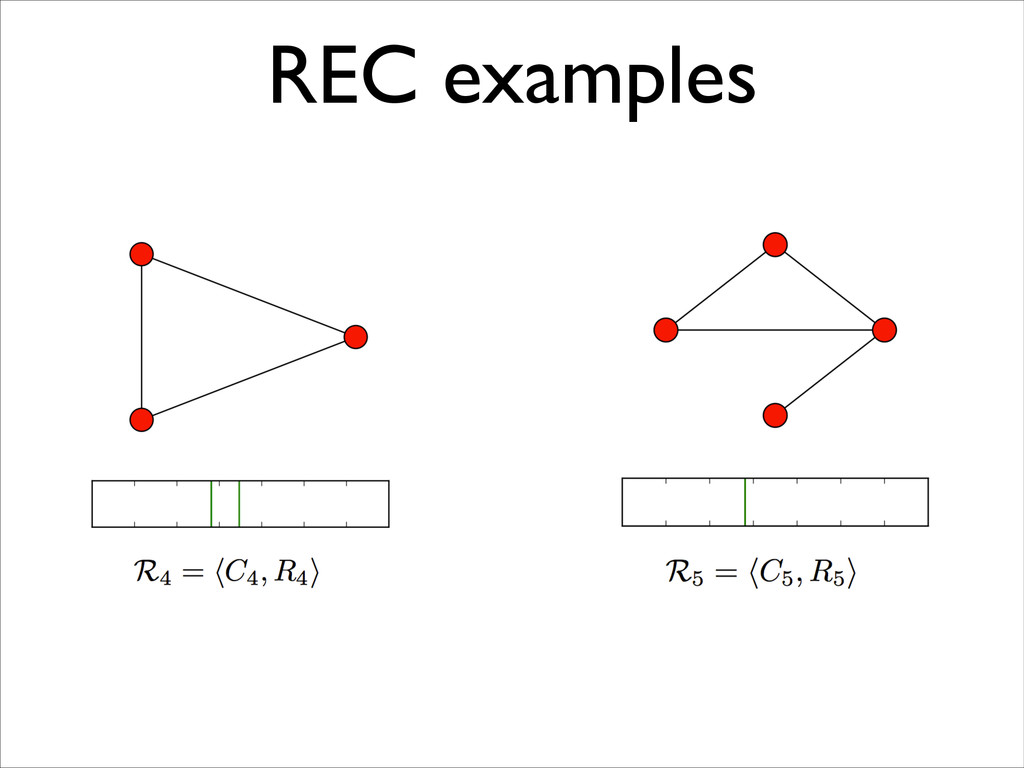
a community whose intersection of regularity is masks is non-empty • In other words, the individuals in the community all share a weekly encounter pattern ! • We can re-use a lot of the decentralised PEC detection algorithm, replacing a few components: • Structure = community (a connected graph) (same as before) • Harmonic information = regularity mask • REC combination = by graph union and regularity mask intersection
for the chosen four weeks • 76% of participants belonged to at least one REC • 64% of RECs contained two to three individuals • Diameters typically small, but larger than PECs
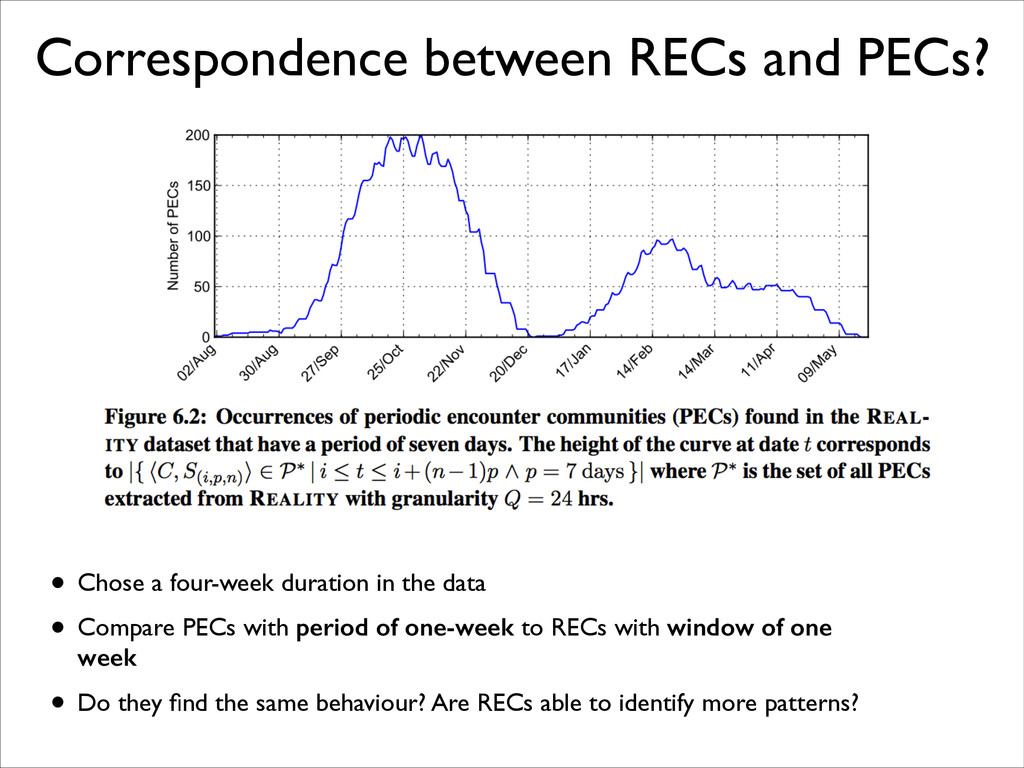
in the data • Compare PECs with period of one-week to RECs with window of one week • Do they find the same behaviour? Are RECs able to identify more patterns?
its periodic requirement: the community must meet in each periodic timestep • RECs have weaker requirement, and so token broadcast suffers • Only 35% of RECs reached full broadcast after one week • 32% RECs failed to reach full broadcast after the full (four week) duration (cf. 0% for PECs)
algorithm for REC constructions, with some changes: • regularity mask instead of periodic timesteps • new local miner algorithm • RECs give us time-resolved periodic patterns (higher temporal resolution than PECs) • RECs capture majority (but not all) of the PEC patterns, plus more • Due to less-strict assertion on encounter timing, information sharing (token broadcast) is slower in RECs
www.gplus.to/mattjw And supported by... Various work in collaboration with: Roger Whitaker" Stuart Allen" Martin Chorley" Walter Colombo www.recognition-project.eu" www.social-nets.eu
People stencil by "jcallender"! http://graffletopia.com/stencils/639! ! Students in class:! FOSDEM 2008 main lecture theatre! http://commons.wikimedia.org/wiki/File:FOSDEM_2008_Main_lecture_theatre.jpg! ! Crowd wearing masks:! http://www.ickypeople.com/2009_04_26_archive.html! ! Coffee shop counter:! "Counter stocked for opening day" by Buz Carter! http://www.flickr.com/photos/pizzabytheslice/2320006035/in/photostream/! ! Foursquare pub icon:! https://foursquare.com/! ! Foursquare logo:! https://foursquare.com/about/logos! ! Access point icon:! By IconShock! http://www.iconfinder.com/icondetails/45228/128/access_point_router_icon! ! London Underground logo:! http://en.wikipedia.org/wiki/File:Underground.svg
![Thanks for listening! Any questions? Matt Williams! www.mattjw.net [email protected]" @voxmjw"](https://files.speakerdeck.com/presentations/24a1a8bb78d6470c966b47cddf838740/slide_75.jpg)