Upgrade to Pro — share decks privately, control downloads, hide ads and more …

Measuring Individual Regularity in Human Visiting Patterns

Matt J Williams
September 04, 2012
81

Measuring Individual Regularity in Human Visiting Patterns

Research talk.
Venue: ASE / IEEE International Conference on Social Computing (SOCIALCOM), Amsterdam, Netherlands.

Matt J Williams

September 04, 2012
Tweet

Transcript

  1. Measuring Individual Regularity in
    Human Visiting Patterns
    ASE / IEEE
    International Conference
    on Social Computing (SOCIALCOM)
    3rd–5th September 2012
    Matt Williams, Roger Whitaker, Stuart Allen
    Cardiff University
    School of Computer Science
    & Informatics
    United Kingdom

    View Slide

  2. Overview
    • Introduction
    • Method – IVI-irregularity
    • Datasets and results
    • Conclusions

    View Slide

  3. Introduction
    Can we quantify and exploit regularity in individuals’
    patterns of visits to locations?

    View Slide

  4. routine in human mobility gives rise to regular visiting behaviour
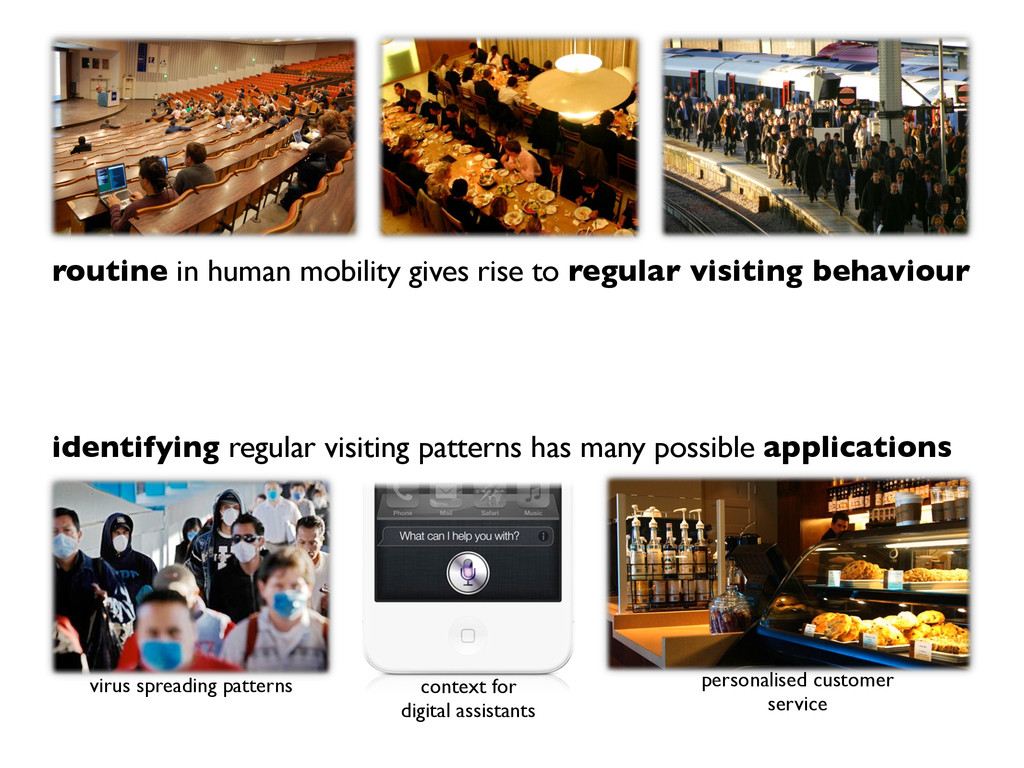
    identifying regular visiting patterns has many possible applications
    personalised customer
    service
    virus spreading patterns context for
    digital assistants

    View Slide

  5. user-at-location chronologies
    (u1
    ,l1
    )
    We call the history of visits
    for a particular user u
    at a particular location l
    a visit chronology
    (u1,l2)
    (u1,l3)

    View Slide

  6. Event-based visit chronologies
    • Many systems record visit data as 
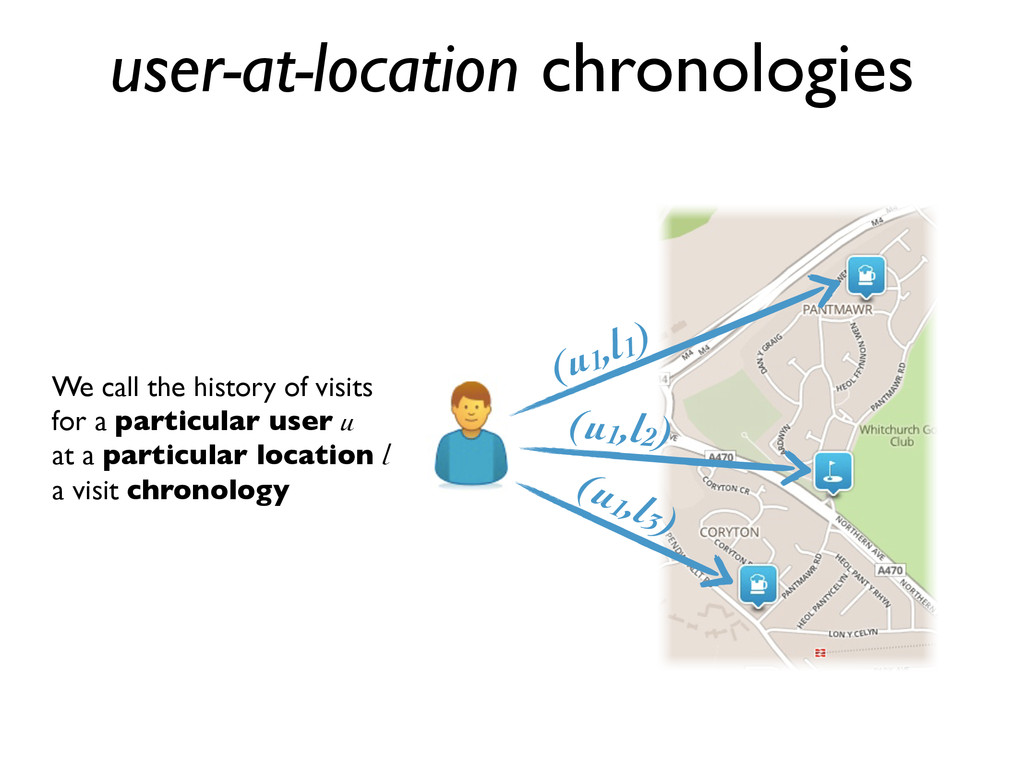
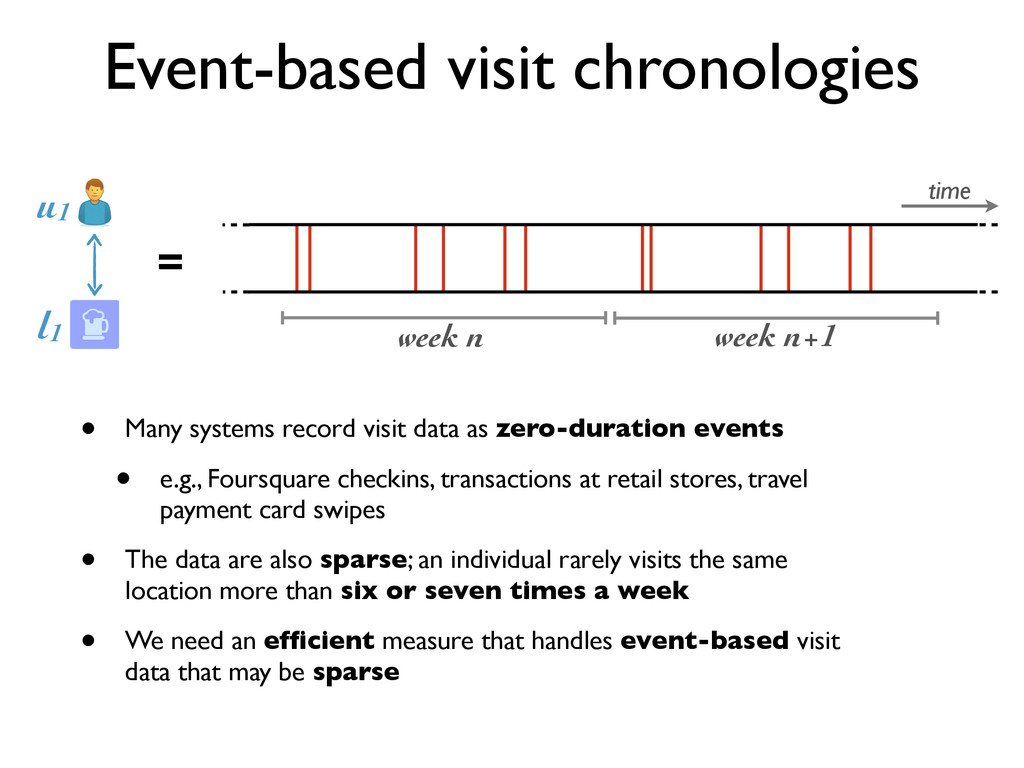
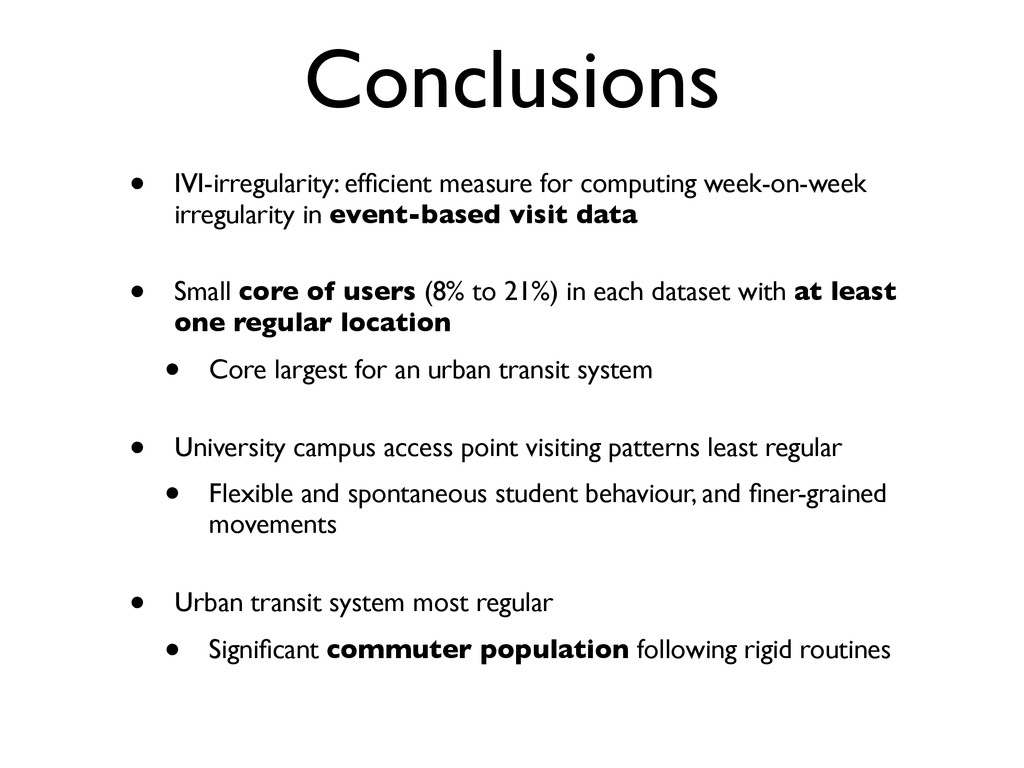
zero-duration events
    • e.g., Foursquare checkins, transactions at retail stores, travel
    payment card swipes
    • The data are also sparse; an individual rarely visits the same
    location more than six or seven times a week
    • We need an efficient measure that handles event-based visit
    data that may be sparse
    week n week n+1
    =
    time
    u1
    l1

    View Slide

  7. Quantifying regularity
    ...using IVI-irregularity

    View Slide

  8. wk 1 wk 2 wk 3 wk 4
    • IVI-Irregularity: 
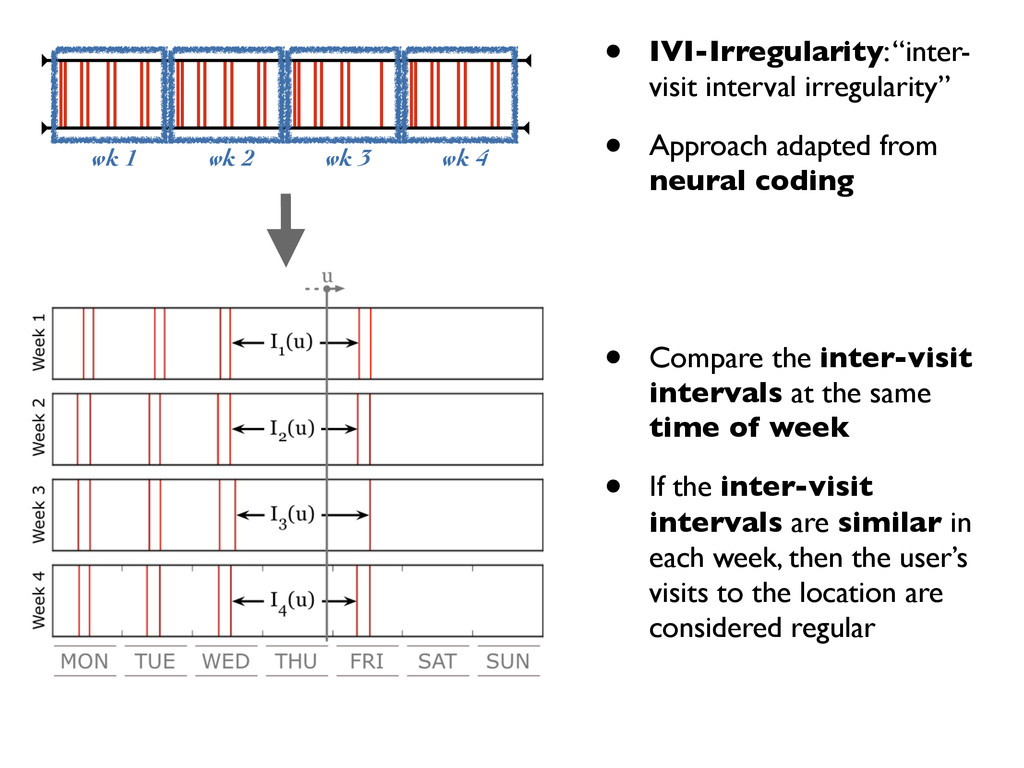
“inter-
    visit interval irregularity”
    • Approach adapted from
    neural coding
    • Compare the inter-visit
    intervals at the same
    time of week
    • If the inter-visit
    intervals are similar in
    each week, then the user’s
    visits to the location are
    considered regular

    View Slide

  9. IVI-irregularity score
    score = 0.040 score = 0.392
    score = 
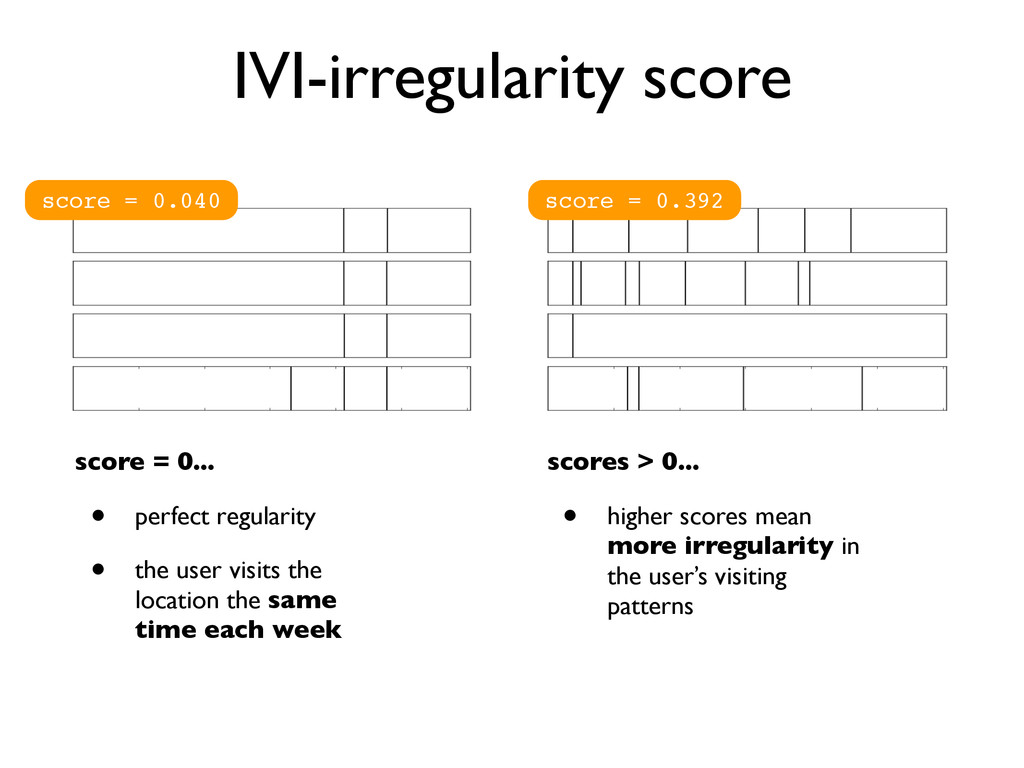
0...
    • perfect regularity
    • the user visits the
    location the same
    time each week
    scores > 0...
    • higher scores mean
    more irregularity in
    the user’s visiting
    patterns

    View Slide

  10. Results

    View Slide

  11. Scale
    Visit
    type
    Num.
    users
    Num.
    locs.
    Num.
    visits
    Num.
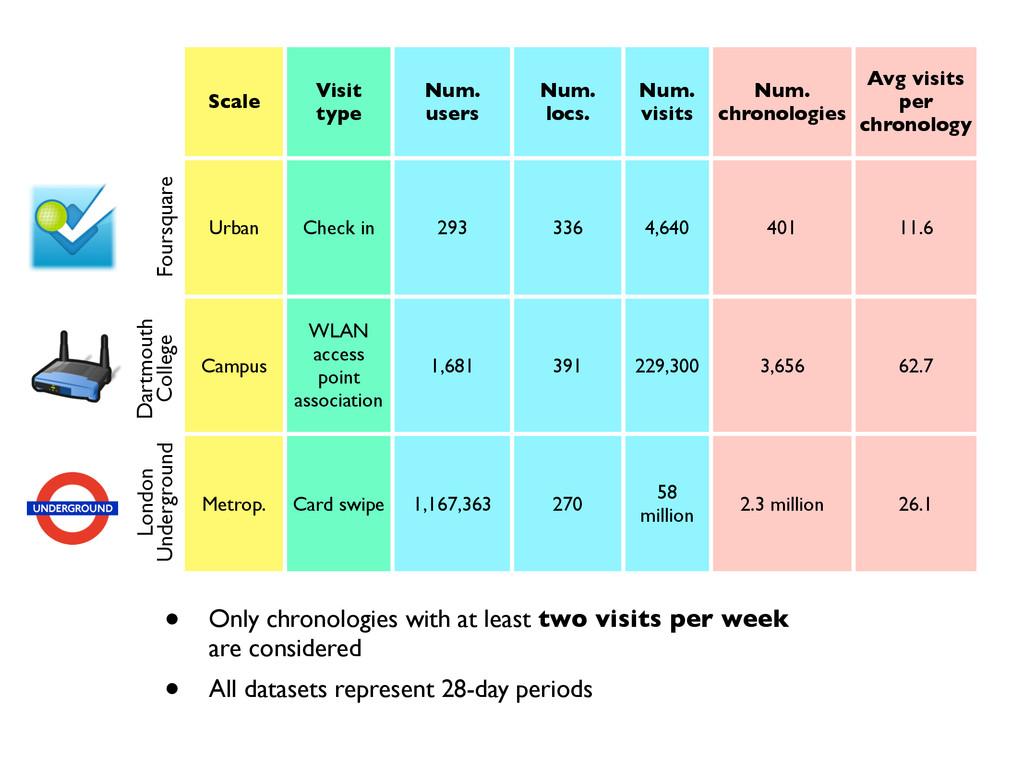
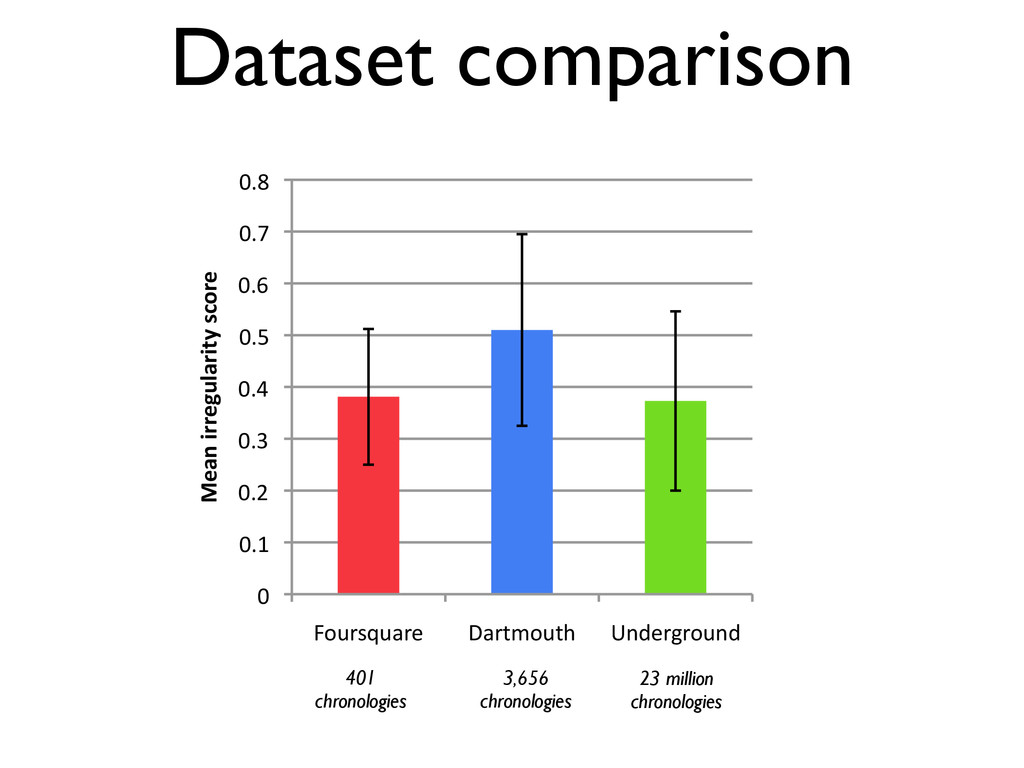
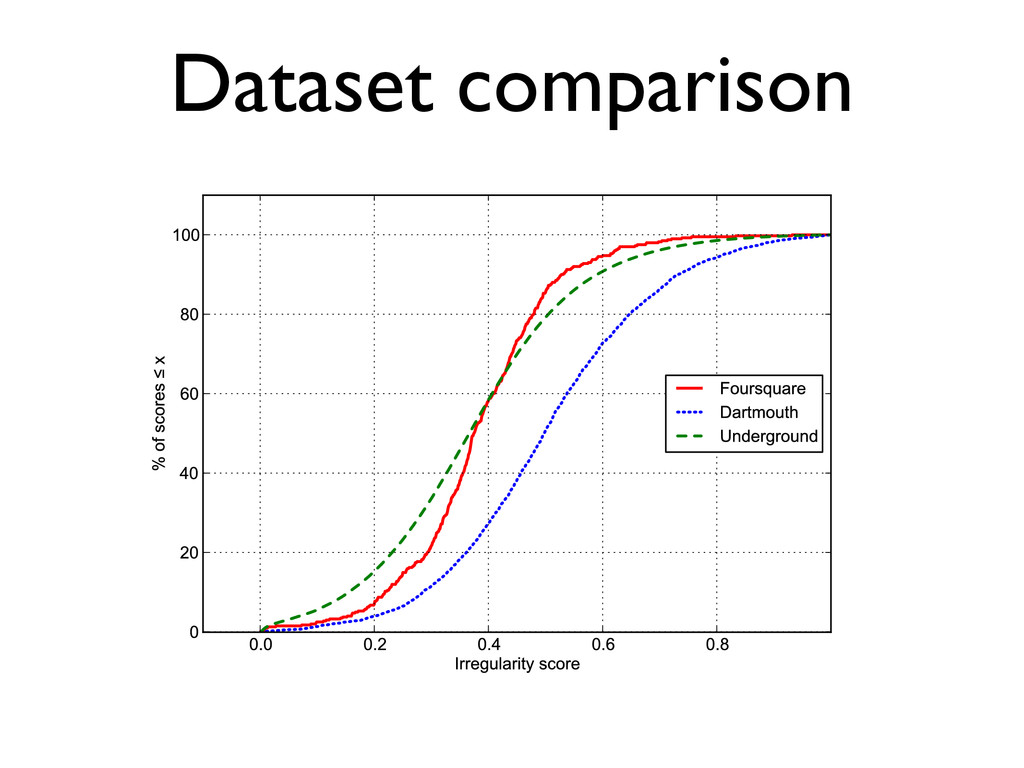
    chronologies
    Avg visits
    per
    chronology
    Urban Check in 293 336 4,640 401 11.6
    Campus
    WLAN
    access
    point
    association
    1,681 391 229,300 3,656 62.7
    Metrop. Card swipe 1,167,363 270
    58
    million
    2.3 million 26.1
    Foursquare
    London
    Underground
    • Only chronologies with at least two visits per week
    are considered
    • All datasets represent 28-day periods
    Dartmouth
    College

    View Slide

  12. Dataset comparison
    0"
    0.1"
    0.2"
    0.3"
    0.4"
    0.5"
    0.6"
    0.7"
    0.8"
    Foursquare" Dartmouth" Underground"
    Mean%irregularity%score%
    401
    chronologies
    3,656
    chronologies
    23 million
    chronologies

    View Slide

  13. Dataset comparison

    View Slide

  14. Comparison by location type
    0" 0.1" 0.2" 0.3" 0.4" 0.5" 0.6" 0.7" 0.8" 0.9"
    Arts"&"Ent"
    Food""
    Nightlife"Spots""
    Shops""
    Homes/Work"
    Travel"Spots""
    Colleges"&"Univs."
    Great"Outdoors""
    Academic""
    Library""
    Social""
    Admin""
    Residence""
    AthleRc""
    Mean%irregularity%score%
    Dartmouth
    Foursquare

    View Slide

  15. Very regular chronologies
    • Number of ‘very regular’
    chronologies
    (those with irregularity ≤ 0.2):
    • Foursquare: 8.2%
    • Dartmouth: 4.4%
    • Underground: 17.4%

    View Slide

  16. Very regular locations per user
    • Number of users with
    at least one ‘very
    regular’ location:
    • Foursquare
    9.3%
    • Dartmouth
    8.2%
    • Underground
    21.2%

    View Slide

  17. Conclusions
    • IVI-irregularity: efficient measure for computing week-on-week
    irregularity in 
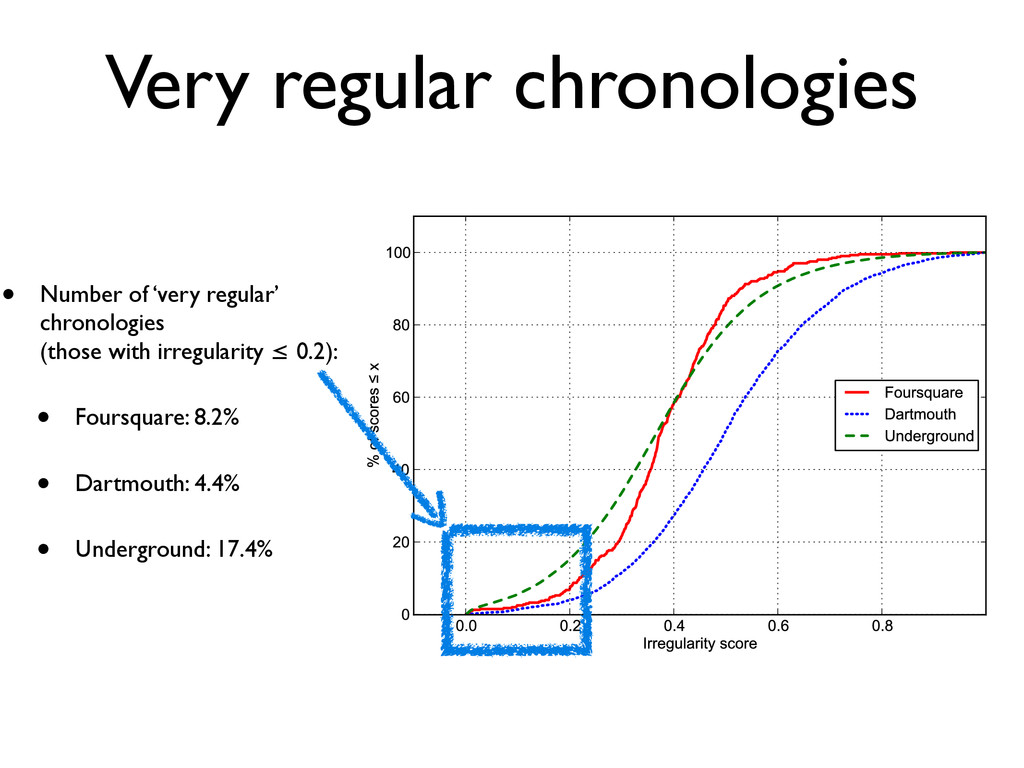
event-based visit data
    • Small core of users (8% to 21%) in each dataset with at least
    one regular location
    • Core largest for an urban transit system
    • University campus access point visiting patterns least regular
    • Flexible and spontaneous student behaviour, and finer-grained
    movements
    • Urban transit system most regular
    • Significant commuter population following rigid routines

    View Slide

  18. Thanks for listening!
    Any questions?
    Matt Williams
    www.mattjw.net
    [email protected]
    @voxmjw
    www.gplus.to/mattjw
    Supported by...
    { M.J.Williams,
    R.M.Whitaker,
    Stuart.M.Allen }
    @cs.cardiff.ac.uk
    www.recognition-project.eu

    View Slide

  19. Attribution
    Foursquare maps:
    https://foursquare.com/
    User icons:
    UX People stencil by "jcallender"
    http://graffletopia.com/stencils/639
    Students in class:
    FOSDEM 2008 main lecture theatre
    http://commons.wikimedia.org/wiki/File:FOSDEM_2008_Main_lecture_theatre.jpg
    Crowd wearing masks:
    http://www.ickypeople.com/2009_04_26_archive.html
    Coffee shop counter:
    "Counter stocked for opening day" by Buz Carter
    http://www.flickr.com/photos/pizzabytheslice/2320006035/in/photostream/
    Foursquare pub icon:
    https://foursquare.com/
    Foursquare logo:
    https://foursquare.com/about/logos
    Access point icon:
    By IconShock
    http://www.iconfinder.com/icondetails/45228/128/access_point_router_icon
    London Underground logo:
    http://en.wikipedia.org/wiki/File:Underground.svg

    View Slide