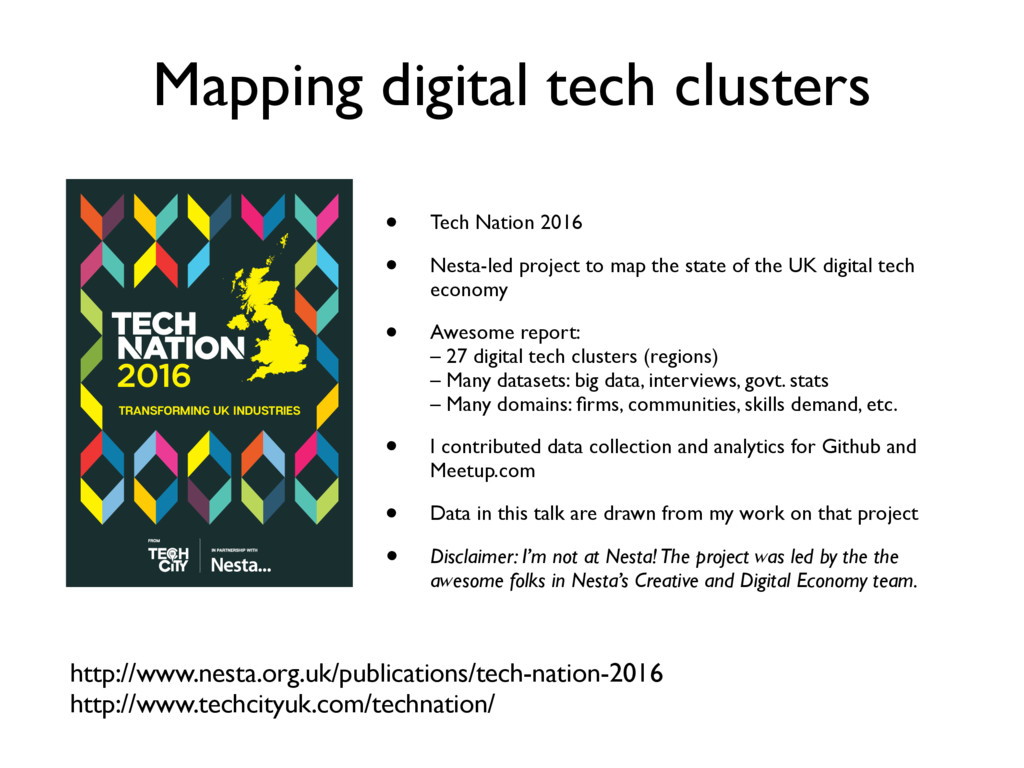
Tech Nation 2016 • Nesta-led project to map the state of the UK digital tech economy • Awesome report: – 27 digital tech clusters (regions) – Many datasets: big data, interviews, govt. stats – Many domains: firms, communities, skills demand, etc. • I contributed data collection and analytics for Github and Meetup.com • Data in this talk are drawn from my work on that project • Disclaimer: I’m not at Nesta! The project was led by the the awesome folks in Nesta’s Creative and Digital Economy team.
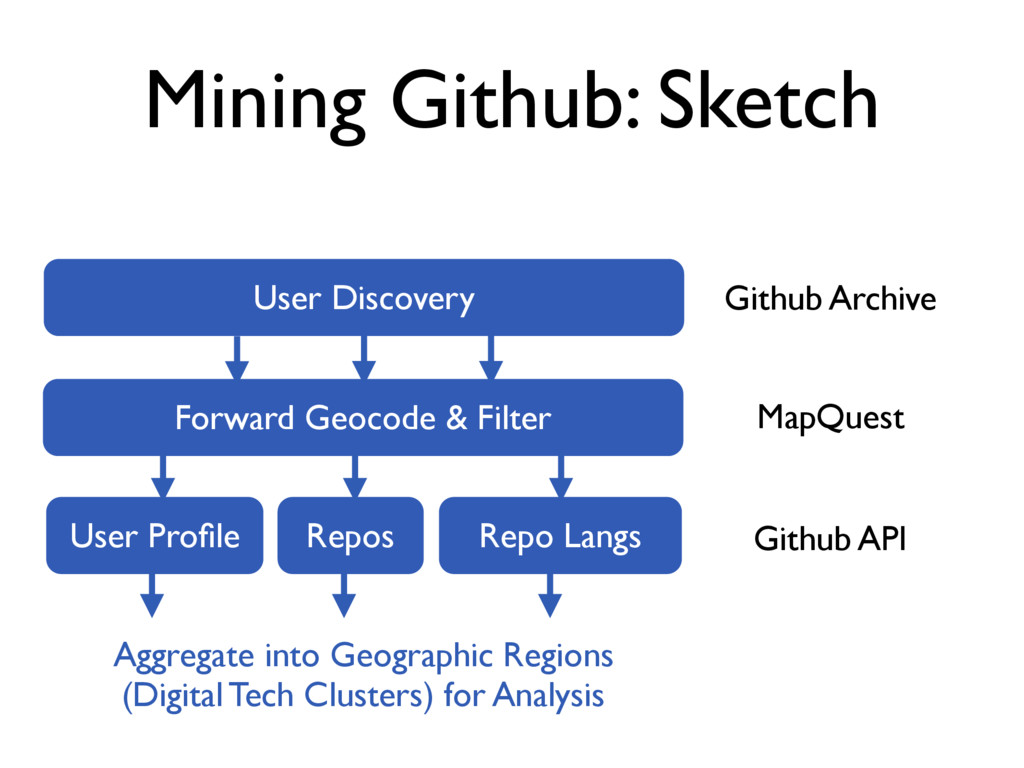
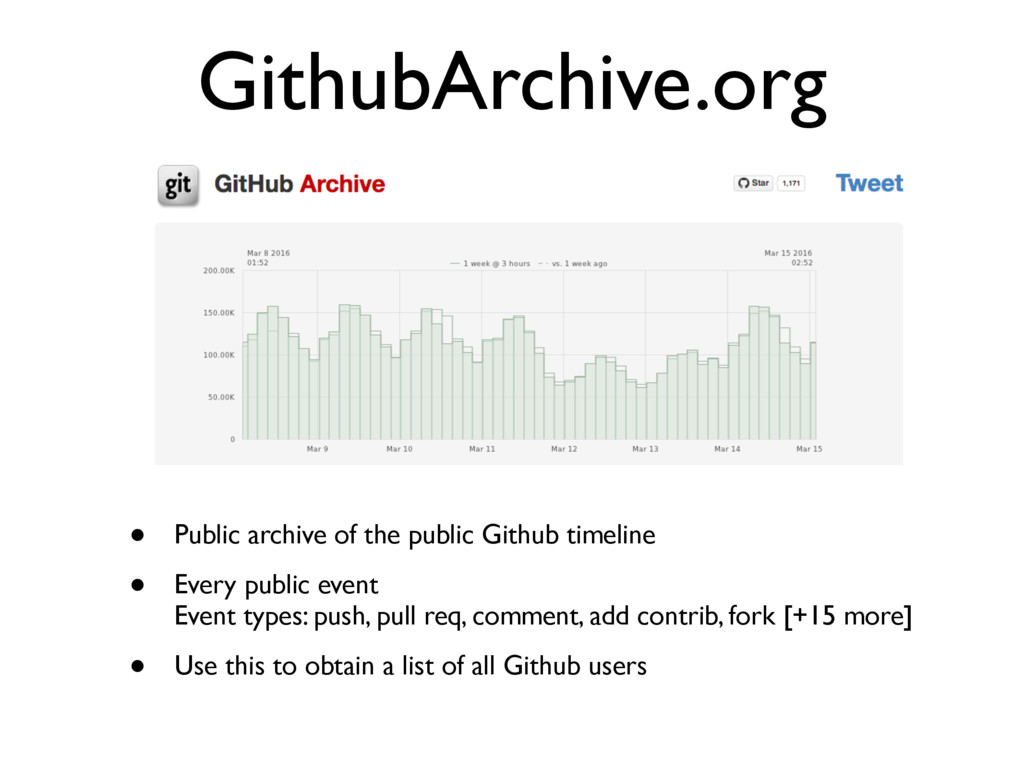
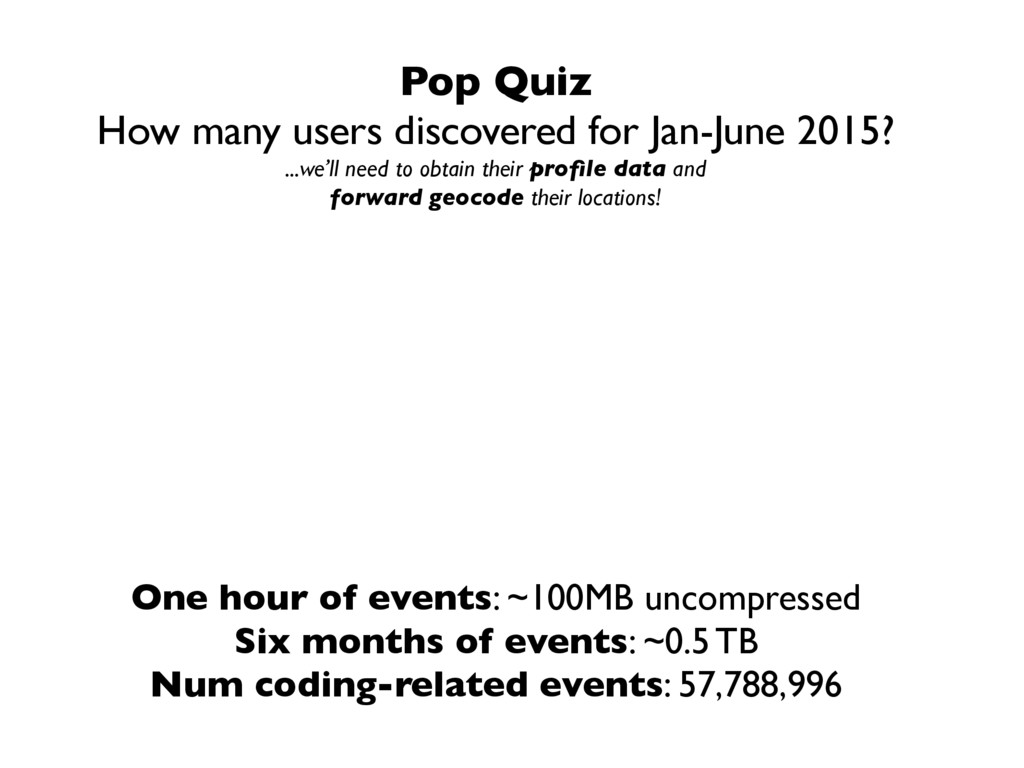
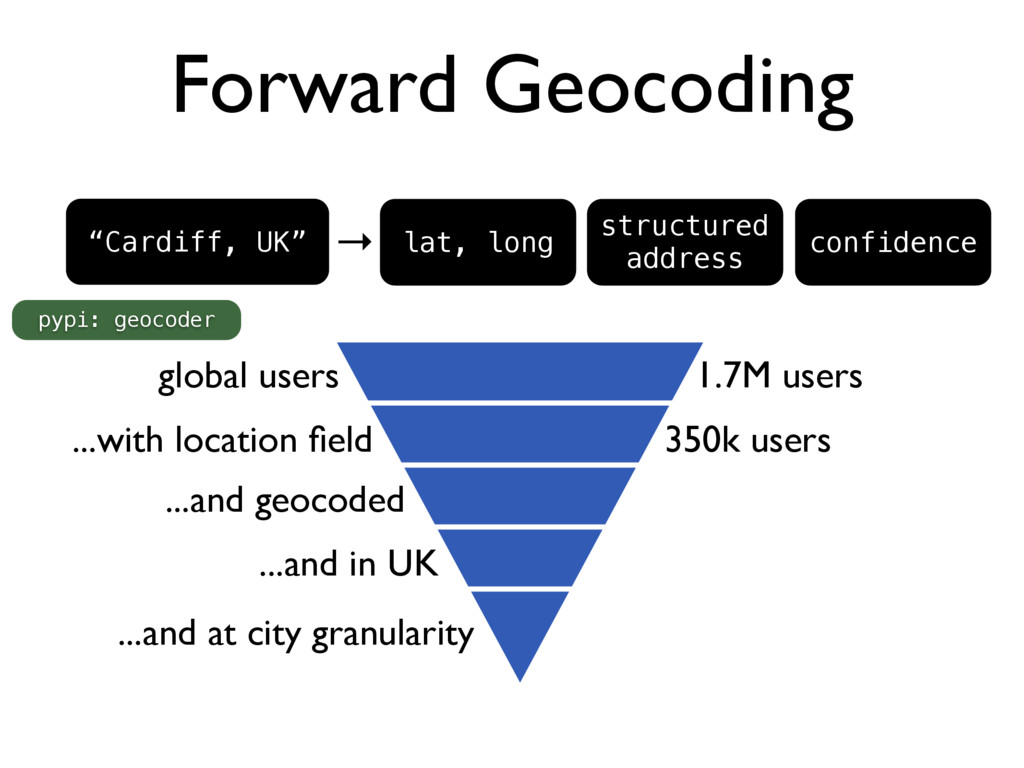
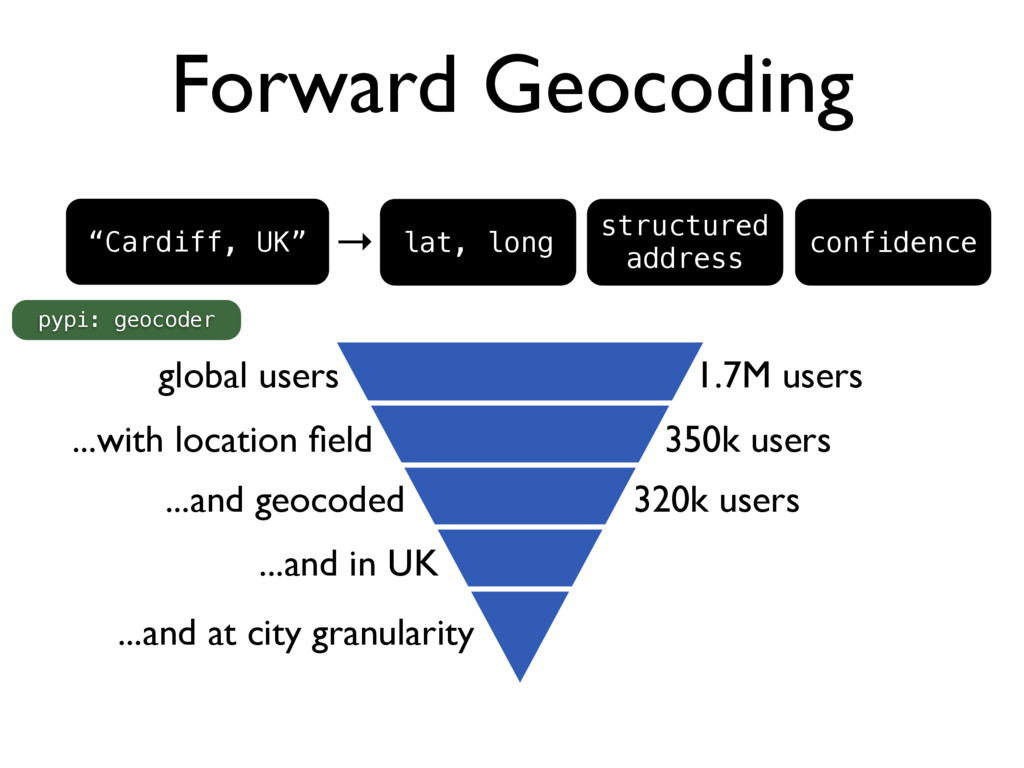
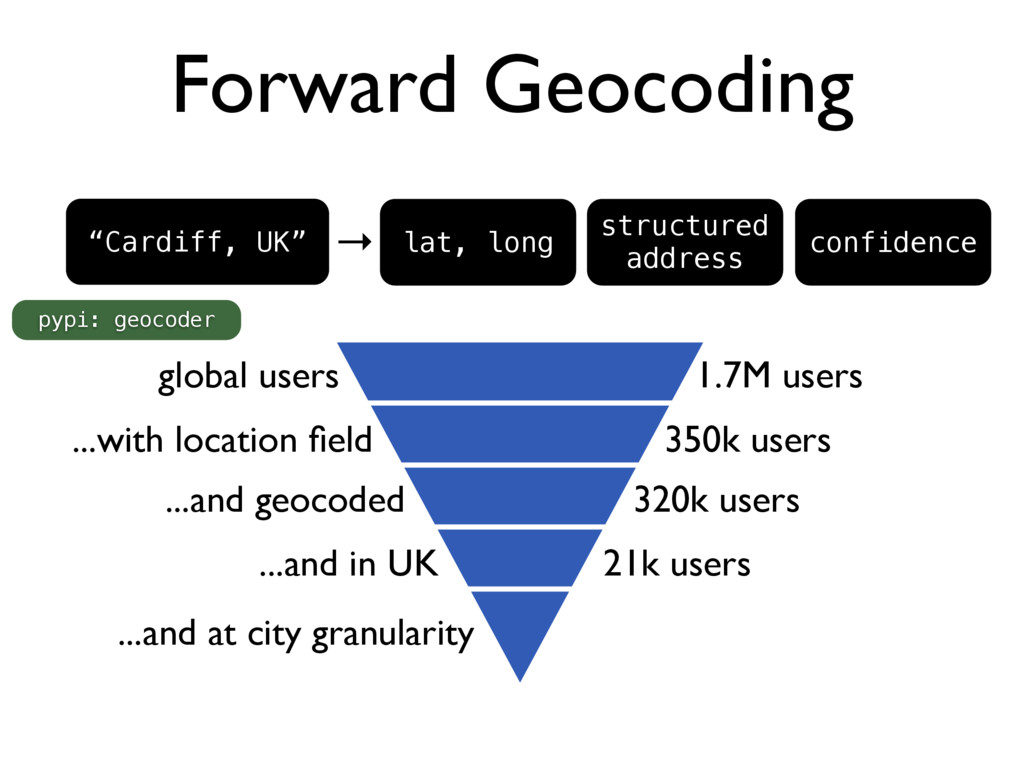
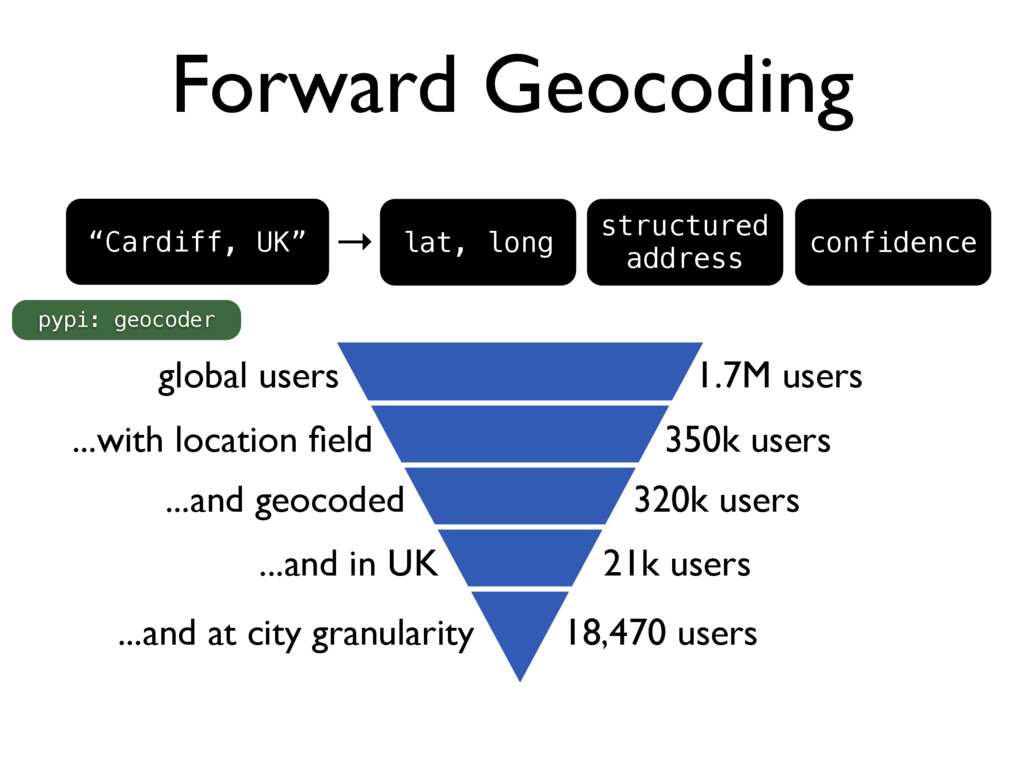
~0.5 TB Num coding-related events: 57,788,996 Pop Quiz How many users discovered for Jan-June 2015? ...we’ll need to obtain their profile data and forward geocode their locations!
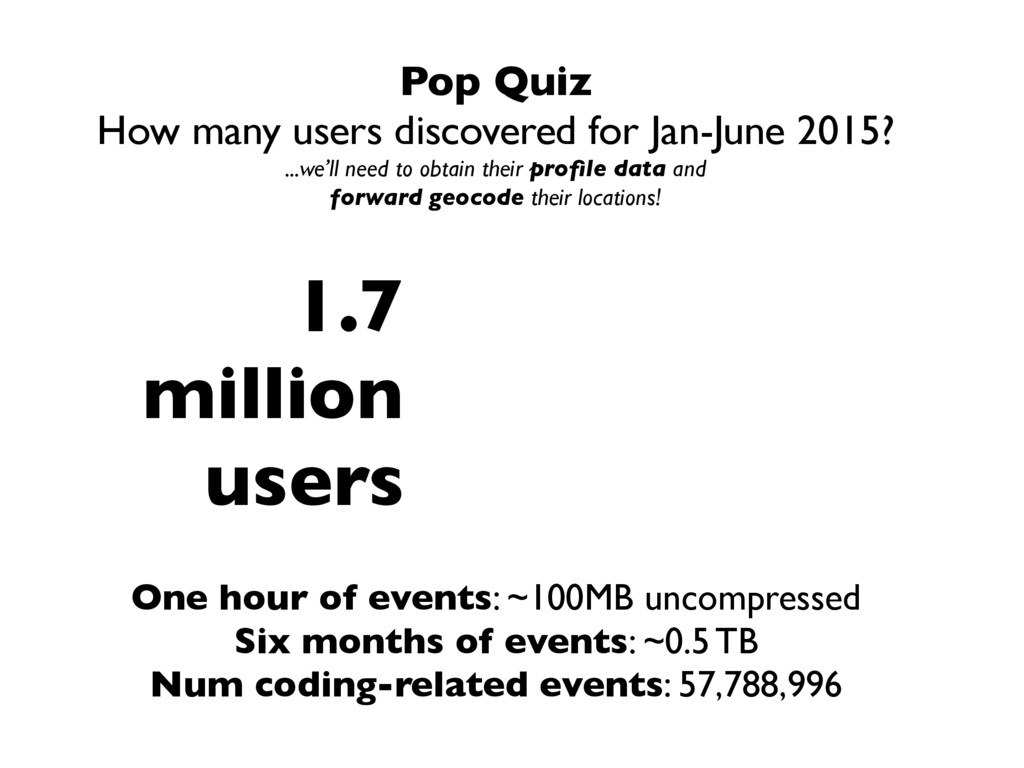
~0.5 TB Num coding-related events: 57,788,996 Pop Quiz How many users discovered for Jan-June 2015? ...we’ll need to obtain their profile data and forward geocode their locations! 1.7 million users
~0.5 TB Num coding-related events: 57,788,996 Pop Quiz How many users discovered for Jan-June 2015? ...we’ll need to obtain their profile data and forward geocode their locations! 1.7 million users
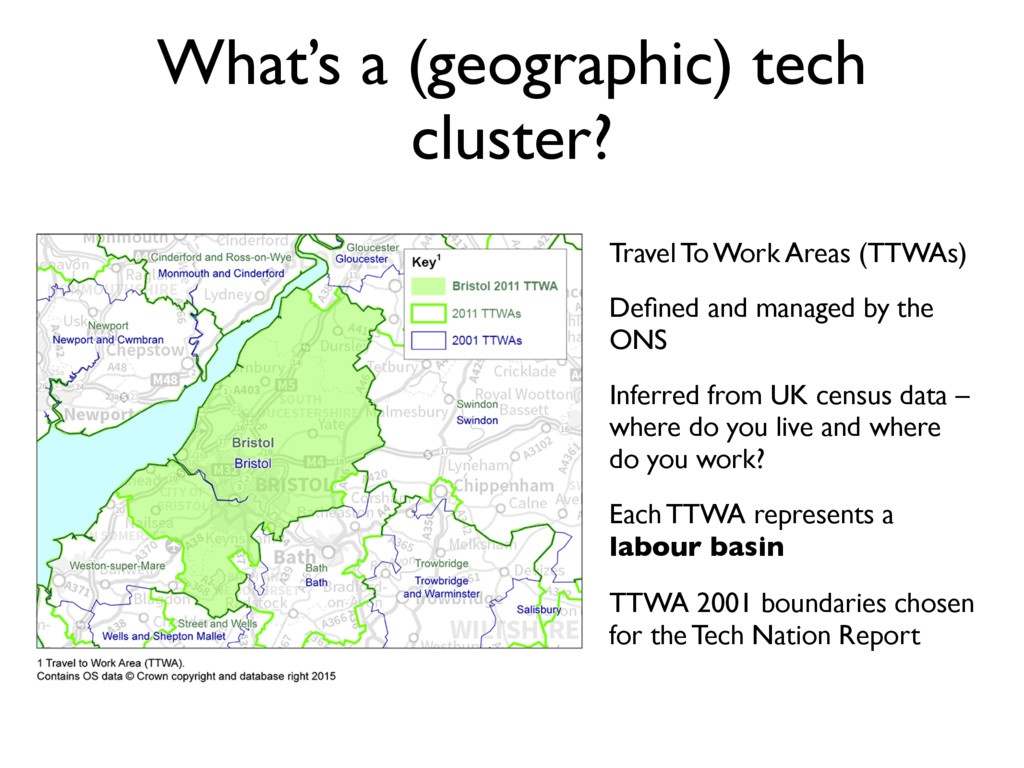
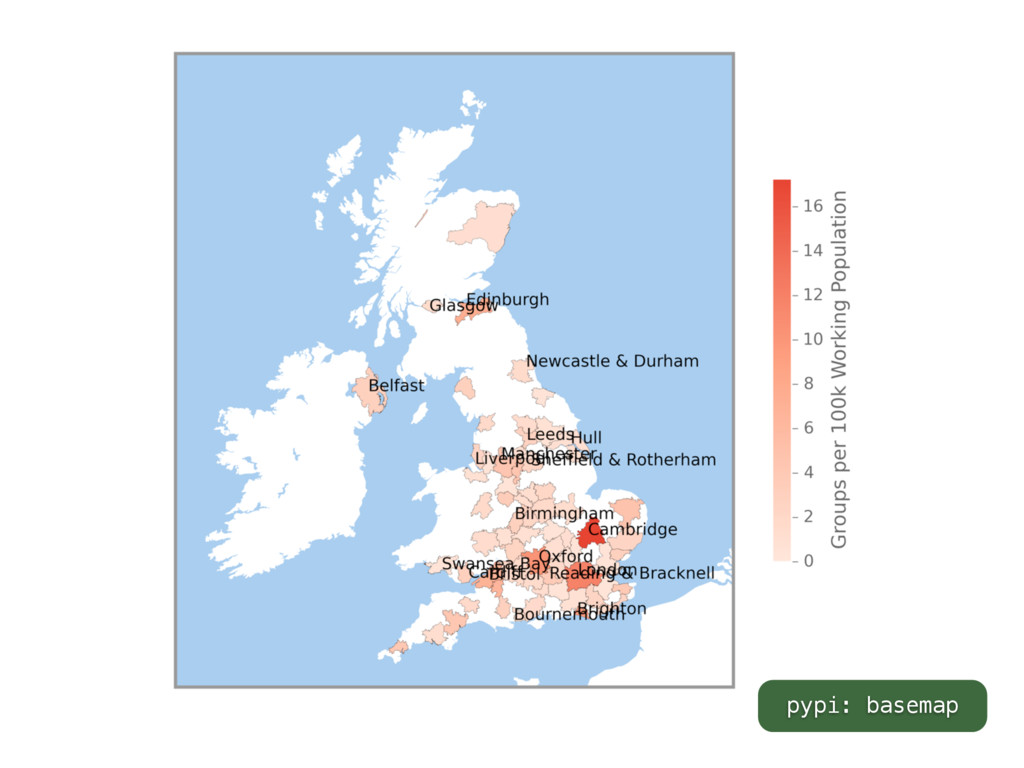
Defined and managed by the ONS Inferred from UK census data – where do you live and where do you work? Each TTWA represents a labour basin TTWA 2001 boundaries chosen for the Tech Nation Report
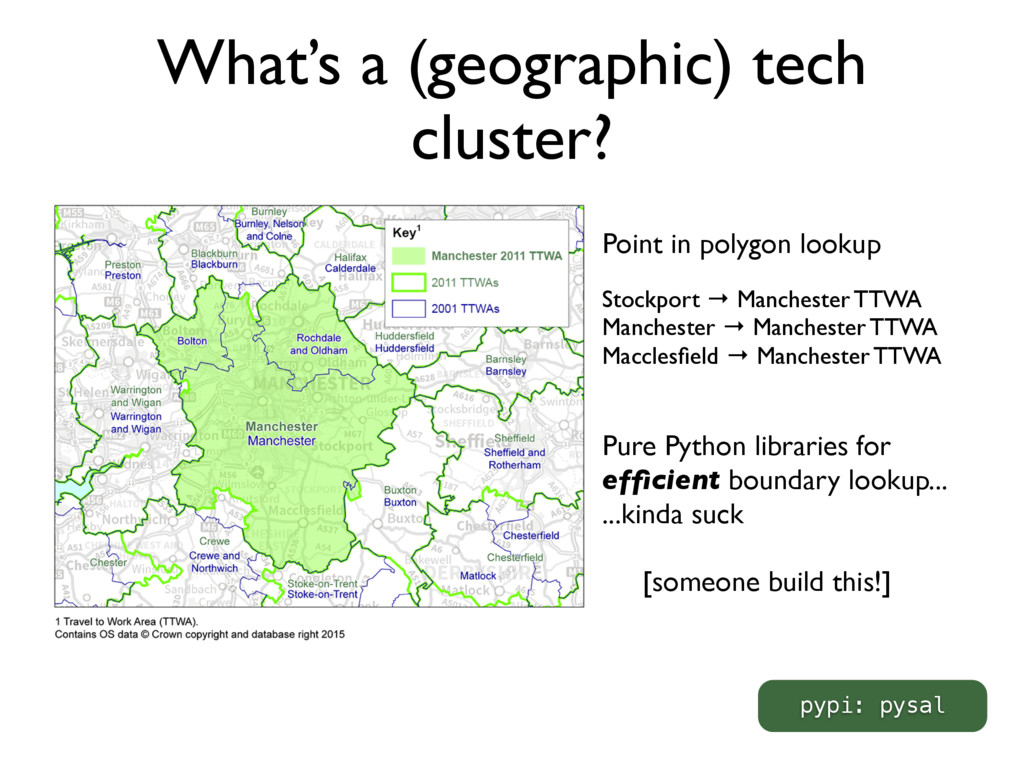
→ Manchester TTWA Manchester → Manchester TTWA Macclesfield → Manchester TTWA Pure Python libraries for efficient boundary lookup... ...kinda suck [someone build this!] pypi: pysal
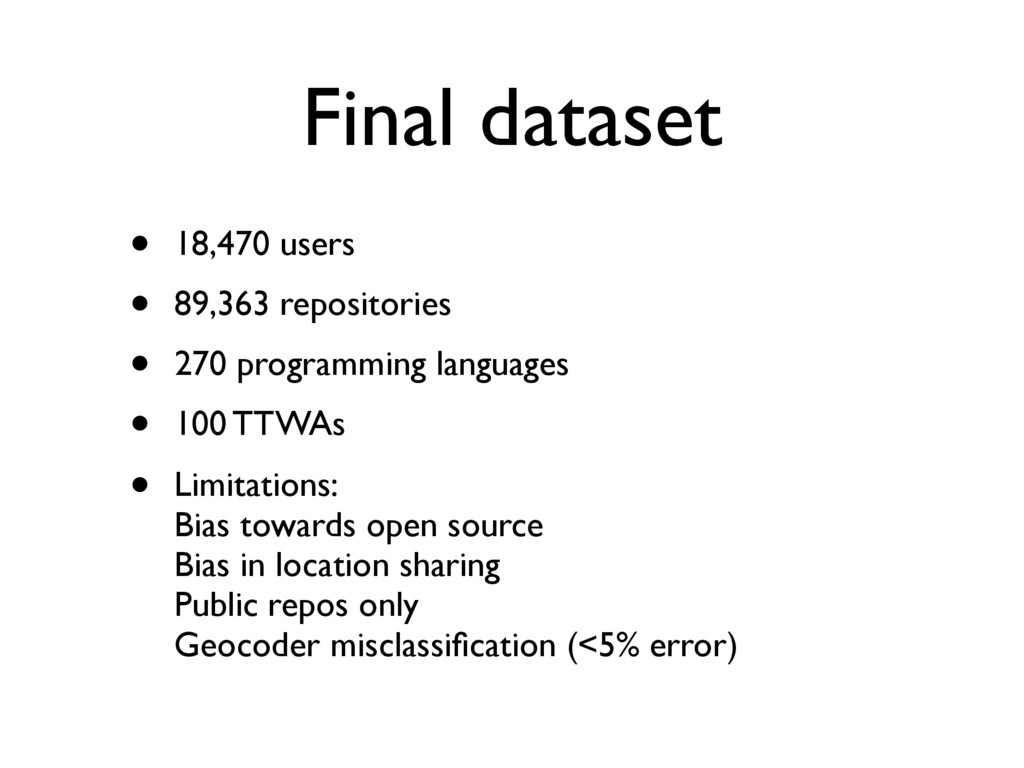
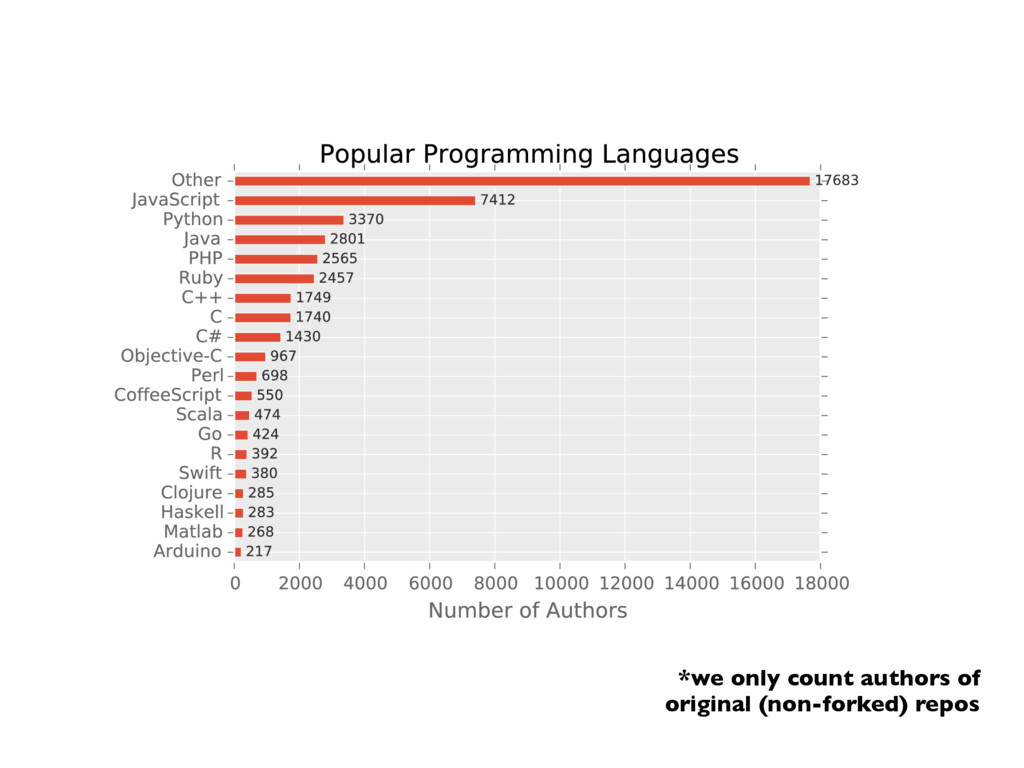
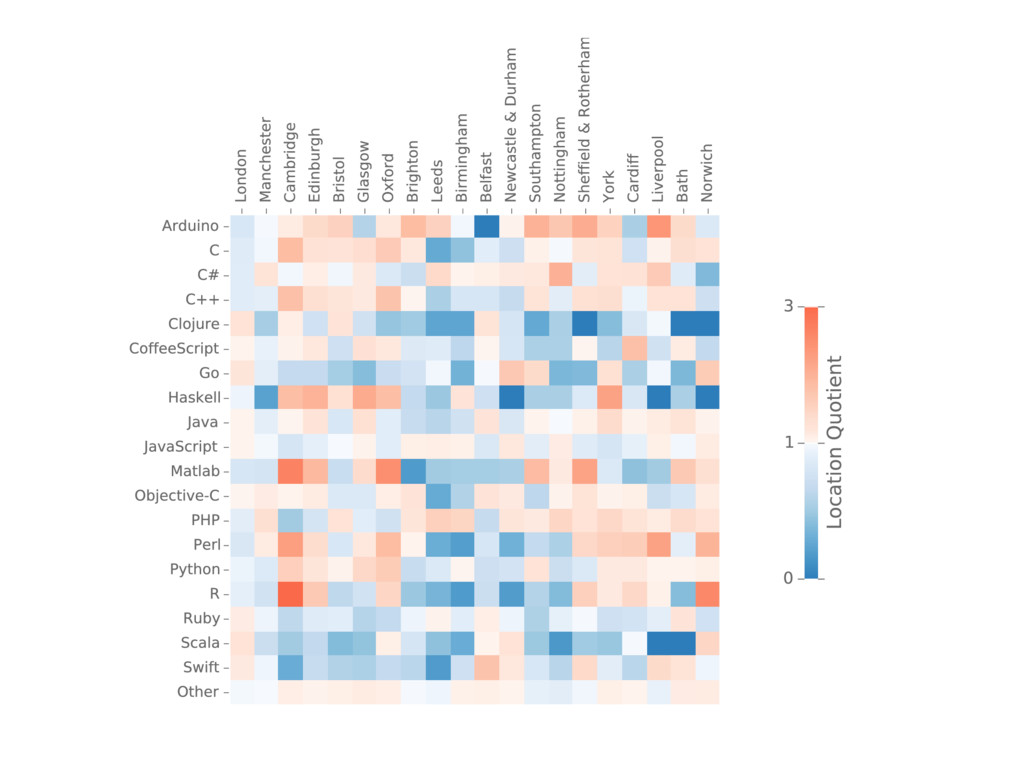
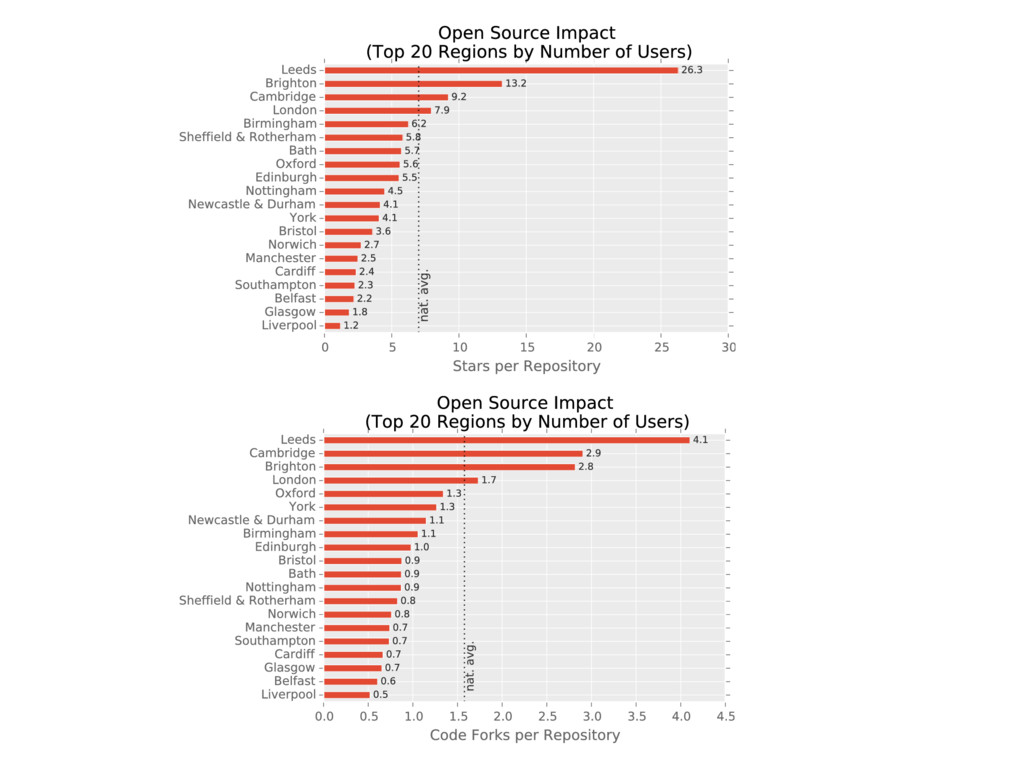
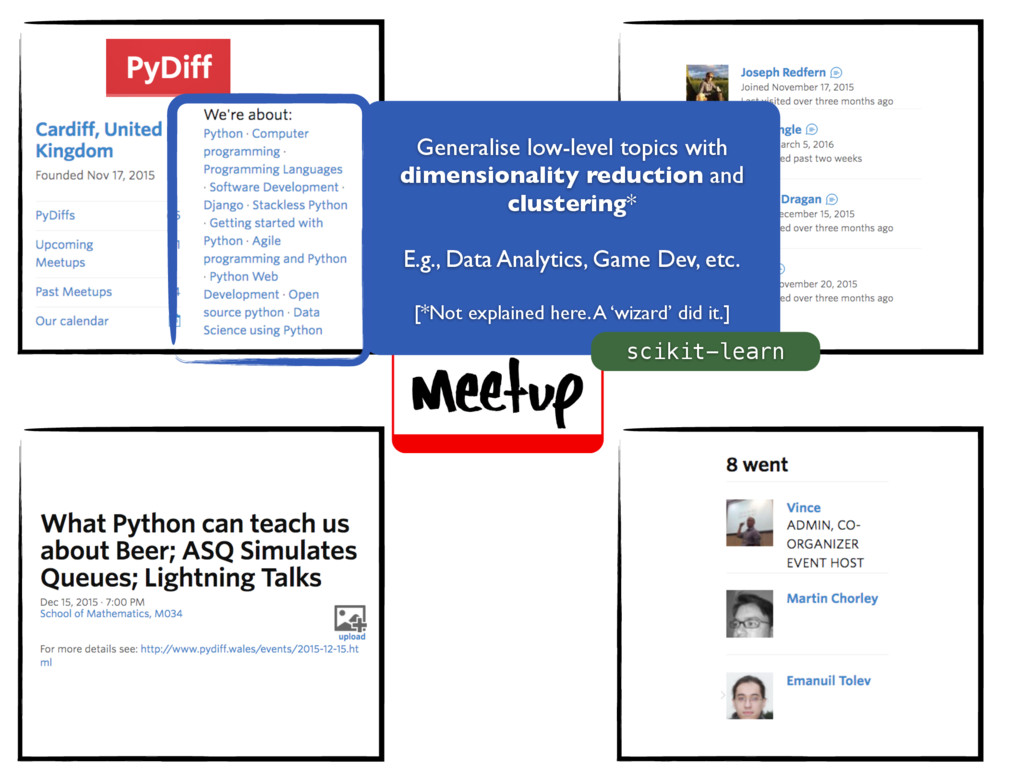
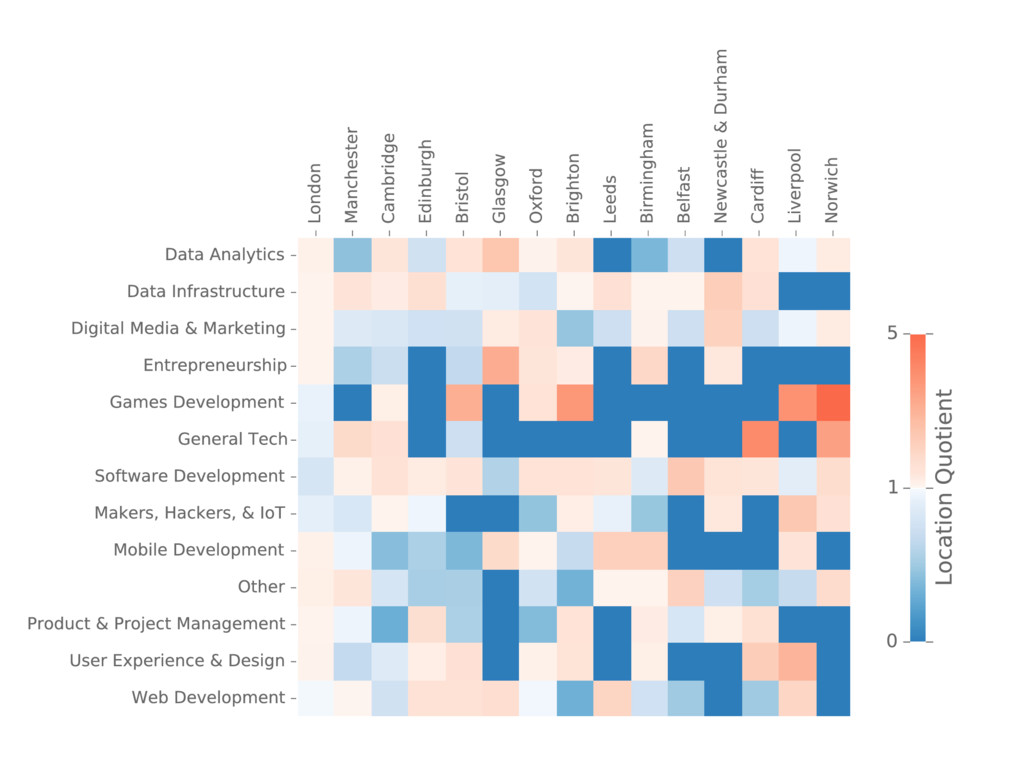
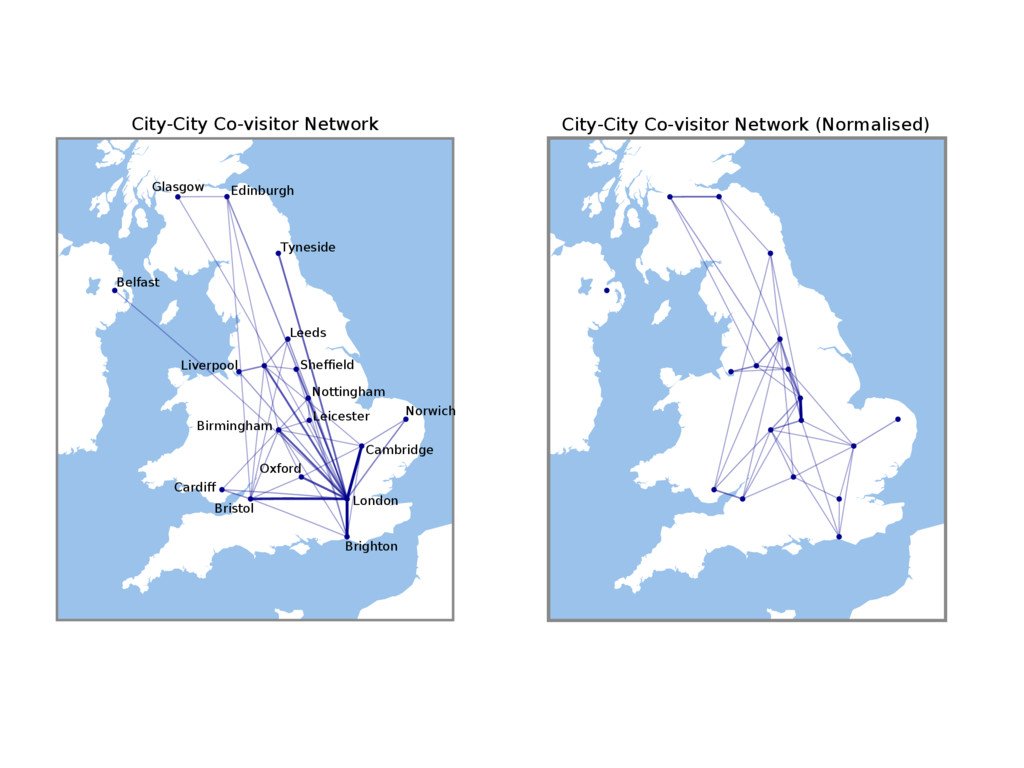
programming languages • 100 TTWAs • Limitations: Bias towards open source Bias in location sharing Public repos only Geocoder misclassification (<5% error)
of tech hubs? [see Tech Nation report!] lots of untapped potential (but also lots of effort to collect data!) example of full pipeline: collection to analysis
of tech hubs? [see Tech Nation report!] python is awesome for both data collection and analysis lots of untapped potential (but also lots of effort to collect data!) example of full pipeline: collection to analysis
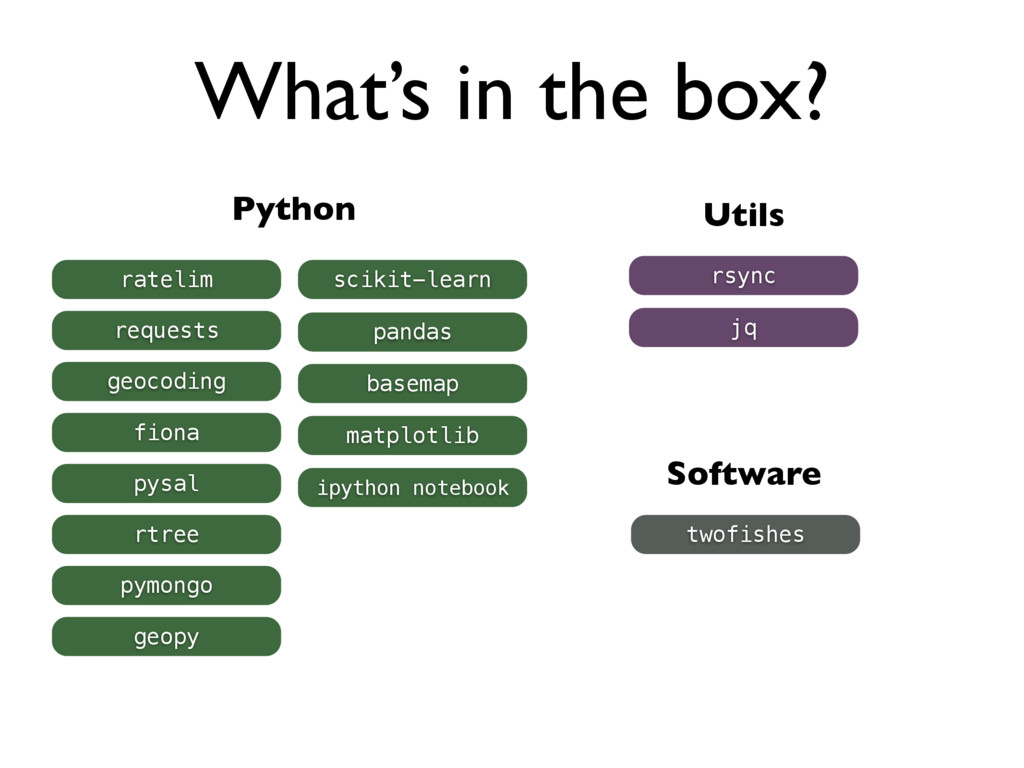
of tech hubs? [see Tech Nation report!] pointers for relevant Python packages python is awesome for both data collection and analysis lots of untapped potential (but also lots of effort to collect data!) example of full pipeline: collection to analysis
of tech hubs? [see Tech Nation report!] pointers for relevant Python packages python is awesome for both data collection and analysis Vince needs to set his Github location field lots of untapped potential (but also lots of effort to collect data!) example of full pipeline: collection to analysis