Upgrade to Pro — share decks privately, control downloads, hide ads and more …

Malofiej 23 - Show Don't Tell Workshop

Geoff McGhee
March 17, 2015
67

Malofiej 23 - Show Don't Tell Workshop

Geoff McGhee

March 17, 2015
Tweet

Transcript

  1. From Hide and Seek to Scrollitelling The Past, Present and

    Future Of Interactive Graphics Geoff McGhee Show, Don’t Tell – Malofiej 23 March 17, 2015 [email protected] @mcgeoff Title of Section Headline of Graphic Menu to more graphics... Navigation menu Item Two Another Item Title of Section Headline of Graphic Menu to more graphics... 1 2 3 4 2. Headline of Description Lorem ipsum dolor sit amet, consectetur adipiscing elit. Nulla dapibus cursus leo, et facilisis ante hendrerit et. Aliquam nunc mauris, ultricies eu dapibus sed, suscipit eget quam. Proin cursus molestie dictum. Nam lorem erat, eleifend ut convallis nec, dapibus nec mauris. NEXT »
  2. Screens Were Smaller ! • Excitement of “interactive” graphics and

    multimedia • But what constituted interactivity back then? And Newspapers Were Bigger BACK IN THE DAY – THE EARLY 2000S
  3. Tyranny of the 640x480 Screen Below the Scroll? There Be

    Dragons How did we navigate pages that didn’t fit in the screen? BACK IN THE DAY – THE EARLY 2000S
  4. From Print to Web “Slicing and Dicing” to Fit a

    Small, Standard Format Techniques • As long as user has to click anyway… • Create internal navigation for graphic • Everything must fit in viewable area BACK IN THE DAY – THE EARLY 2000S
  5. From Print to Web Techniques • Stacked nav on side,

    or a “stepper” • Overlaying with clickable numbers • Splitting into multiple panes or tabs “Slicing and Dicing” to Fit a Small, Standard Format Title of Section Headline of Graphic Menu to more graphics... Menu to more graphics... Navigation menu Item Two Another Item Title of Section Headline of Graphic Menu to more graphics... Title of Section Headline of Graphic Navigation menu Item Two Another Item TAB ONE TAB TWO TAB THREE 1 2 3 4 2. Headline of Description Lorem ipsum dolor sit amet, consectetur adipiscing elit. Nulla dapibus cursus leo, et facilisis ante hendrerit et. Aliquam nunc mauris, ultricies eu dapibus sed, suscipit eget quam. Proin cursus molestie dictum. Nam lorem erat, eleifend ut convallis nec, dapibus nec mauris. NEXT » 600px 400px BACK IN THE DAY – THE EARLY 2000S
  6. Lorem ipsum dolor sit amet, consectetur adipiscing elit. Etiam pulvinar,

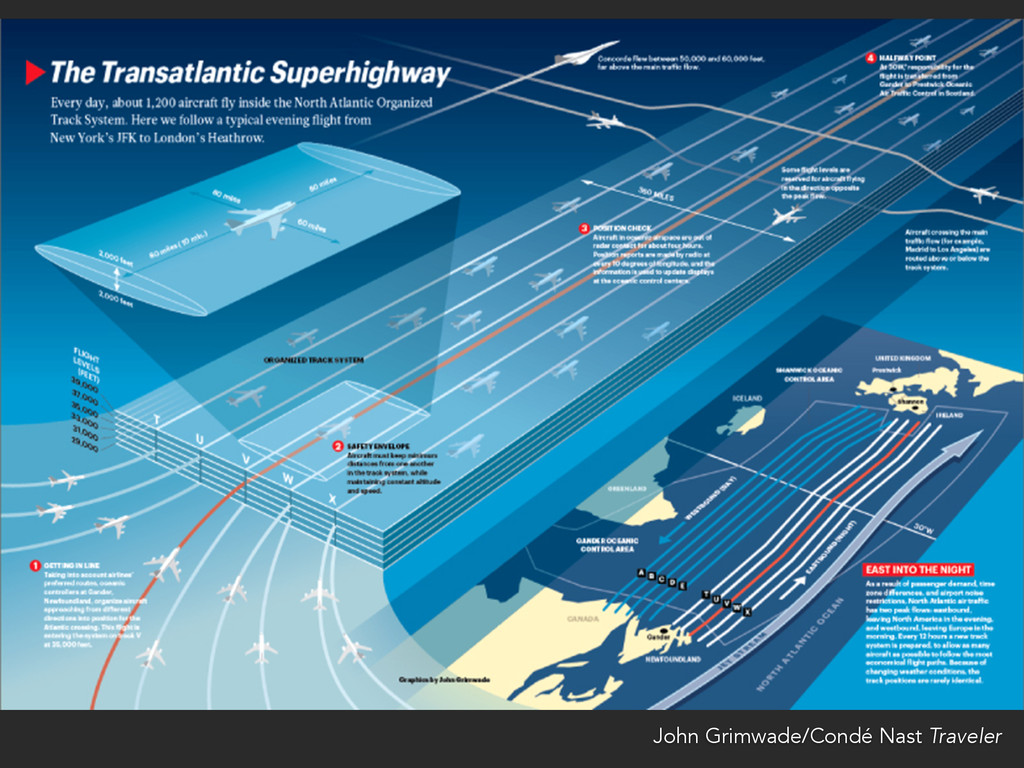
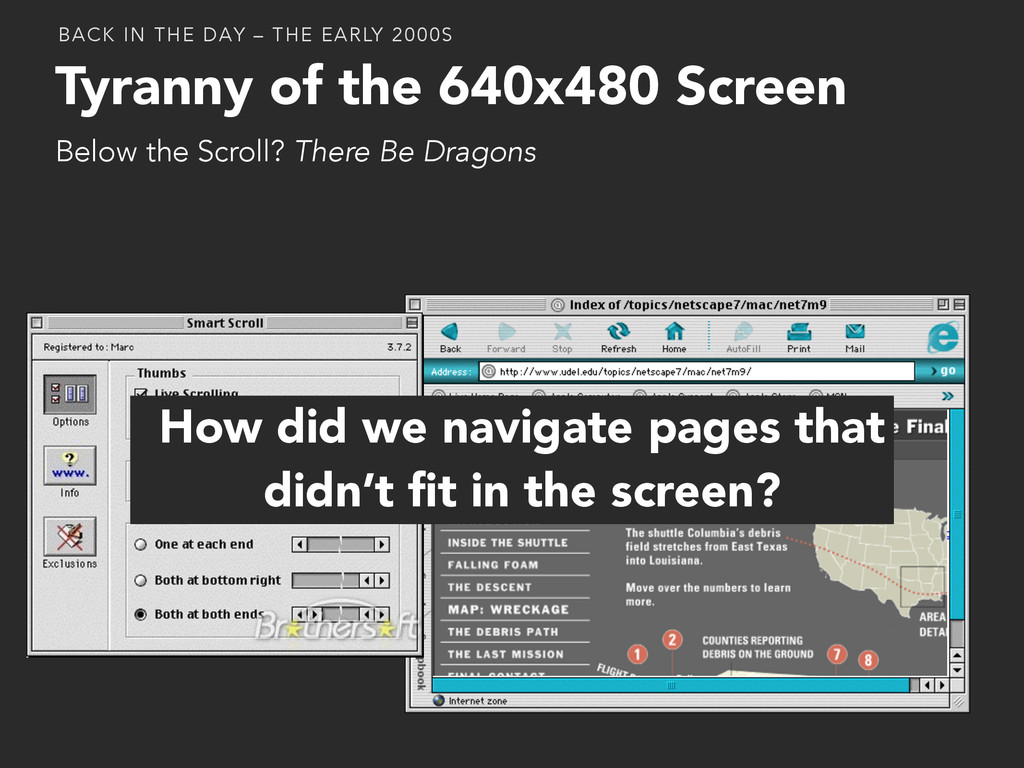
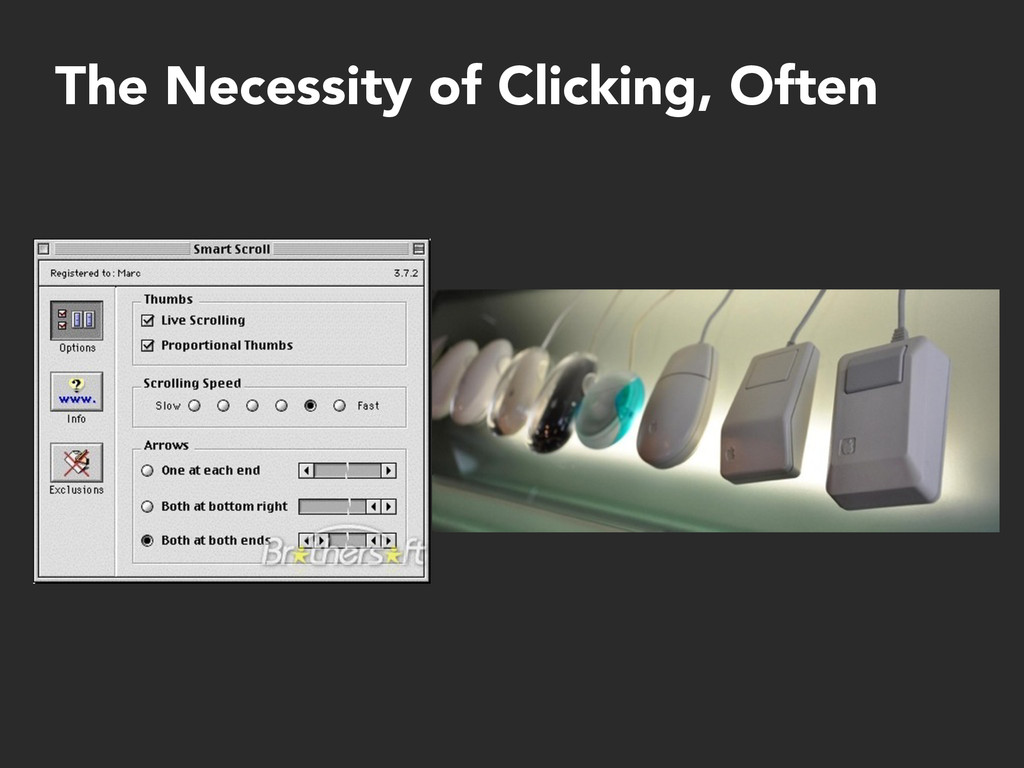
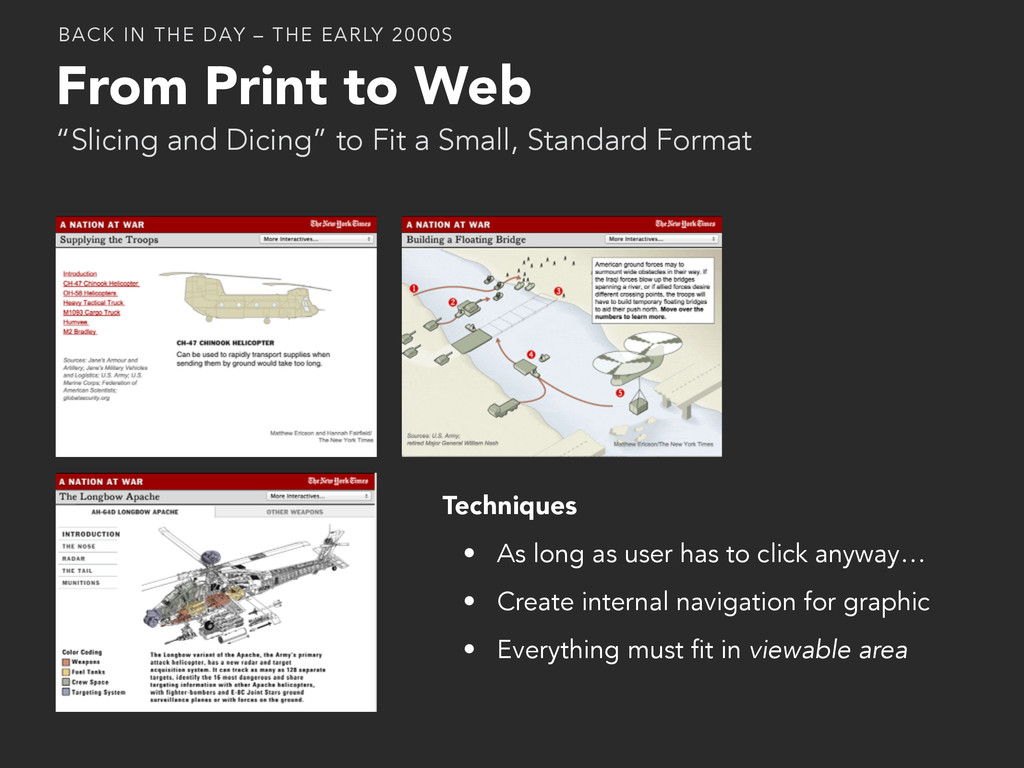
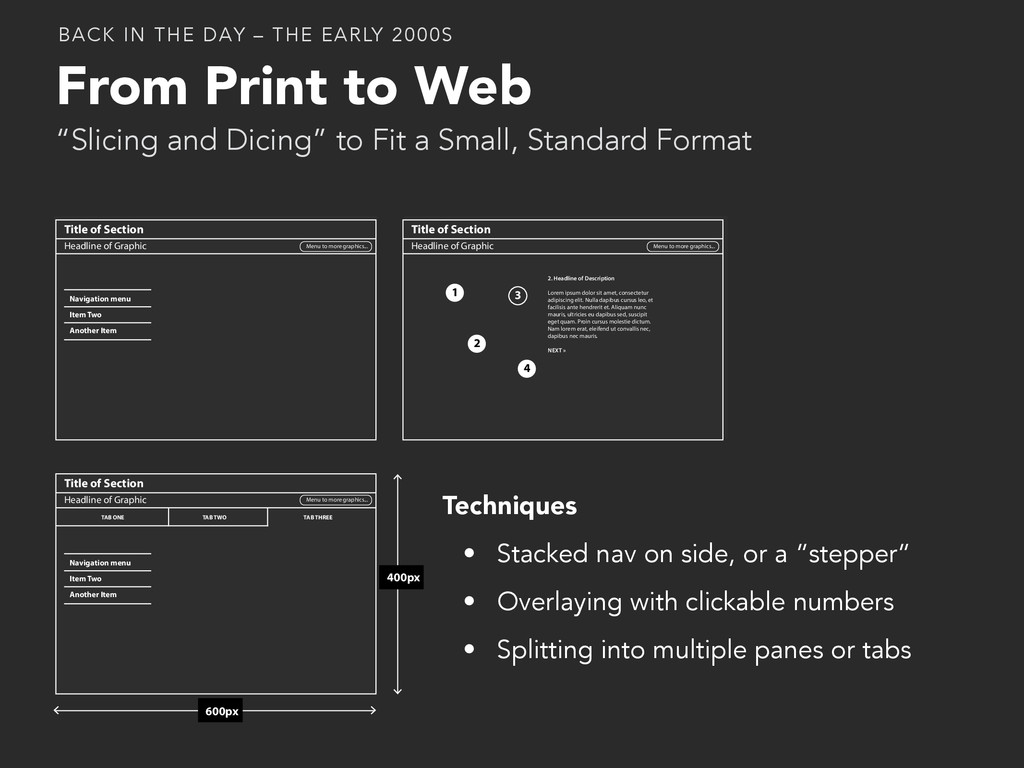
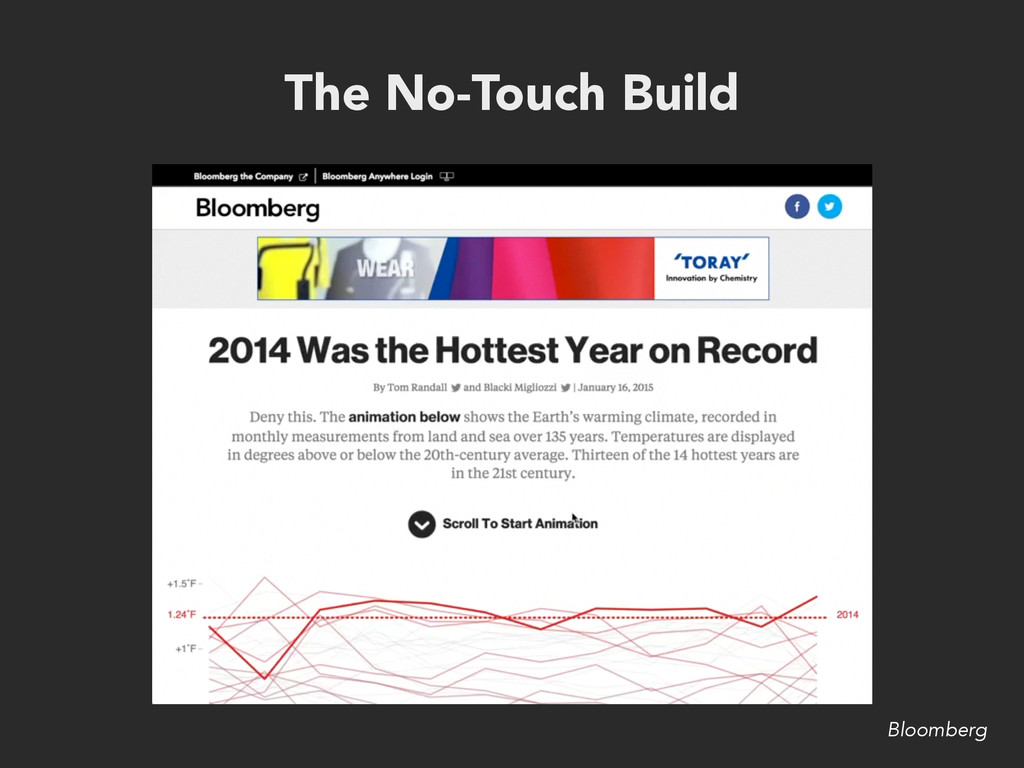
    mauris sit amet interdum feugiat, nibh eros elementum turpis, ut lobortis lorem neque nec dui. Fusce convallis ipsum vitae nunc sodales pharetra. Aliquam ac ipsum quam. Phasellus imperdiet, purus facilisis egestas porta, libero augue sagittis magna, in feugiat felis nibh sit amet leo. Sed malesuada scelerisque adipiscing. Nulla semper erat eu dui posuere vestibulum. Fusce egestas felis mauris. Donec rhoncus, turpis eu blandit mollis, mi erat semper turpis, vel commodo tortor mi sed nulla. Quisque euismod blandit ante eget posuere. Nulla at massa id est pulvinar sodales. Class aptent taciti sociosqu ad litora torquent per conubia nostra, per inceptos himenaeos. Suspendisse hendrerit elit eget eros dignissim id ullamcorp- er enim dictum. Pellentesque ultricies nisi in arcu lacinia convallis. Ut sollicitudin mollis elit, nec ornare leo convallis quis. Duis scelerisque purus ac dui aliquam facilisis. Sed sed metus vitae quam faucibus dignissim a in massa. Pellen- tesque vel enim vitae nibh tincidunt vulputate. Morbi sagittis hendrerit ultrices. Lorem ipsum dolor sit amet, consectetur adipiscing elit. Nulla dapibus cursus leo, et facilisis ante hendrerit et. Aliquam nunc mauris, ultricies eu dapibus sed, suscipit eget quam. Proin cursus molestie dictum. Nam lorem erat, eleif- end ut convallis nec, dapibus nec mauris. Maecenas fermen- tum ultrices neque a pretium. Ut sollicitudin, nisi et tristique semper, mauris turpis posuere sapien, ac porta nibh mi et enim. Ut suscipit orci ut nisl mattis tempor. Curabitur vestib- ulum aliquam purus eget venenatis. Phasellus scelerisque, tellus id rutrum vehicula, sapien enim dictum massa, sit amet pharetra nibh lorem sed ante. Morbi et nunc vel magna dictum semper eu at justo. Proin faucibus, ligula nec venenatis dapibus, risus lorem suscipit magna, non sagittis sem ligula ut tortor. Praesent porttitor dictum justo quis iaculis. Phasellus nulla diam, luctus ornare vestibulum id, rutrum et lectus. Donec eget massa eu justo Headline of Article Morbi hendrerit rutrum massa vel suscipit. Aliquam hendrerit facilisis arcu nec malesuada. Nulla sed auctor libero. Maecenas non quam ac enim tempor commodo. Nullam magna leo, pretium sed AD AD AD AD “Slicing and Dicing” to Fit a Small, Standard Format From Print to Web Title of Section Headline of Graphic Menu to more graphics... Menu to more graphics... Navigation menu Item Two Another Item Title of Section Headline of Graphic Menu to more graphics... Title of Section Headline of Graphic Navigation menu Item Two Another Item TAB ONE TAB TWO TAB THREE 1 2 3 4 2. Headline of Description Lorem ipsum dolor sit amet, consectetur adipiscing elit. Nulla dapibus cursus leo, et facilisis ante hendrerit et. Aliquam nunc mauris, ultricies eu dapibus sed, suscipit eget quam. Proin cursus molestie dictum. Nam lorem erat, eleifend ut convallis nec, dapibus nec mauris. NEXT » 600px 400px Fixed-size “Popup” windows float above article page BACK IN THE DAY – THE EARLY 2000S
  7. The Stepper: Revealing the Path • Numbered buttons (or mute

    bullet symbols) make it easy to advance, or select story points at random • Compact – don’t occupy much space • But what does “2” mean? • Buries material: what happens when you update content in “3”? • Buttons come at a cost: when presentation stops, some users leave rather than clicking a “next” button • Also, too much…
 As Easy as – But There Are Limitations 1 2 3
  8. Fast Forward to the Present • PC screen sizes increase

    • Smartphones and tablets appear • Mobile devices bring Hi DPI “retina” screens… increasingly finding their way to PCs • Embedded fonts mean better type options • “Interactivity” not always necessary or on offer, especially for hard news/breaking news • Cross-device “responsive design” has sapped resources for adding interactivity Digital Experience is More Print-Like
  9. Fast Forward to the Present • PC screen sizes increase

    • Smartphones and tablets appear • Mobile devices bring Hi DPI “retina” screens… increasingly finding their way to PCs • Embedded fonts mean better type options • “Interactivity” not always necessary or on offer, especially for hard news/breaking news • Cross-device “responsive design” has sapped resources for adding interactivity Digital Experience is More Print-Like
  10. What is Interactivity For? • Query individual details or data

    points • Zoom in/out for detail and context • Filter, sort and search • Direct manipulation – rotate, drag, flip • Other types of user input • Explore alternate views Forms of Interaction that Enrich Online Graphics • Sequential navigation…
  11. What is Interactivity For? • Inspired by touch devices, manipulating

    content on screens has become much easier – better than a joystick! Forms of Interaction that Enrich Online Graphics • Sequential navigation…
  12. Scroll or Swipe-Based Interaction Infographics Where You Never Get Lost

    • Scrolling is the one behavior that exists across all devices, whether it’s a mouse-wheel, swipe on a trackpad, magic mouse, tablet surface or smartphone screen • It has little or no visual interface that needs to be directly manipulated (in fact, Mac OS 10.7 virtually banished the scroll bar) • Action of “scrolling” is co-opted to trigger other reactions than down movement - cuing a video, rotating, flipping through images, whatever!
  13. +

  14. “Scrollitelling” • Restores integration of infographics, photos and text we

    enjoyed in print media – but had lost online • Page scripting enables behaviors to trigger as user passes through page • Triggers can be used to call attention to content that user might have otherwise missed • Scrolling can be loosely or closely tied to interactions • Behavior can be natural or … disorienting Touch-Aided Vertical Content Navigation – With Triggered Events
  15. “Scrollitelling” • Restores integration of infographics, photos and text we

    enjoyed in print media – but had lost online • Page scripting enables behaviors to trigger as user passes through page • Triggers can be used to call attention to content that user might have otherwise missed • Scrolling can be loosely or closely tied to interactions • Behavior can be natural or … disorienting Touch-Aided Vertical Content Navigation – With Triggered Events ! • Scrolling can work both backward and forward – enabling a sort of “scrubbing” behavior
  16. Scrolling Formats • Based on “parallax” scrolling, where items can

    move at different speeds • Some items can remain onscreen longer than others, move faster or slower, even change direction • Script: JQuery scrollspy
 http://davidwalsh.name/js/scrollspy • Behaviors designed to trigger at exact scroll depths, either heading down, or up, or both • Waypoints are like trip-wires • Script: JQuery Waypoints, Skrollr.js
 http://imakewebthings.com/ waypoints/
 http://prinzhorn.github.io/skrollr/ Based on Ratios or “Waypoints” Scrolling by Ratio Scrolling by Waypoints
  17. Scrolling Formats Based on Ratios or “Waypoints” Scrolling by Ratio

    Scrolling by Waypoints Browser viewport Page Background
  18. Wait, Was that Video in “Cosmic Questions?” No. But I

    dream of the day we can scrub video by scrolling.
  19. Does Scrollitelling Work for Standalone Graphics? Or is scrolling mostly

    for long reads with multimedia sprinkled around?
  20. “How to Scroll” Some of NYTimes Graphics Editor Mike Bostock’s

    Suggestions Prefer Scrolling to Clicking “Scrolling’s ubiquity makes it almost effortless, as you need not consciously coordinate your hand and eye as you scan. In contrast, clicking on a tab or stepper is a comparatively complex action that requires greater deliberation. Making content visible by scrolling is almost always better than hiding it behind a click.” bost.ocks.org/mike/scroll
  21. “How to Scroll” Allow rapid, incremental, reversible scrolling “How should

    we isolate an individual graphic or video to present it dramatically, rather than awkwardly cropped and cluttered by the arbitrary viewport? There are two schools of thought here. The first is to constrain scrolling to fixed positions at content boundaries. The second is to leave scrolling as-is and instead adapt the content to the viewport. The first approach fundamentally alters the experience of scrolling. I am a strong proponent of the second approach… It preserves direct manipulation whereas the first approach feels indirect and detached; I would rather scroll the page myself than hand-wave a butler to advance the page on my behalf” Some of NYTimes Graphics Editor Mike Bostock’s Suggestions
  22. “How to Scroll” Provide instantaneous, consistent feedback “Scrolling should provide

    instantaneous visual feedback in response to user input; when you scroll using the mouse, touch, or keyboard, you should instantly see the display respond. This feedback is an essential component of direct manipulation and lets you rapidly adjust your input to scroll the desired distance and velocity.” Some of NYTimes Graphics Editor Mike Bostock’s Suggestions
  23. “Scrolljacking” “As readers, we have strong expectations on how scrolling

    should behave. As designers, we may yet change scrolling behavior, but too much change risks confusing or frustrating readers — the phenomenon of scrolljacking.”
  24. “Scrolljacking” “As readers, we have strong expectations on how scrolling

    should behave. As designers, we may yet change scrolling behavior, but too much change risks confusing or frustrating readers — the phenomenon of scrolljacking.”
  25. “How to Scroll” Avoid unwanted disruptions ”Use caution playing animations

    or video as soon as the elements scroll into view, particularly with audio; even though the elements are visible, the reader may not yet have finished reading preceding text. Surprises are likely to distract the reader’s eye and interrupt reading, and repeated disruptions can frustrate readers.” Some of NYTimes Graphics Editor Mike Bostock’s Suggestions
  26. Repeating instances of zoomable maps creates headaches– map zoom level

    and center point have to match Lessons Learned from Scrolling waterinthewest.stanford.edu/groundwater
  27. Lessons Learned from Scrolling Interactive graphics can get buried in

    a long article page; having a standalone version is important.
  28. Using scrolling to reveal complex texts may not work so

    well Lessons Learned from Scrolling
  29. The Advent of 3D Web Graphics • 3D infographics are

    still a big challenge to create • But they are growing in number, whether made by news organizations or by firms working doing big-budget productions • Not everything is better in 3D, especially data visualizations • Authoring 3D requires browser functionalities that have not been so common in infographics… so far. Browser Support is Spotty But Growing
  30. Getting to Know Canvas and WebGL • Understanding how 3D

    interactive graphics are created requires going under your browser’s hood and taking a look • Unlike the times not so long ago that we needed Flash or video to do interesting animations, modern HTML5 browsers have several ways of rendering graphical and 3D content: Your in-Browser Photoshop and a Bleeding-Edge Feature 2D VISUALS TRUE 3D FAUX 3D SVG - SCALABLE VECTOR GRAPHICS CANVAS - 2D CONTEXT CANVAS - WEBGL
  31. Getting to Know Canvas and WebGL • A fundamental concept

    of computer graphics is the distinction between vector and raster imagery • Vector graphics are mathematically defined points, lines, curves and polygons; they are also called line art. • Raster graphics are composed of individual pixels arranged in a given resolution. They are also called bitmap or resolution-dependent images. Understanding the Difference Between Vector and Raster Graphics VECTOR RASTER SVG - SCALABLE VECTOR GRAPHICS CANVAS - 2D CONTEXT CANVAS - WEBGL
  32. Getting to Know Canvas and WebGL • Vector and Raster

    formats are distinctions made in other contexts, like desktop design applications, geographic information systems, and print publishing. Understanding the Difference Between Vector and Raster Graphics VECTOR RASTER SVG - SCALABLE VECTOR GRAPHICS CANVAS - 2D AND WEBGL ADOBE ILLUSTRATOR ADOBE PHOTOSHOP EPS FILE TIF FILE LINE DRAWING PHOTOGRAPH GIS FEATURE CLASSES GIS RASTER GEODATA HAM AND CHEESE PEANUT BUTTER AND JELLY HAM AND CHEESE PEANUT BUTTER AND JELLY
  33. Getting to Know Canvas and WebGL Understanding the Difference Between

    Vector and Raster Graphics VECTOR FORMAT DISCRETE FEATURES HAM AND CHEESE PEANUT BUTTER AND JELLY RASTER FORMAT COMINGLED Don’t believe me? Can you take the ham and cheese apart? Or take the peanut butter and jelly apart?
  34. Getting to Know Canvas and WebGL Examples of Vector and

    Raster in GIS VECTOR FORMAT FEATURE DATA RASTER FORMAT GEODATA
  35. Getting to Know Canvas and WebGL SVG and Canvas: The

    Difference • SVG is a file format that is human readable, if verbose, and looks a lot like XML:
 <svg> 
 <line x1="0" y1="0" x2="200" y2="200" 
 stroke-width="1" stroke="rgb(0,0,0)"/> 
 </svg> • You can export SVGs directly from Illustrator, as well as edit them • Usually in interactive data visualizations, D3 or another toolkit will dynamically write SVG code to the page SVG - SCALABLE VECTOR GRAPHICS
  36. Getting to Know Canvas and WebGL SVG are at the

    Heart of Many D3 Visualizations • Drawing lines, polygons and text as vector lines in SVG makes many D3 visualizations extremely light and fast, and enables graceful transitions from state to state
  37. Getting to Know Canvas and WebGL SVG and Canvas: The

    Difference • <Canvas> is an HTML5 tag. Given a width and a height, the browser will create a blank space – a “canvas” of that size for drawing on the web page. • This canvas can only be drawn to by Javascript, so it literally requires programming.
 function init() {
 canvas = document.getElementById('testCanvas');
 context = canvas.getContext("2d");
 context.fillStyle= "yellow";
 context.fillRect(rectX,rectY,rectW,rectW);
 } • Canvas has two modes: 2D and “WebGL” for drawing 3D CANVAS (2D)
  38. Getting to Know Canvas and WebGL SVG and Canvas: The

    Difference • People sometimes describe canvas as a Photoshop built into your browser. You can use Javascript to paint all sorts of lines, rectangles and fills using canvas • You can also load and manipulate images in canvas • With canvas you can also do animations; oddly enough, for some types of animations, canvas is much faster than svg (the vector format) even though the browser usually has to completely redraw the entire image • Your mouse cannot interact directly with shapes in the canvas; instead, javascript passes the x and y of your click to the application, which knows what to do. CANVAS (2D)
  39. Getting to Know Canvas and WebGL SVG and Canvas: The

    Difference • 2D canvas is growing in popularity for web and mobile based games CANVAS (2D) Pirates Love Daisies
  40. When to Use 2D Canvas (Raster) Instead of SVG (Vector)?

    • You have a LOT of points or lines 
 (The performance difference is very noticeable) • Have a lot of frames or need smooth tweens • Want to use photorealistic effects– glowing lines
 or complex, textured fills • You want to simulate 3D movement
  41. Getting to Know Canvas and WebGL Comparing Performance on Complex

    Graphics VECTOR (IN FLASH) • Here’s an example of a vector graphic (ok, in Flash) that has a large number of discrete points – in total, over 150,000. • Note the sluggish response to changes to the date ruralwest.stanford.edu/newspapers
  42. Getting to Know Canvas and WebGL Comparing Performance on Complex

    Graphics RASTER (CANVAS) • This is a typical visualization made with CartoDB’s “Torque” engine for time series maps. • It shows Twitter users tweeting about sunrise around the world. • Note the speed of the animation and the scrubbing update. CartoDB and Twitter
  43. Getting to Know Canvas and WebGL Meet WebGL – Powerful

    But Challenging • Allows the creation of GPU-accelerated 3D animations using the JavaScript language without a plugin like Java, Processing sketch or Flash movie. • Still inconsistently supported by browsers. CANVAS (3D) - THE WEBGL CONTEXT
  44. Getting to Know Canvas and WebGL • Javascript library that

    simplifies drawing to WebGL context. • Easier to grasp for people with familiarity with 3D conventions: The Three.js Javascript Library var camera, scene, renderer, geometry, material, mesh; init(); animate(); function init() { scene = new THREE.Scene(); camera = new THREE.PerspectiveCamera( 75, window.innerWidth / window.innerHeight, 1, 10000 ); camera.position.z = 1000; geometry = new THREE.BoxGeometry( 200, 200, 200 ); material = new THREE.MeshBasicMaterial( { color: 0xff0000, wireframe: true } ); mesh = new THREE.Mesh( geometry, material ); scene.add( mesh ); renderer = new THREE.WebGLRenderer(); renderer.setSize( window.innerWidth, window.innerHeight ); document.body.appendChild( renderer.domElement ); }
  45. Web Maps and Noise Reduction After the thrill wore off

    from discovering “slippy” Google Maps, infographics designers started wondering how to calm down the basemap styles.
  46. Web Maps and Noise Reduction Over the years, various options

    have arisen to help make thematic maps better looking and easier to read – even from Google Maps itself. The above images show the Google Maps API with custom style modifications.
  47. But even with a profusion of basemap options and the

    arrival of the Open Street Maps database, we still haven’t had much control over what features we show – or don’t show – in our maps. Or what they look like. For one thing, this traditionally means generating tens of thousands of raster image tiles at various resolutions.
  48. The Rise of Vector Maps • Mobile users were first

    to enjoy the benefits of vector-based maps in apps like Google and Apple Maps. • These vector maps can be re-styled dynamically, can zoom and scale smoothly, and even allow distortion-free rotating and tilting. • In the past year, vector-based Google Maps made it into web browsers, although not yet into the API for creating custom maps. • Mac users got the vector-based Maps app as well. • What do we need to use vector maps in infographics? • One example shows what the future might hold…
  49. How We Get Vector Maps… • “UrbanLayers” by the New

    York based firm MorpoCode uses D3.js and a new javascript tool for rendering vector maps in the canvas with WebGL – called MapboxGL. • To load a map, WebGL then rasterizes the vector graphics for display. • Mapbox, the creator of MapboxGL, has released a desktop application to let map makers enjoy the benefits of vector maps, Mapbox Studio. It’s Confusing, But It Uses Canvas and Raster Display