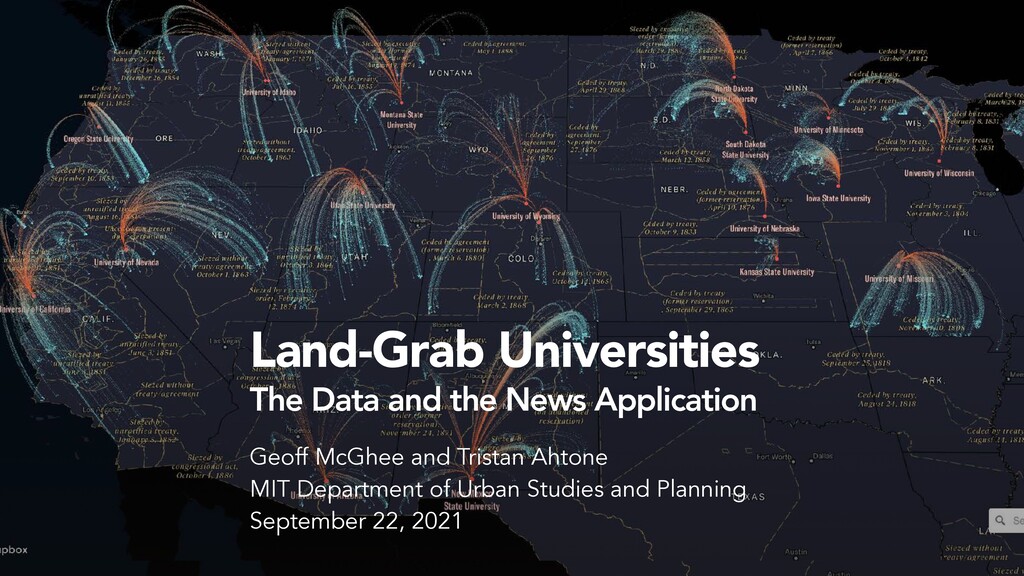
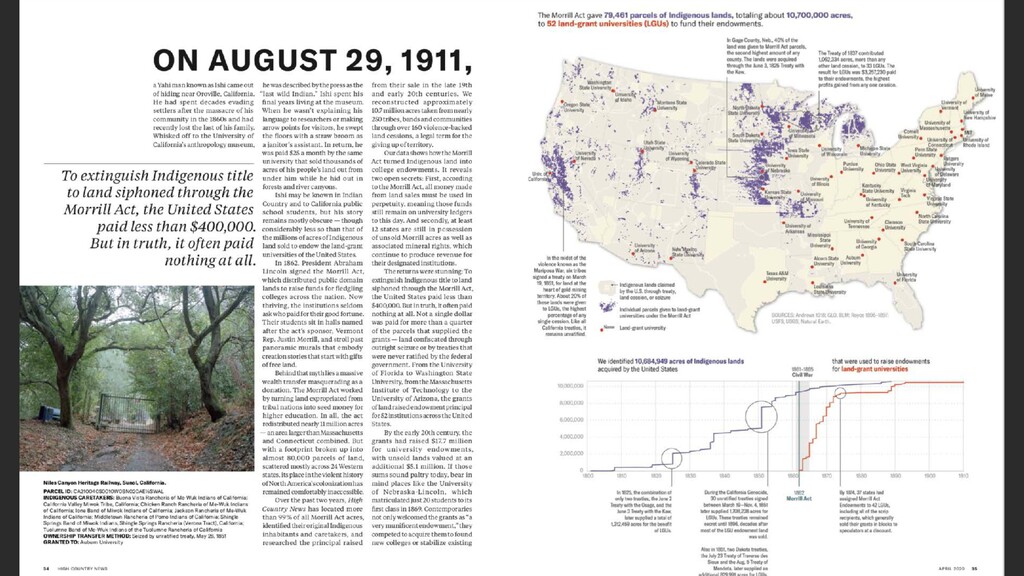
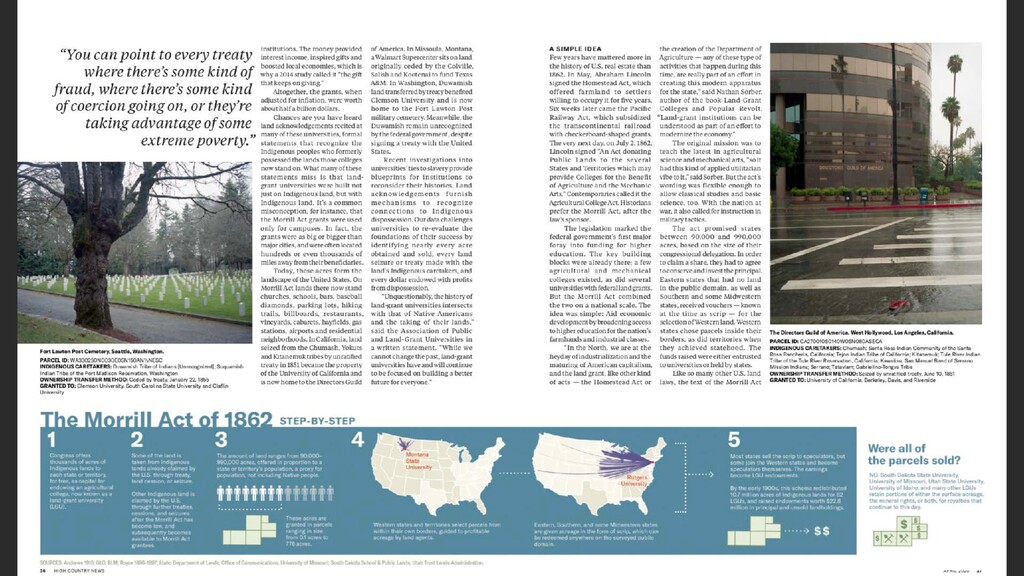
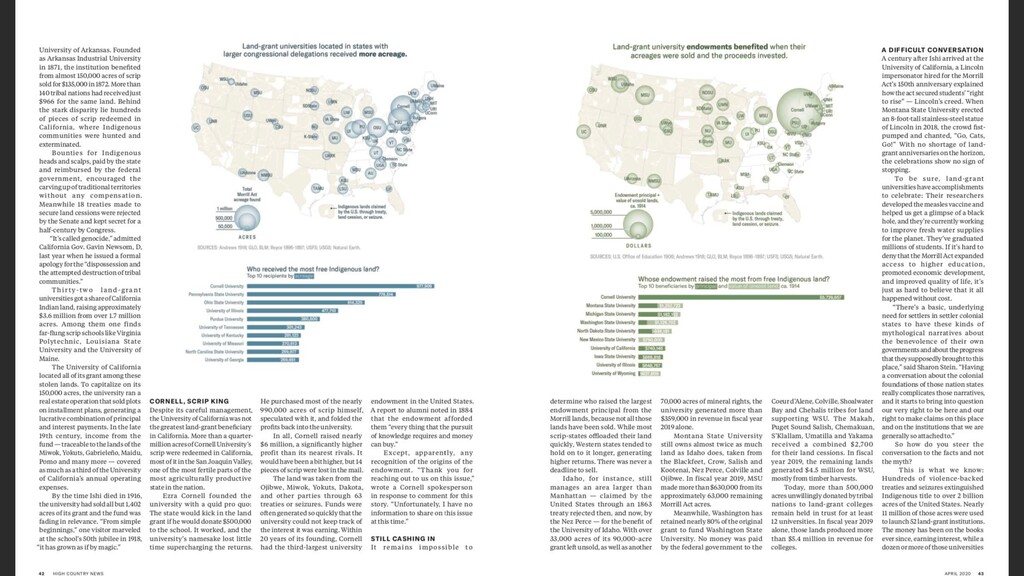
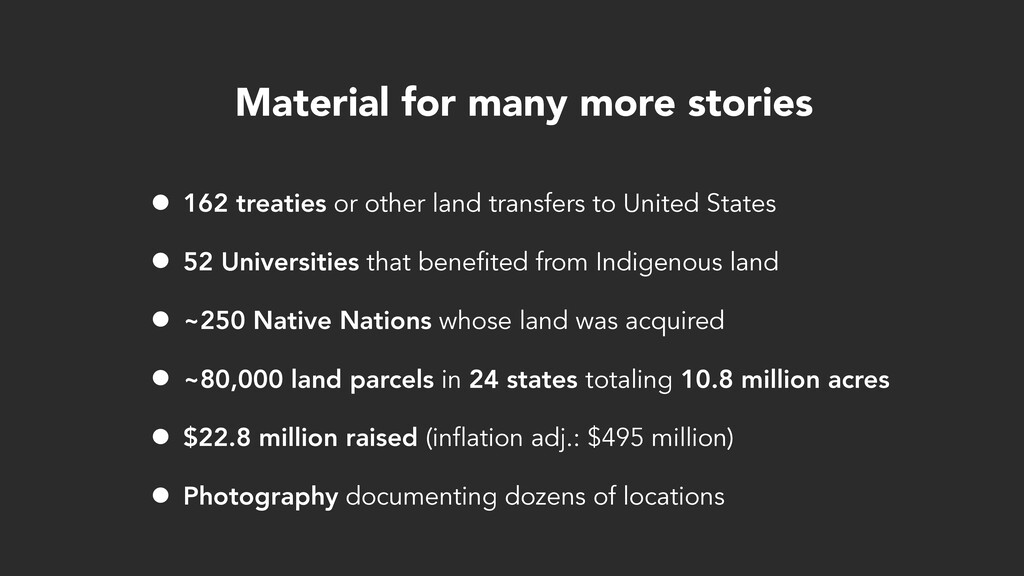
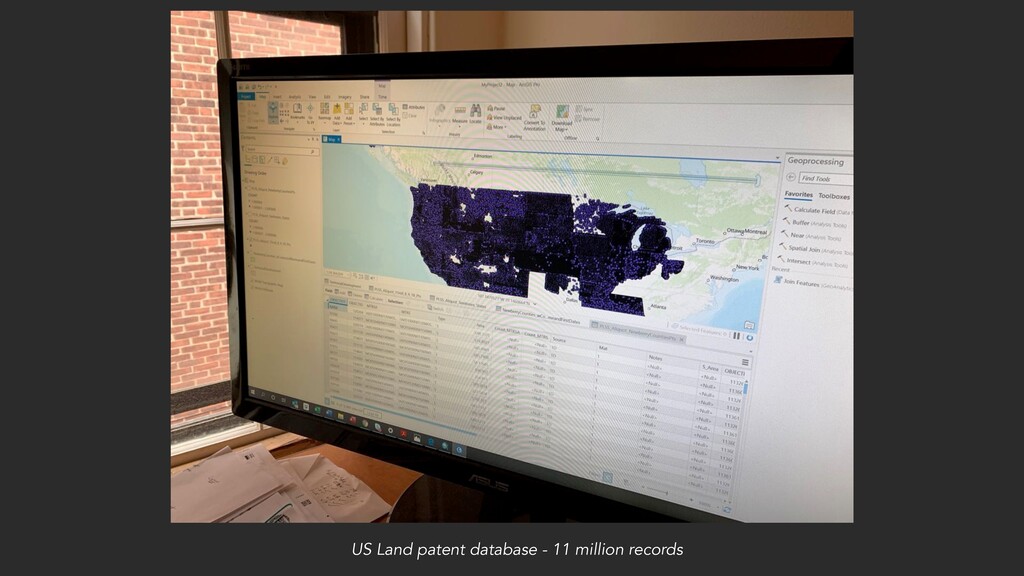
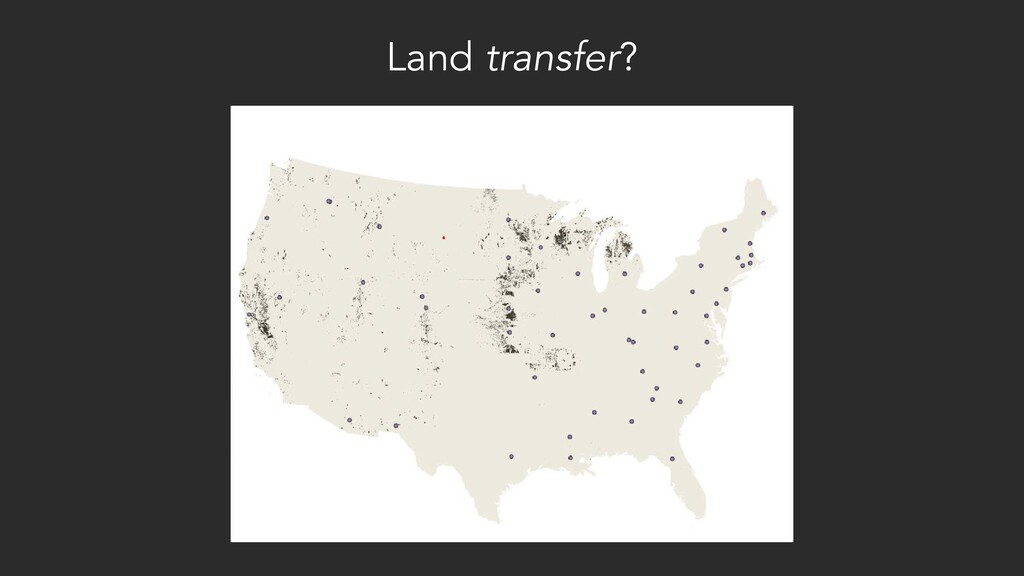
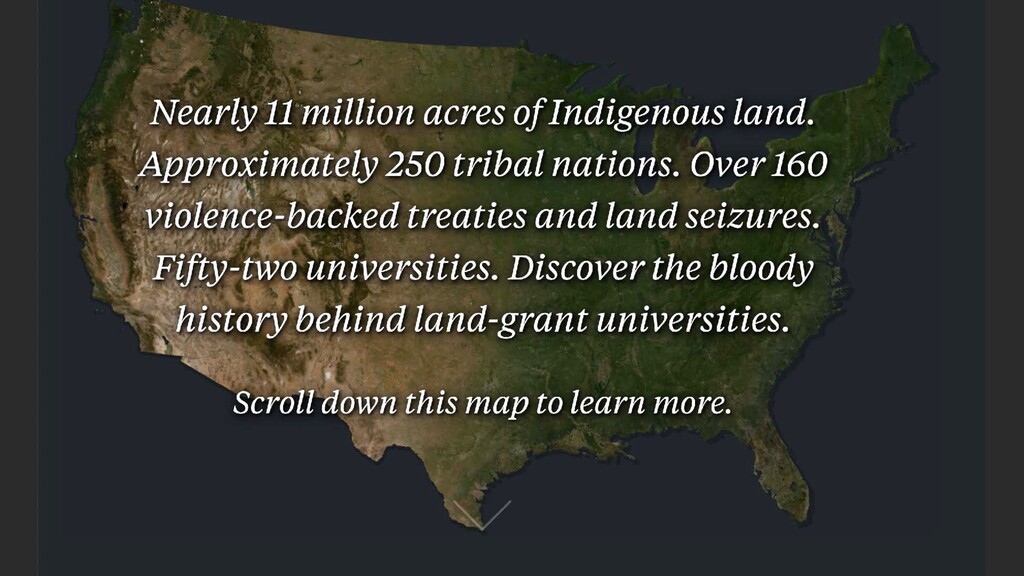
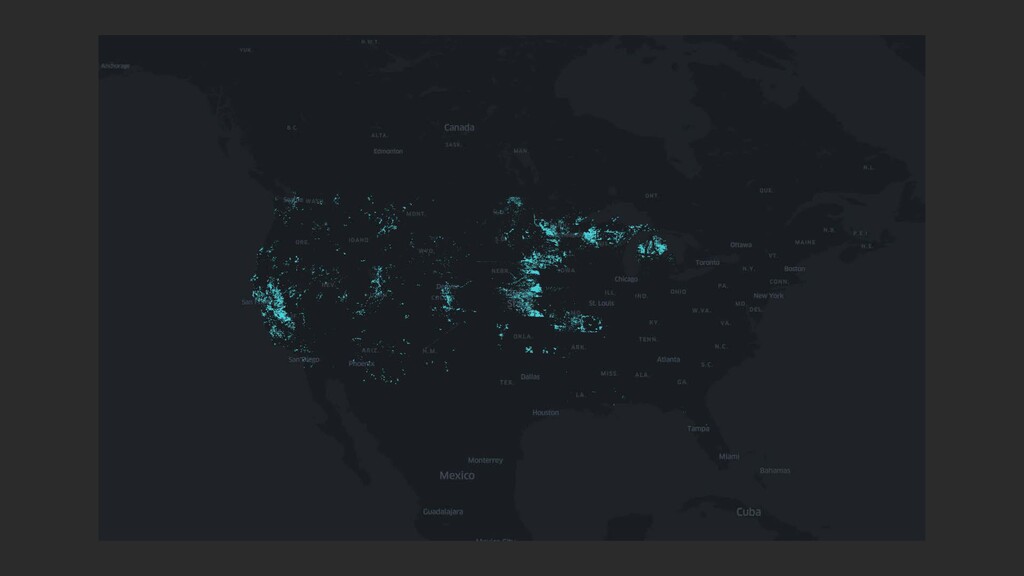
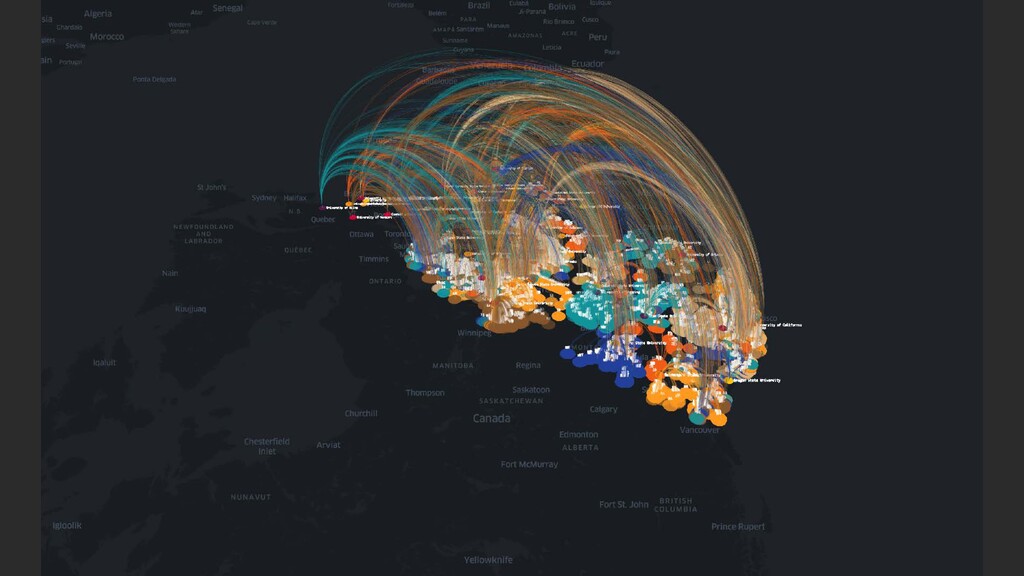
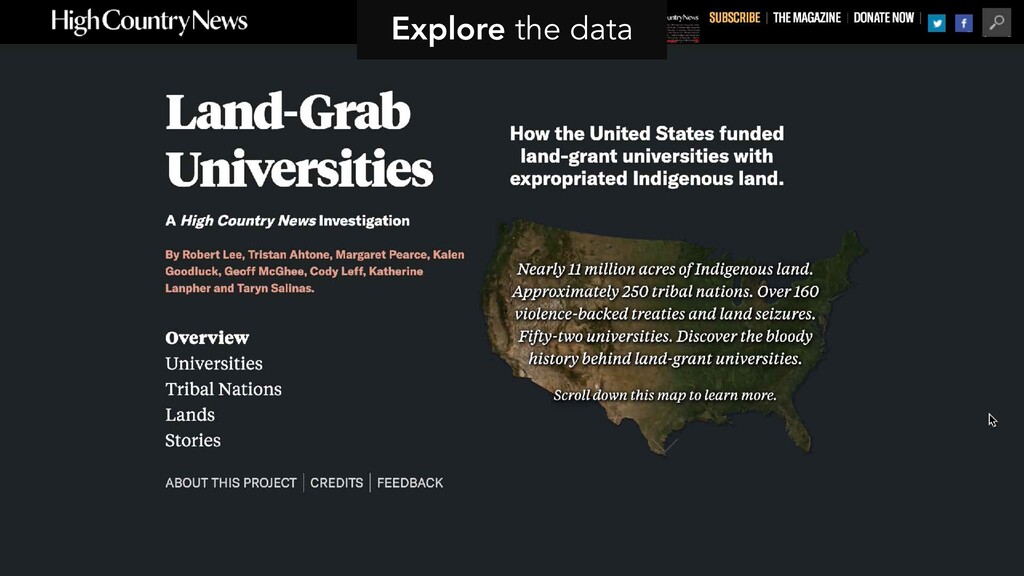
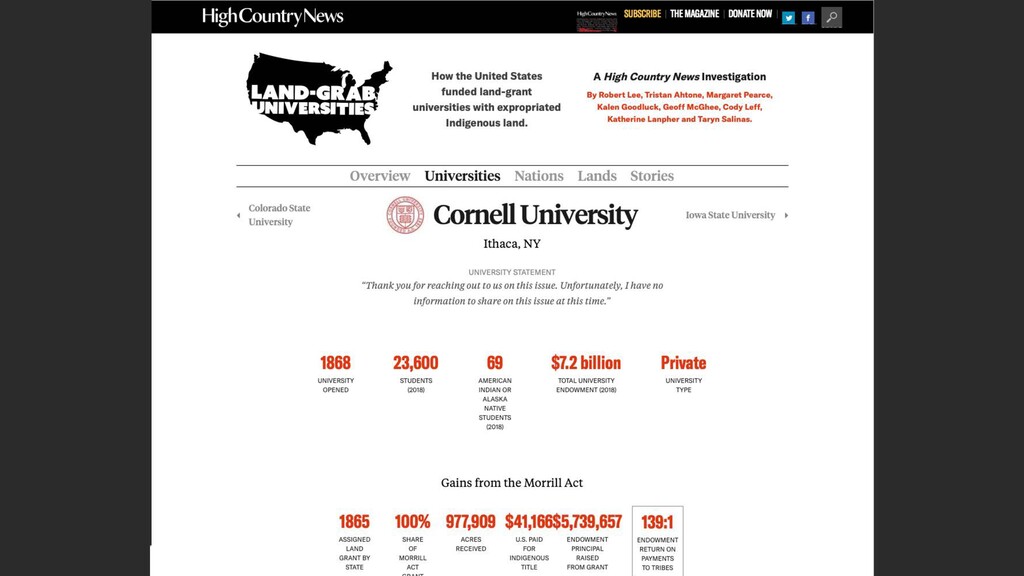
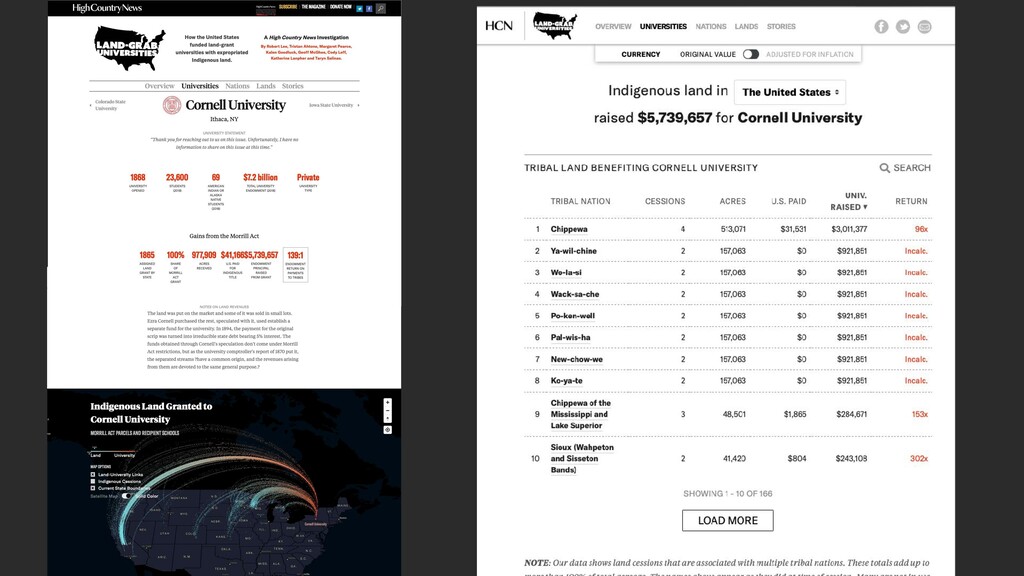
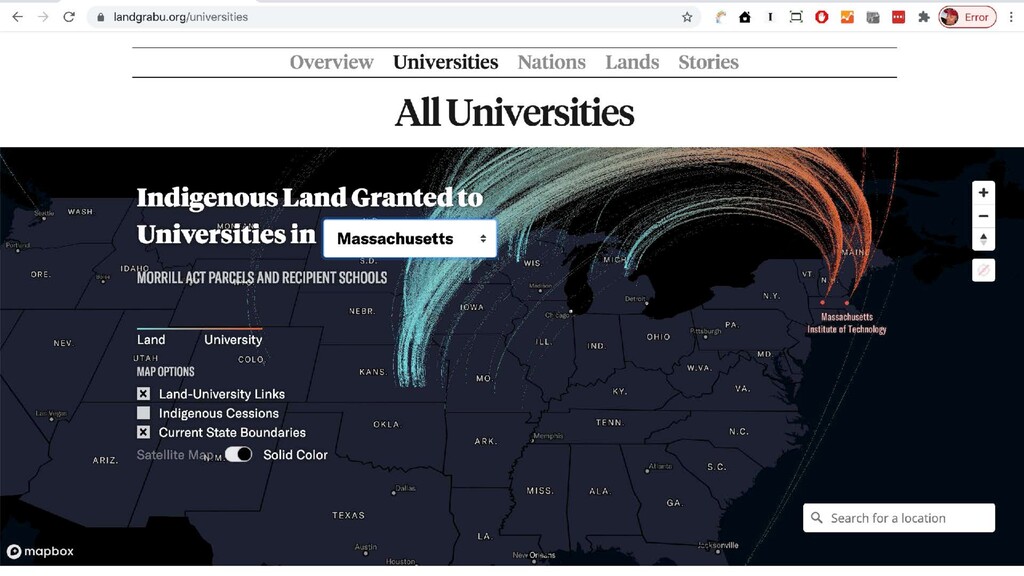
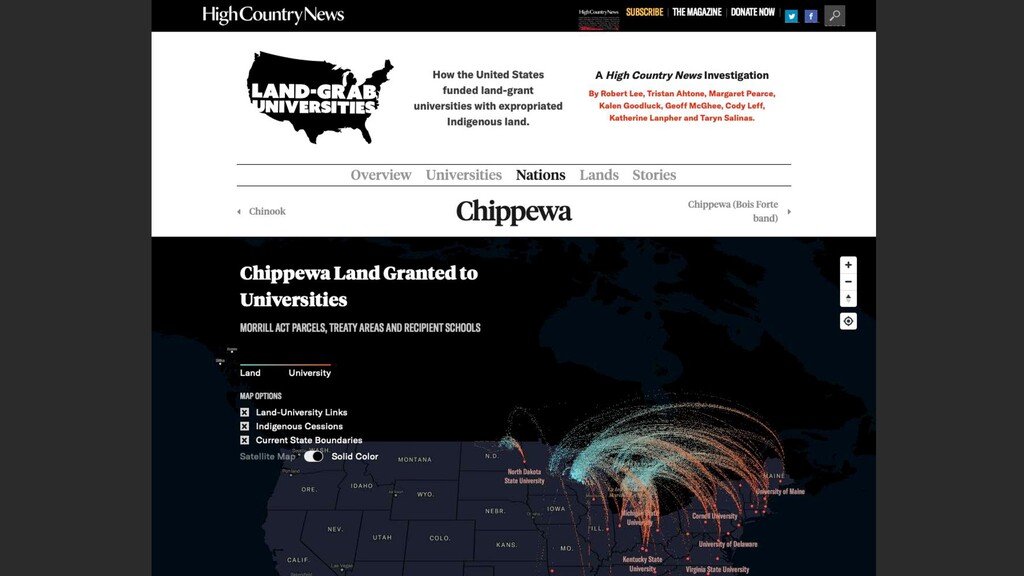
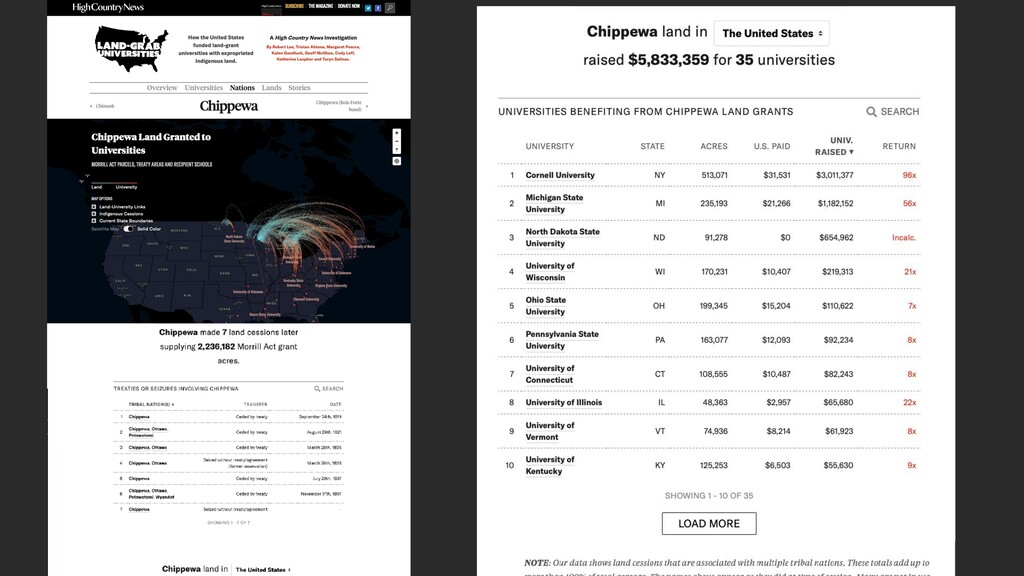
land transfers to United States • 52 Universities that benefited from Indigenous land • ~250 Native Nations whose land was acquired • ~80,000 land parcels in 24 states totaling 10.8 million acres • $22.8 million raised (inflation adj.: $495 million) • Photography documenting dozens of locations
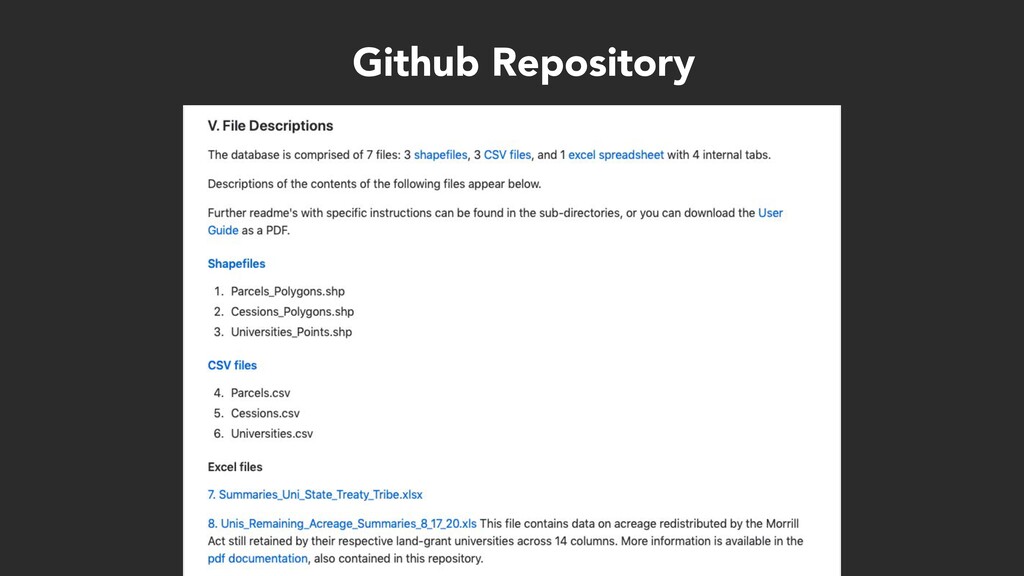
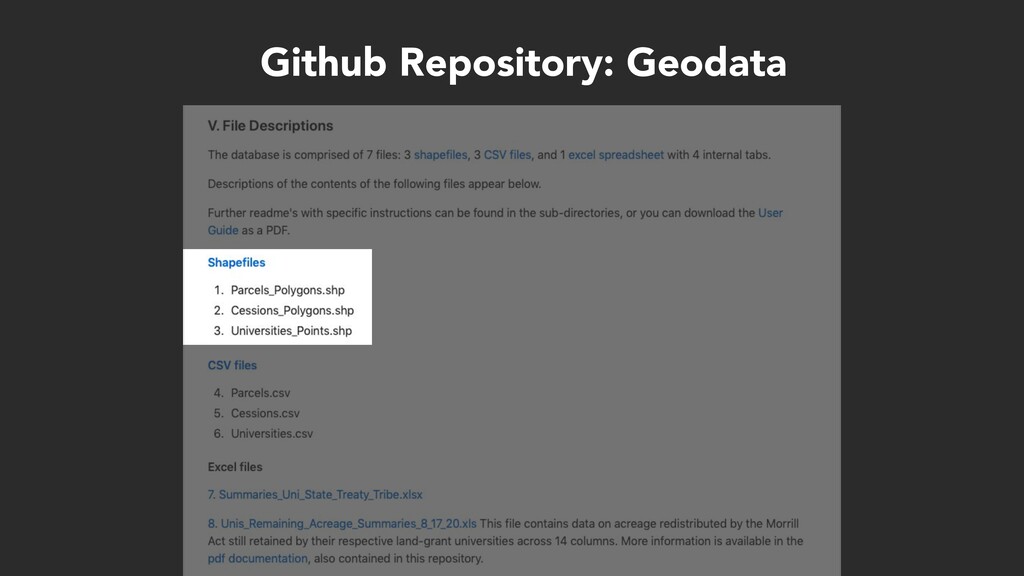
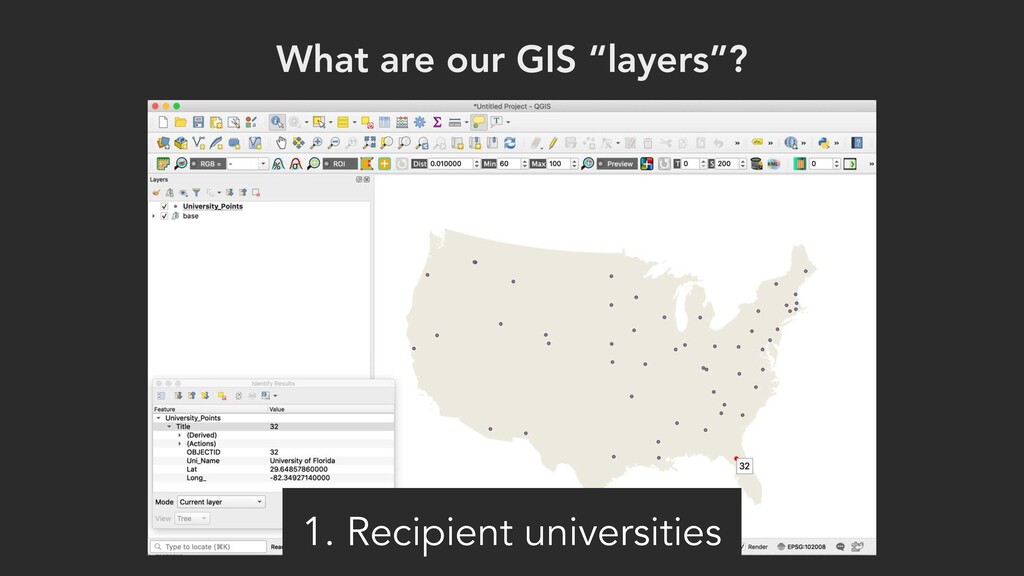
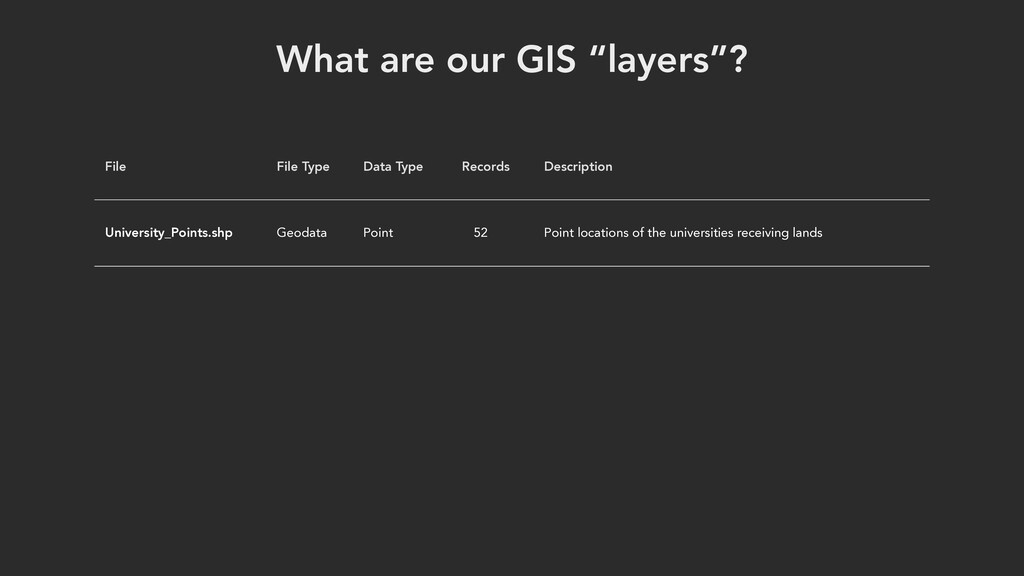
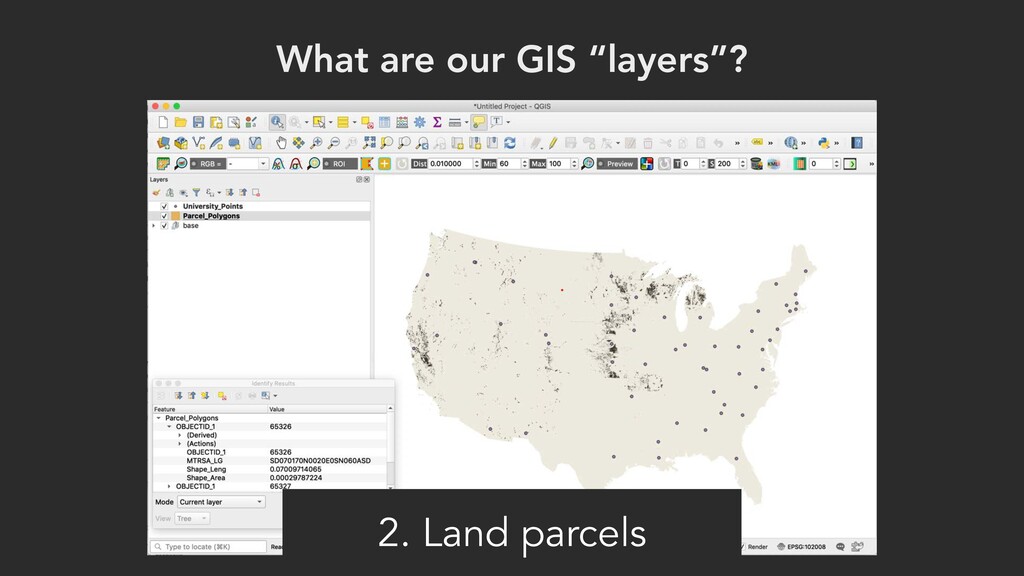
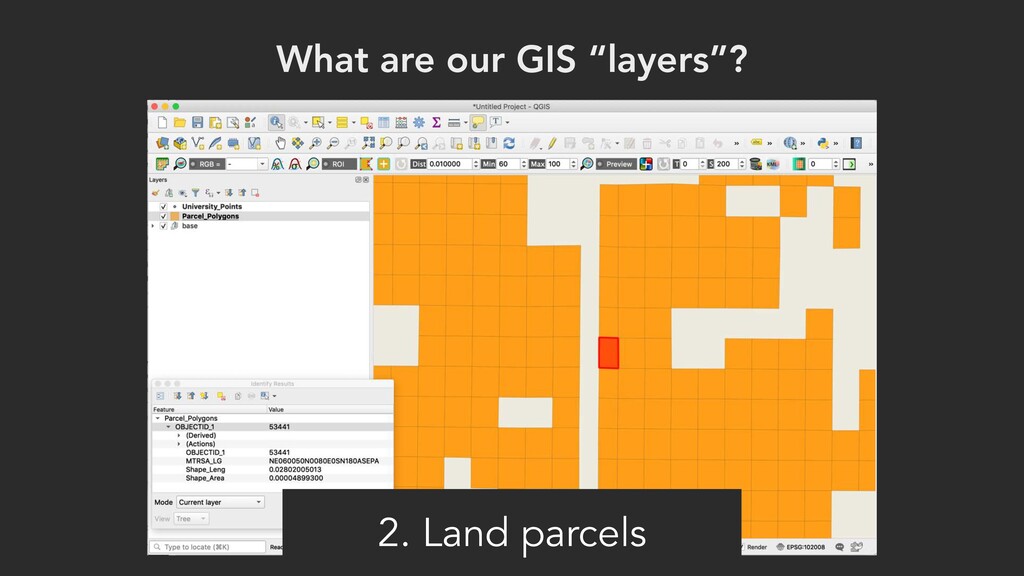
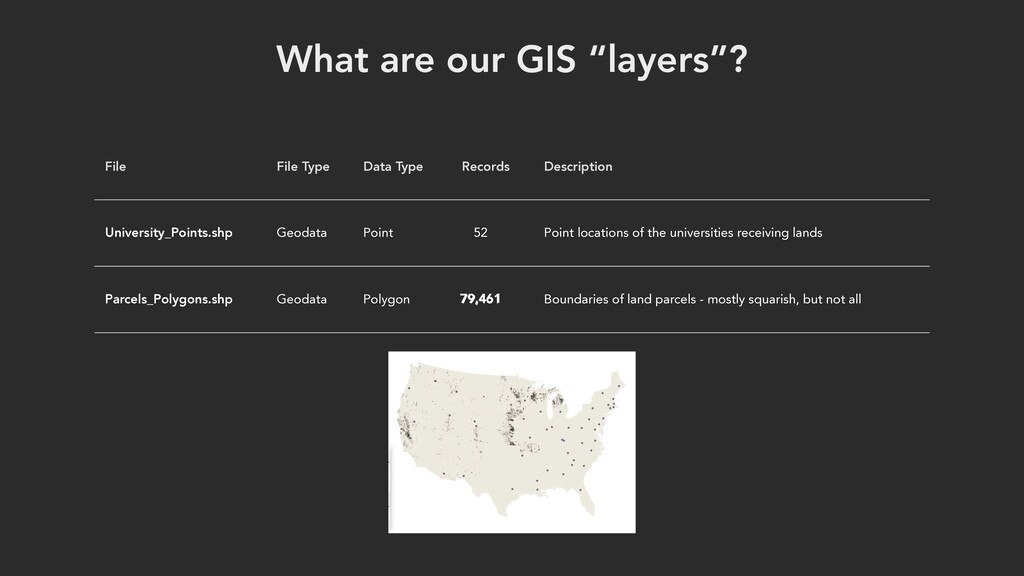
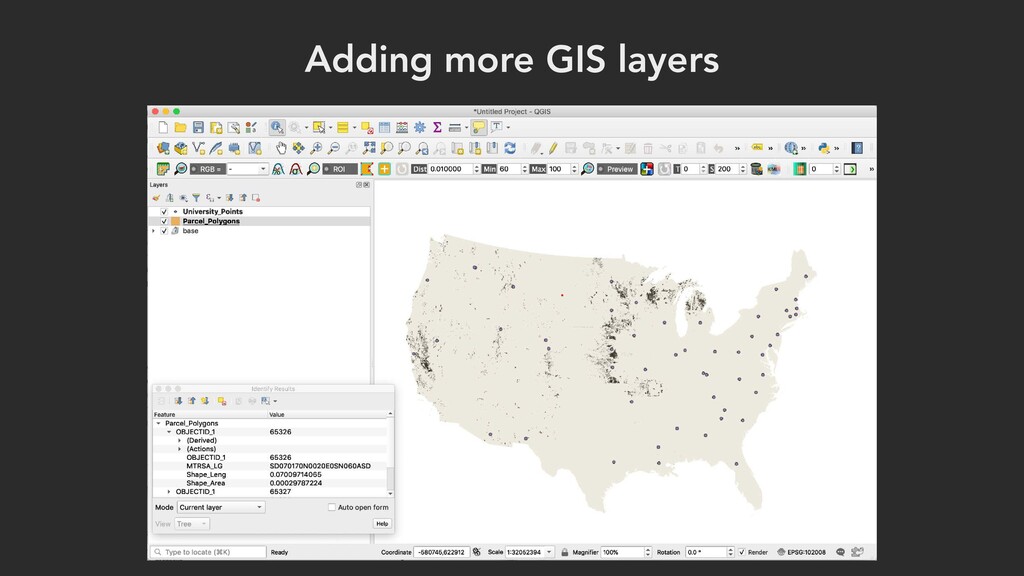
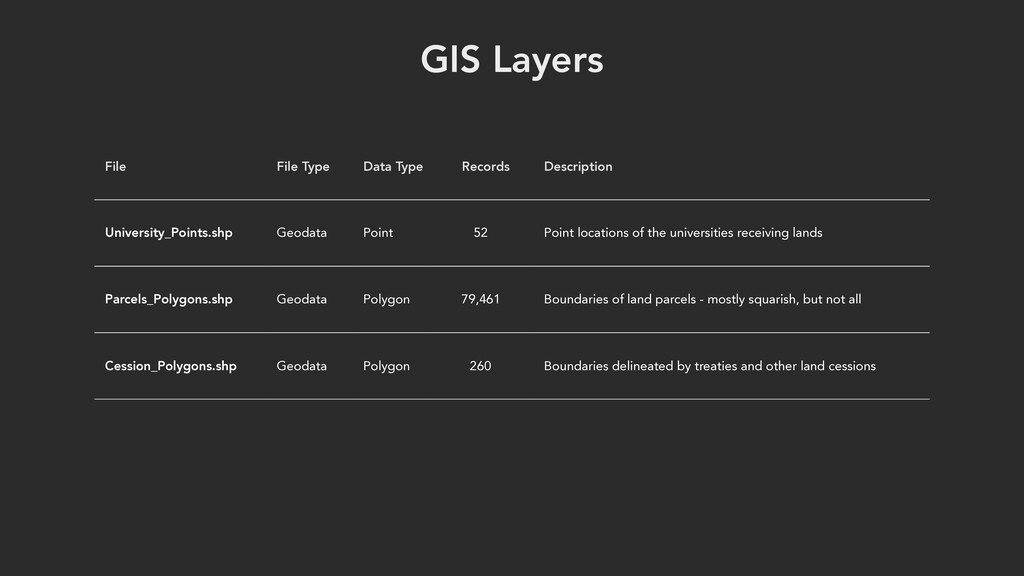
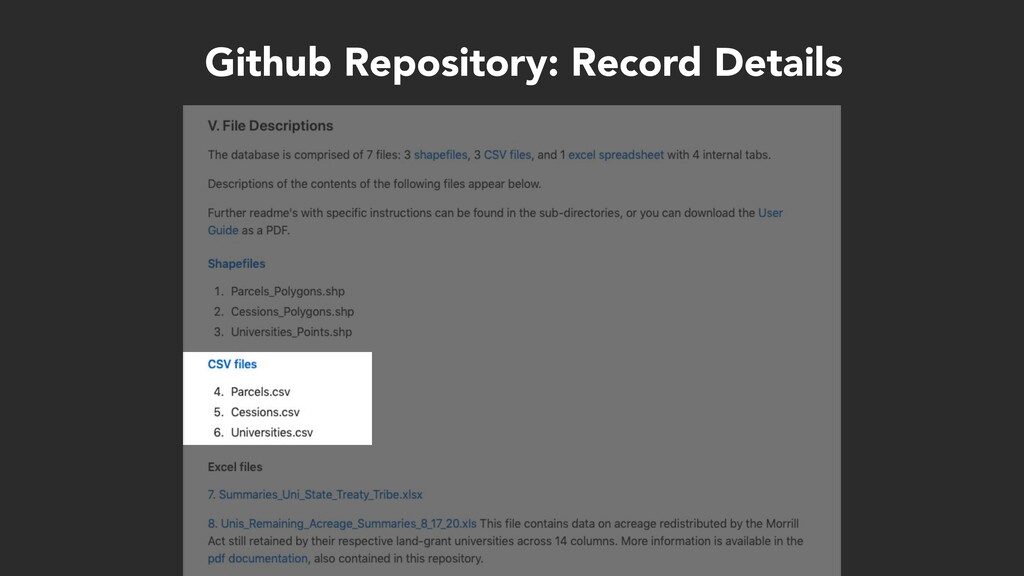
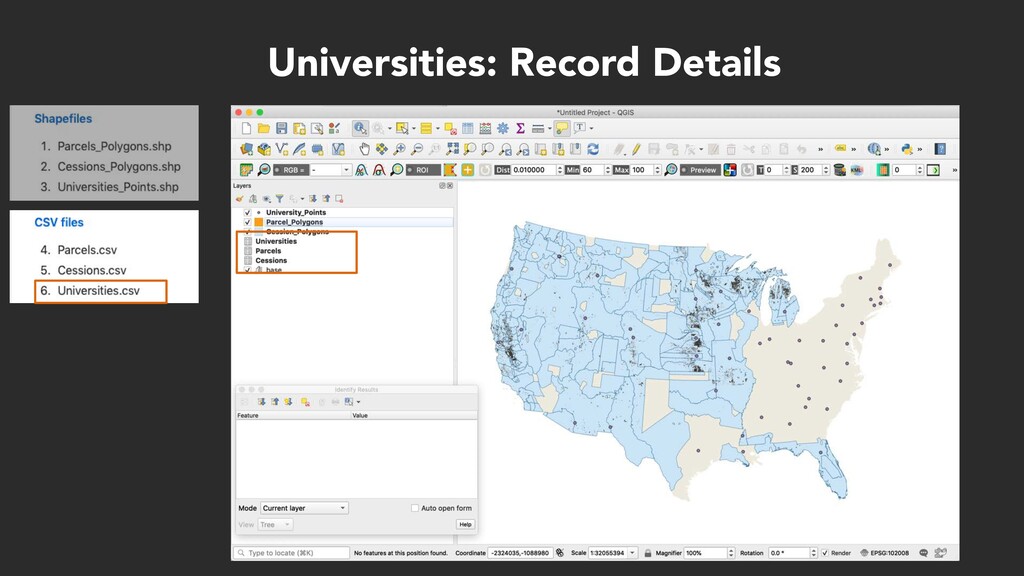
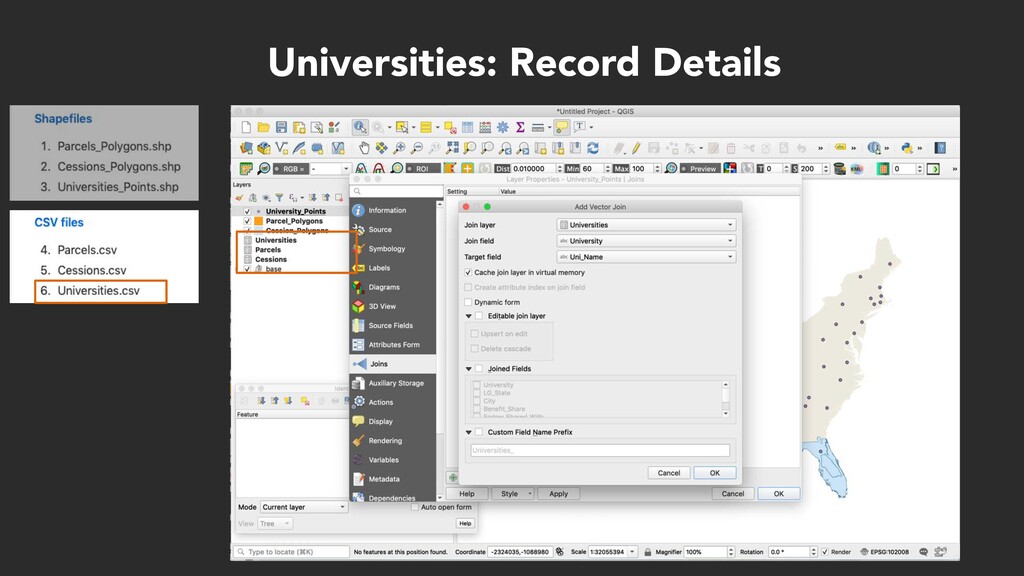
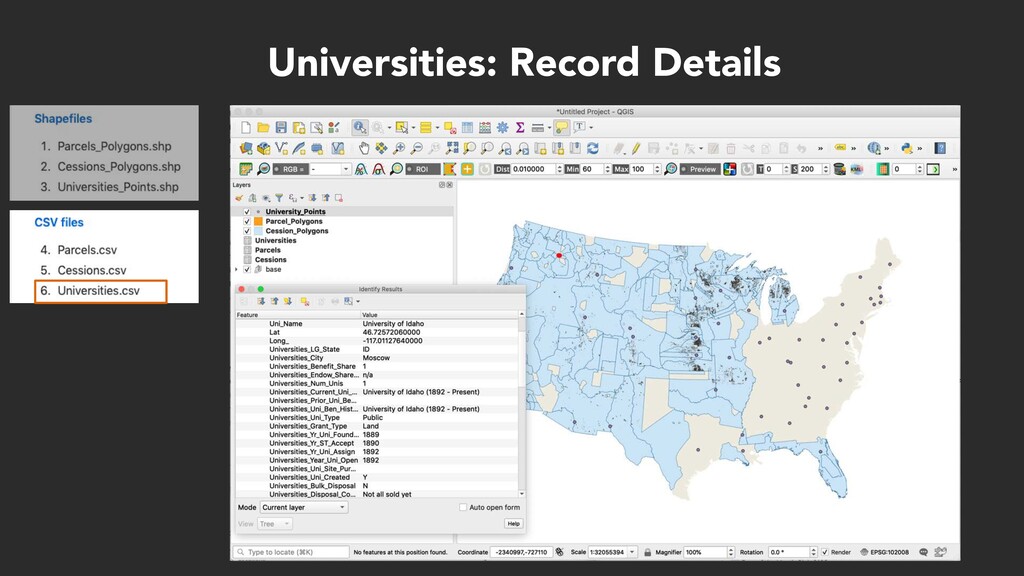
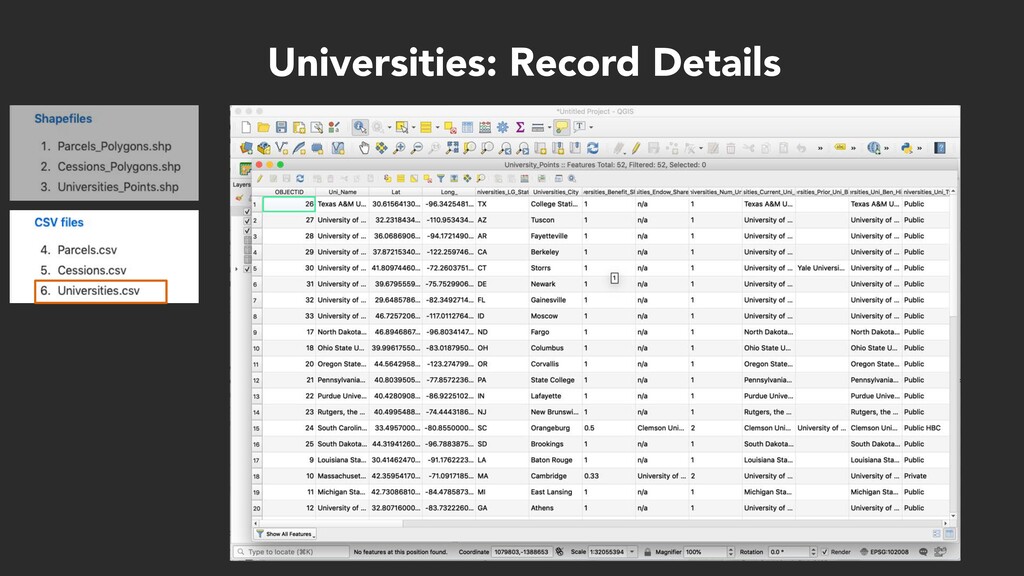
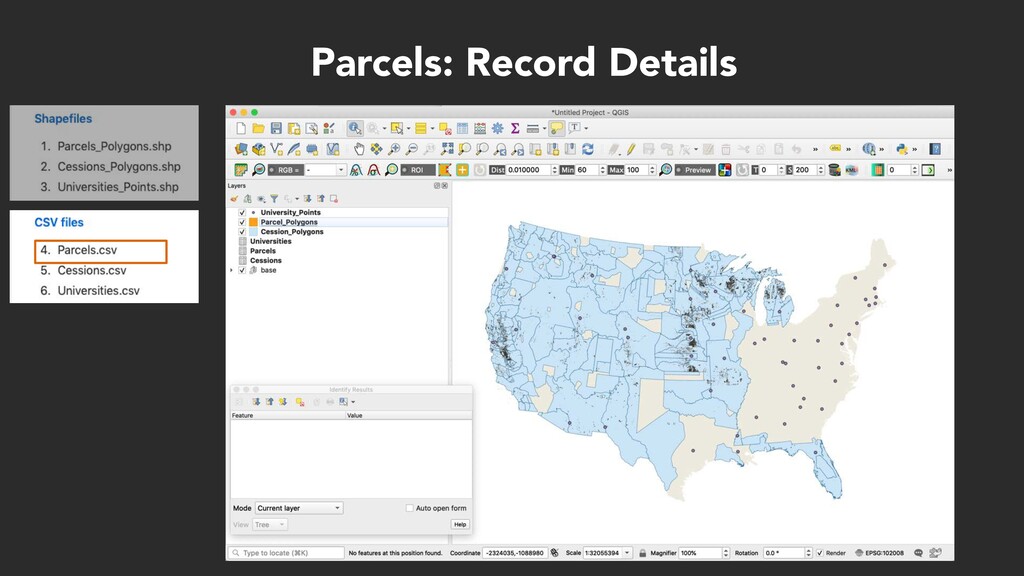
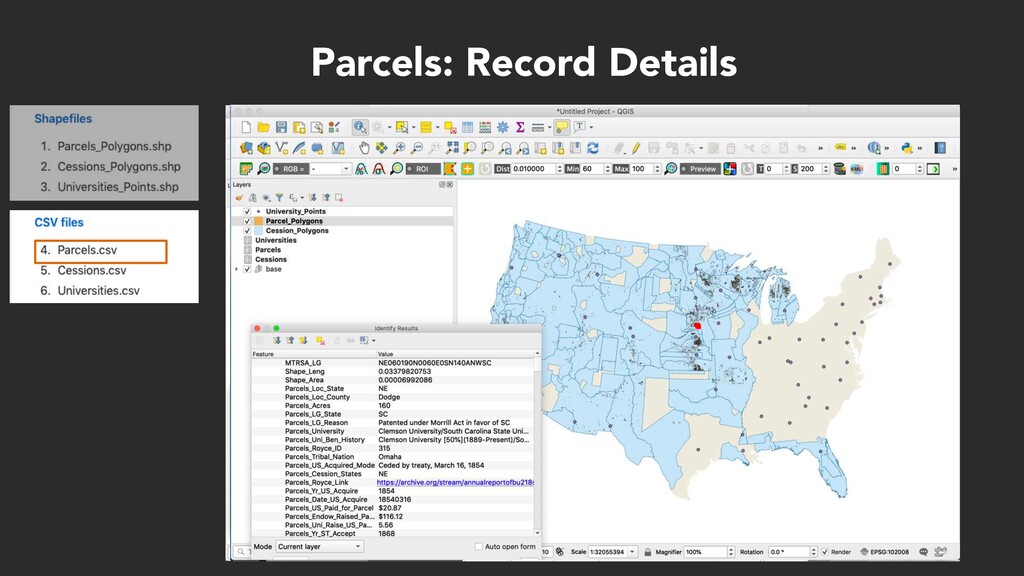
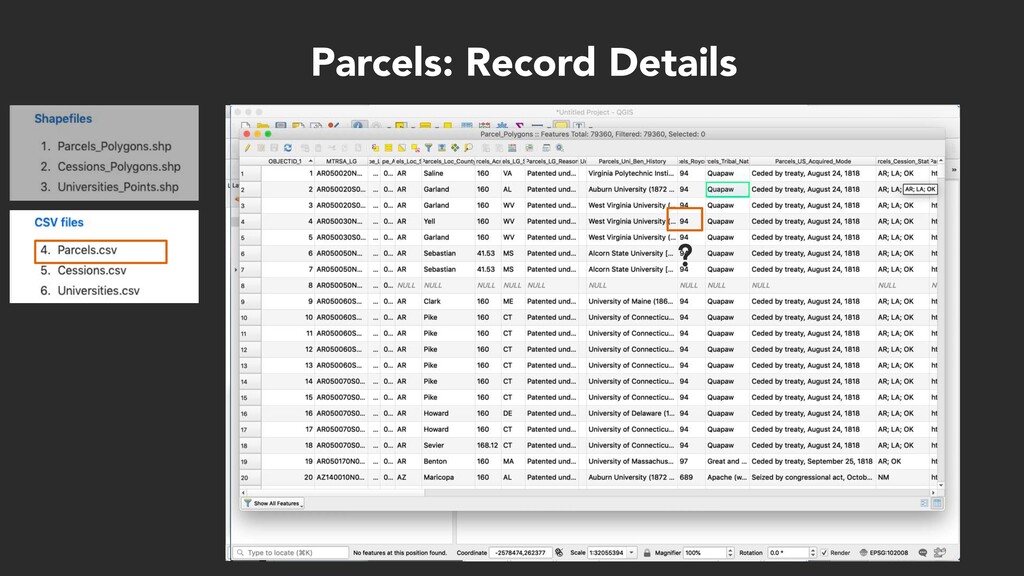
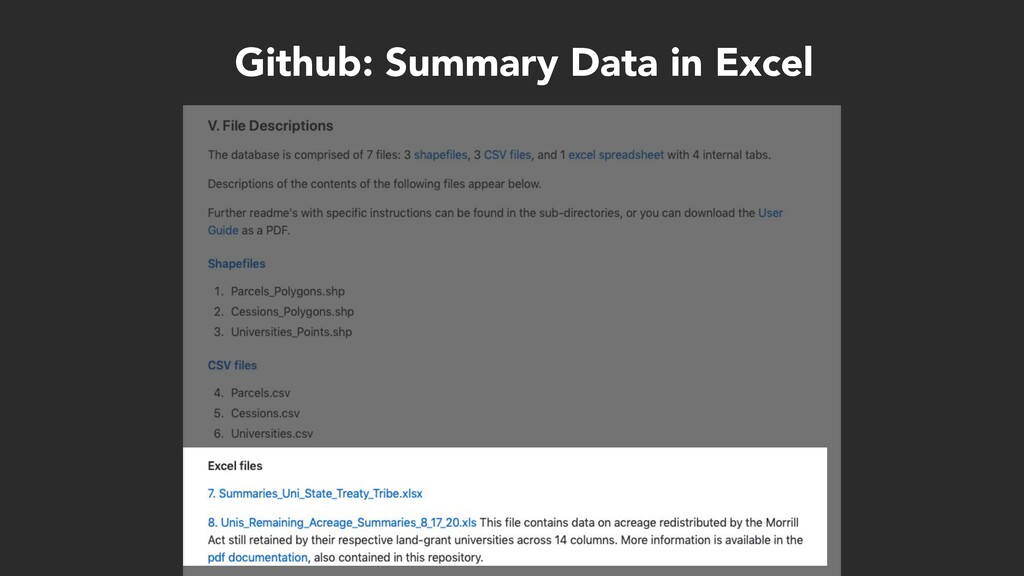
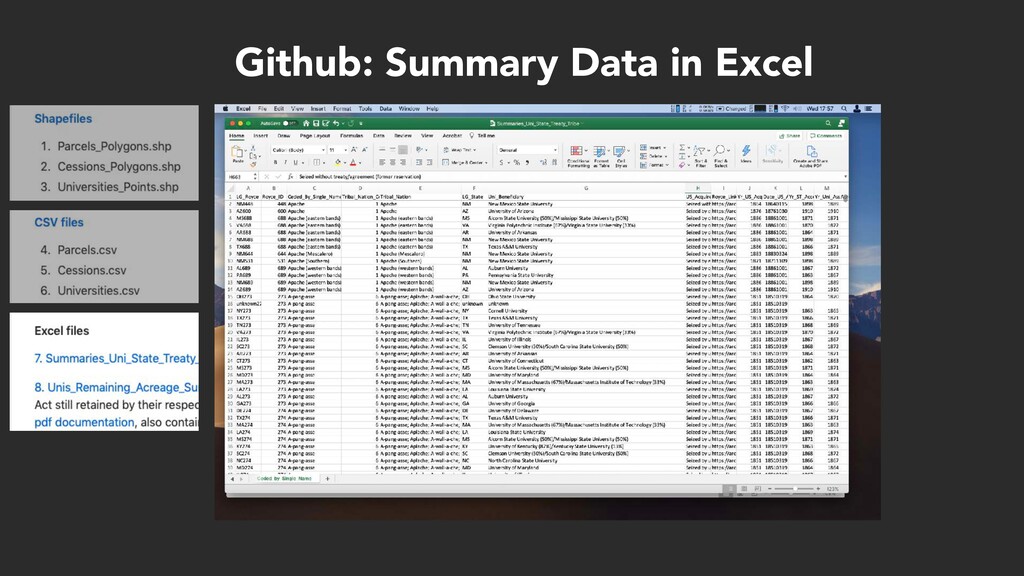
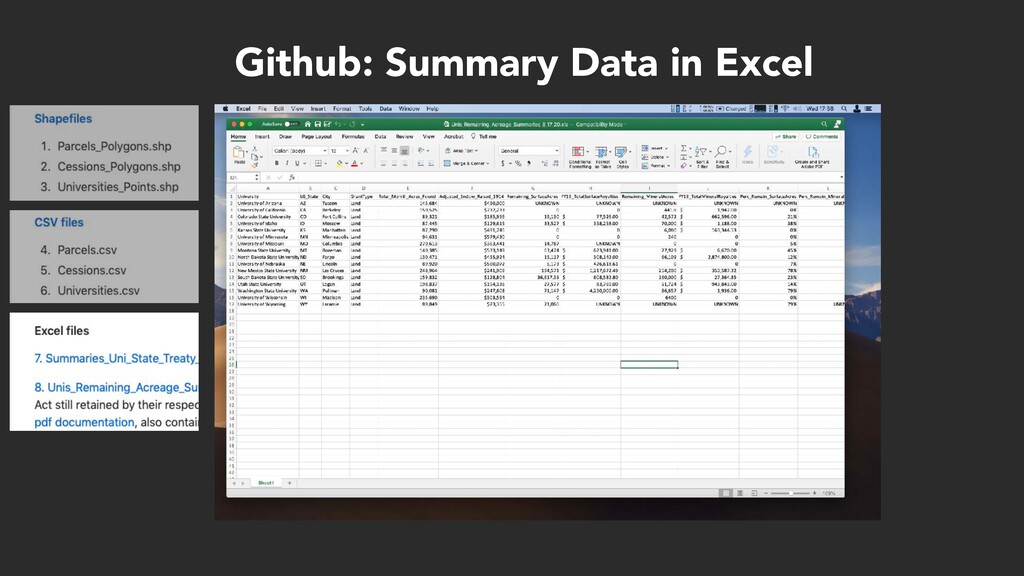
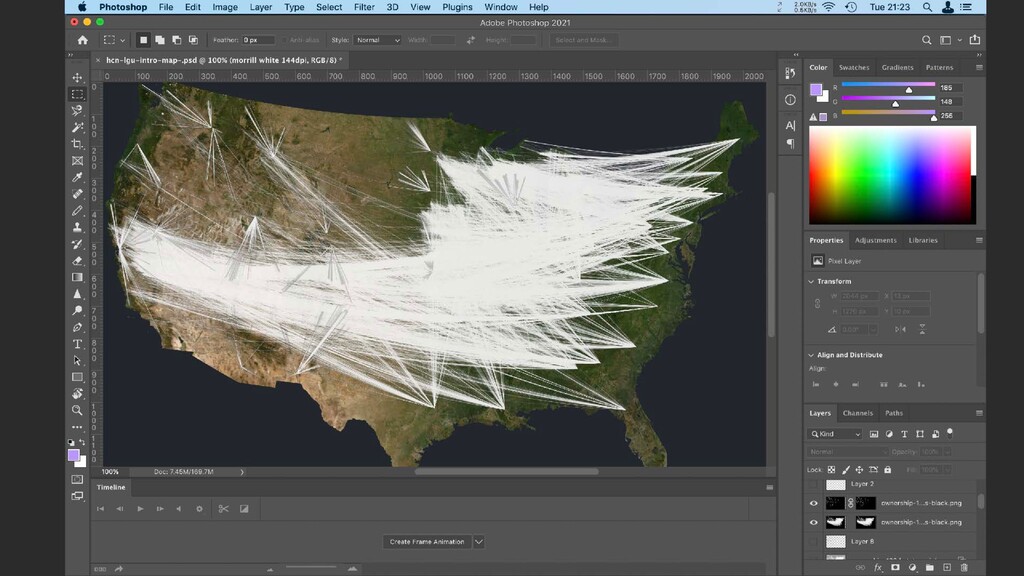
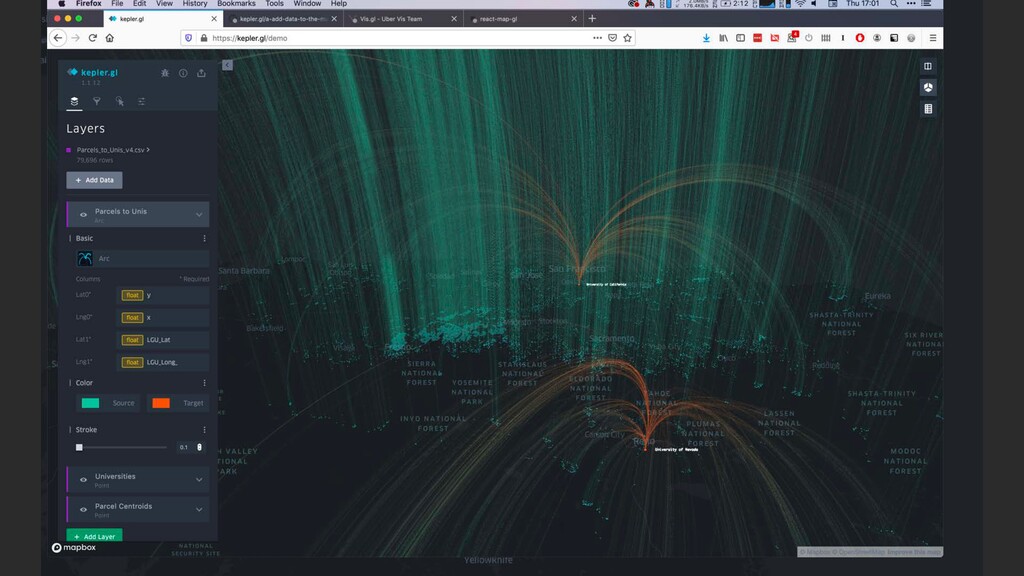
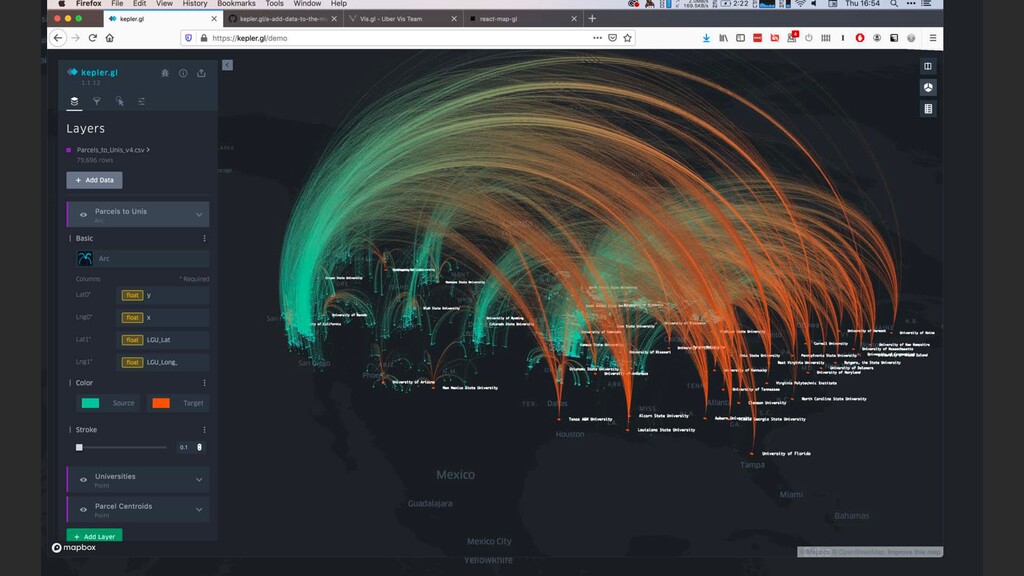
Records Description University_Points.shp Geodata Point 52 Point locations of the universities receiving lands Parcels_Polygons.shp Geodata Polygon 79,461 Boundaries of land parcels - mostly squarish, but not all 79,461
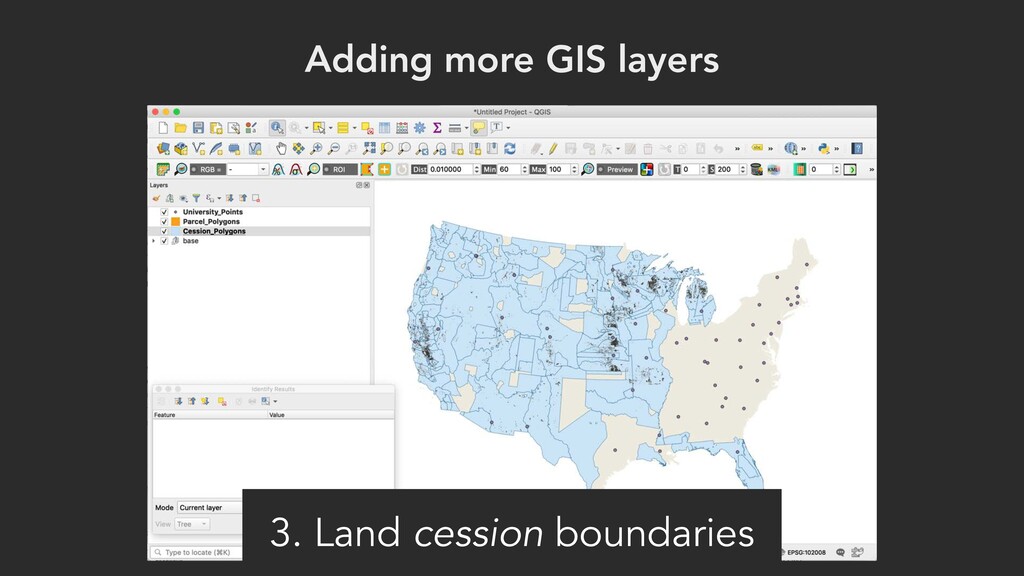
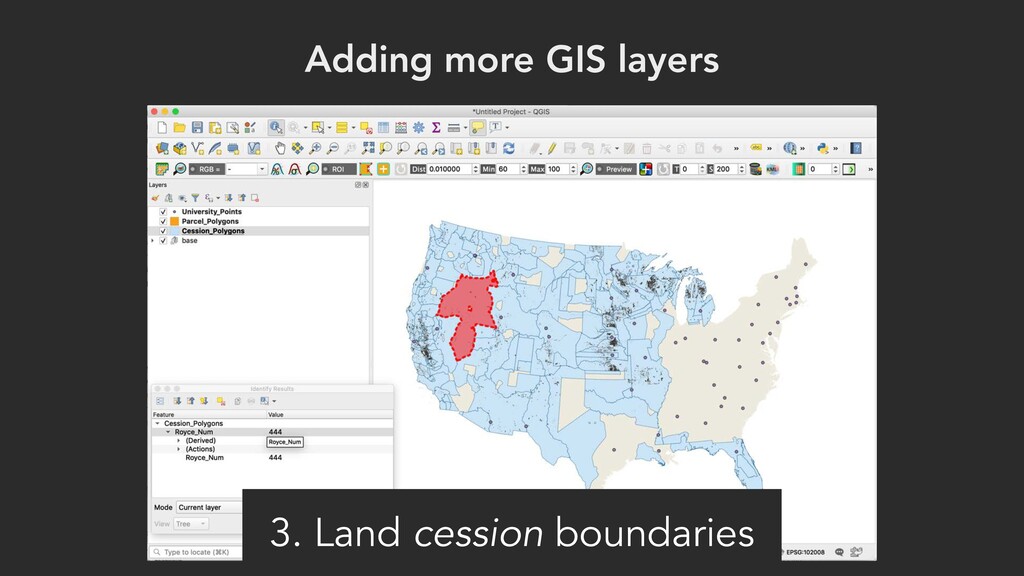
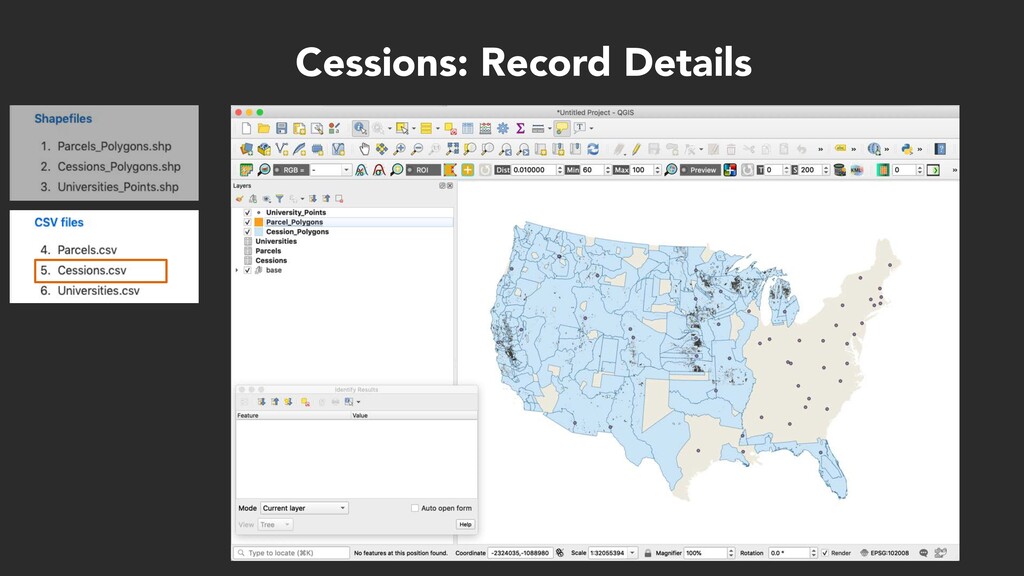
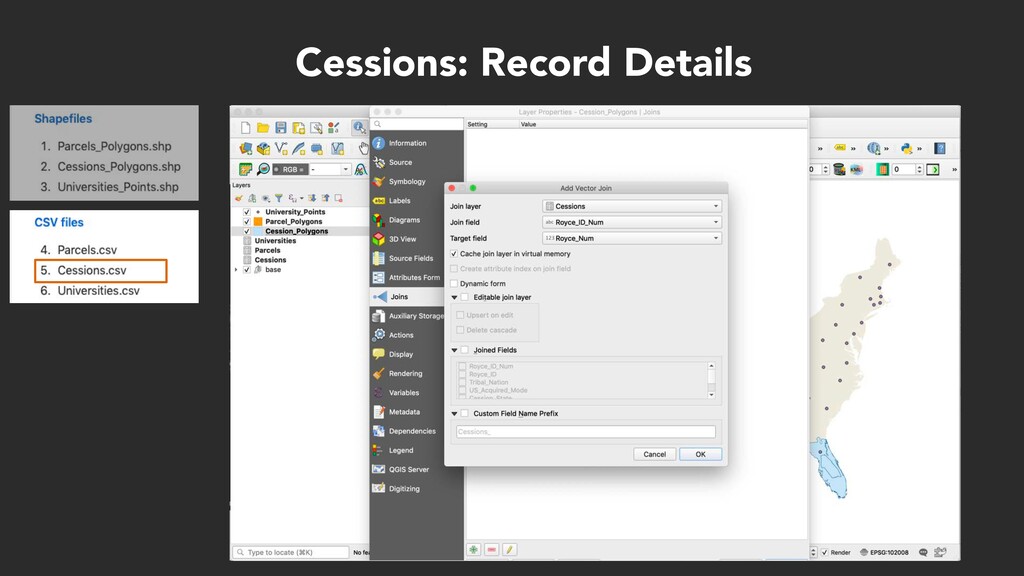
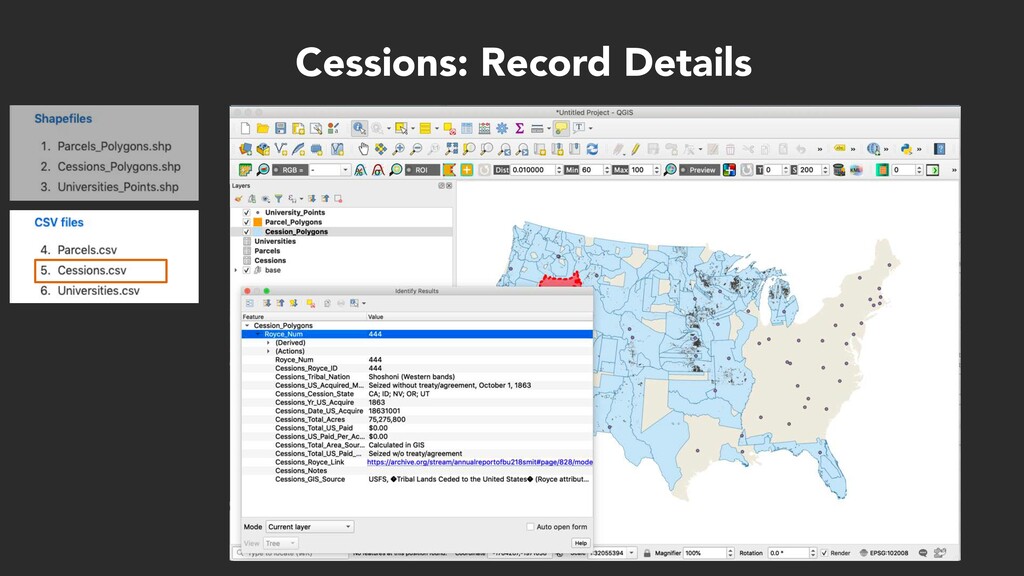
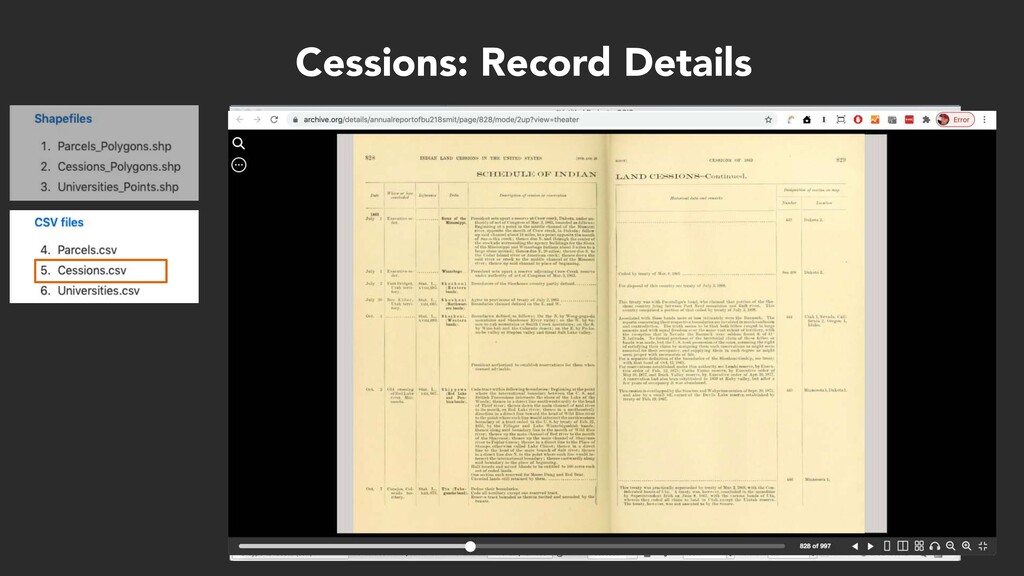
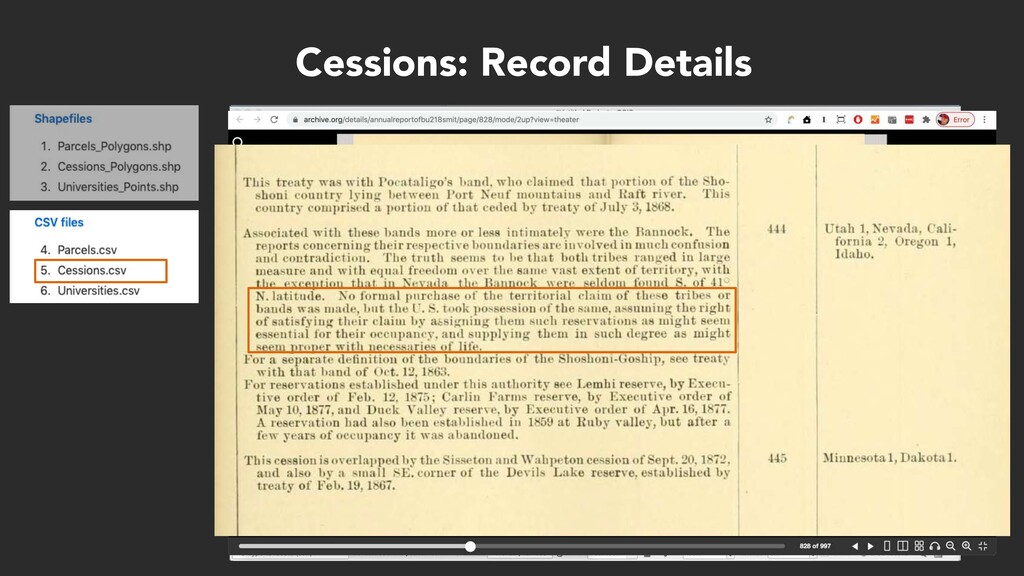
Geodata Point 52 Point locations of the universities receiving lands Parcels_Polygons.shp Geodata Polygon 79,461 Boundaries of land parcels - mostly squarish, but not all Cession_Polygons.shp Geodata Polygon 260 Boundaries delineated by treaties and other land cessions
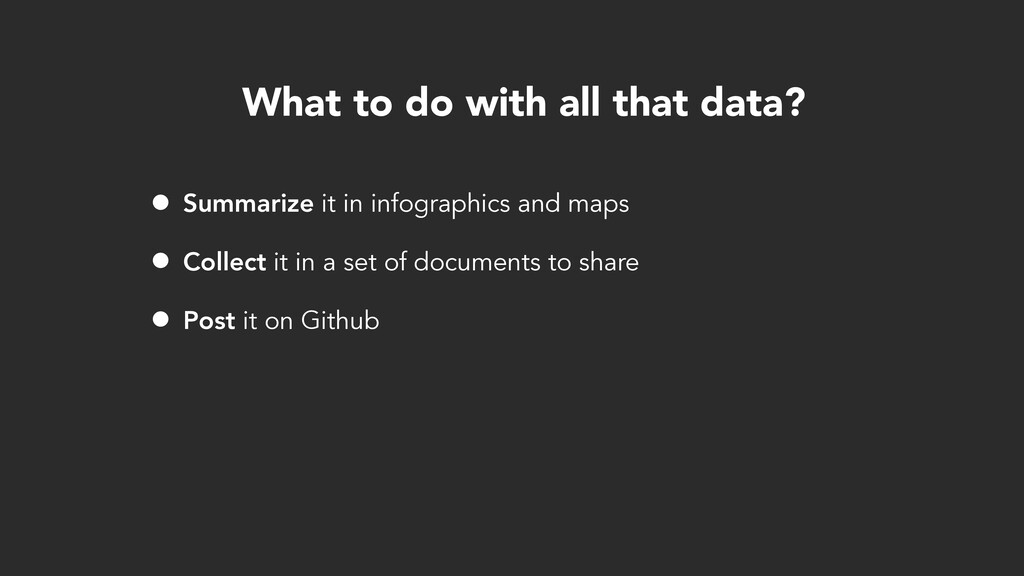
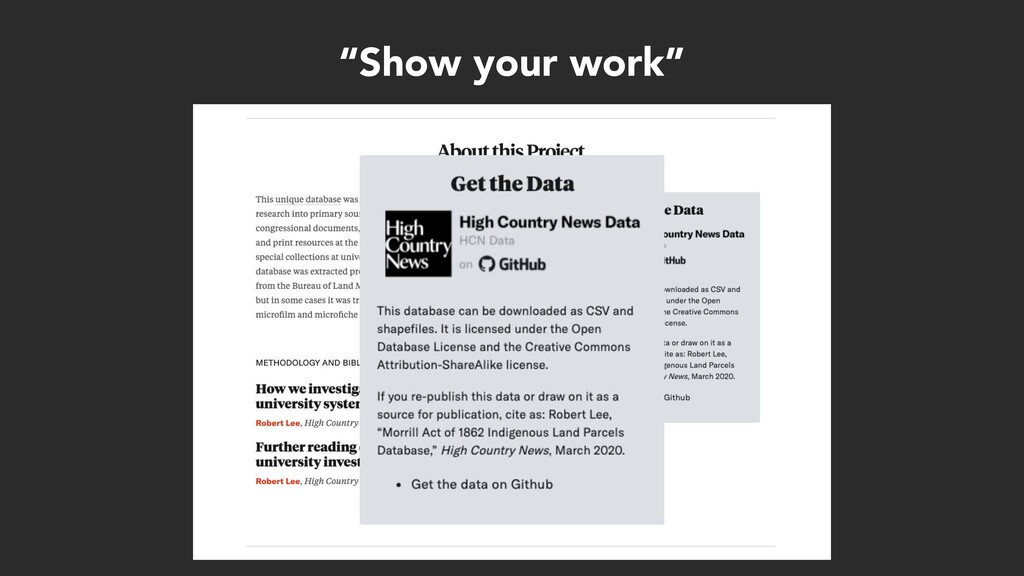
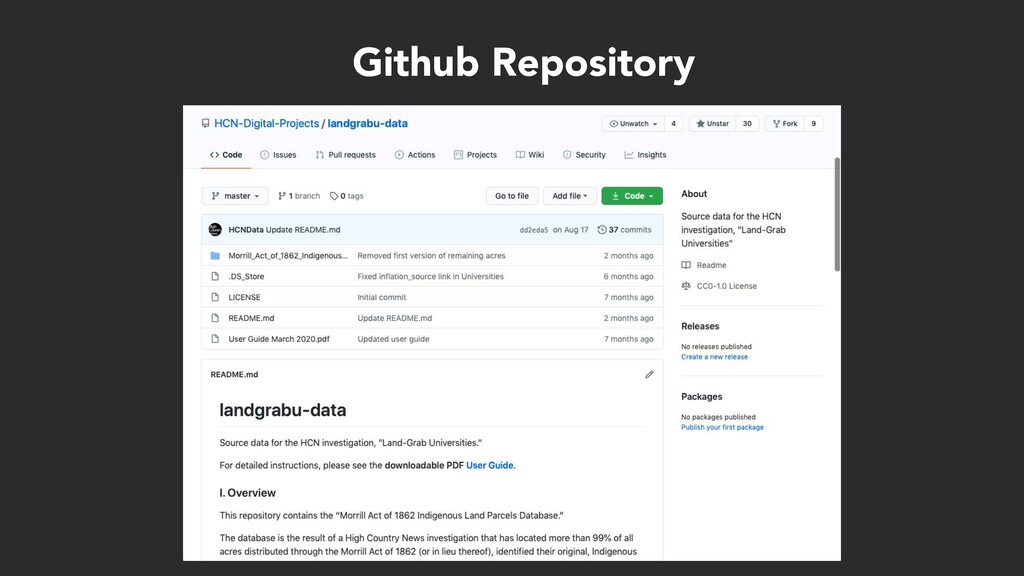
in infographics and maps • Collect it in a set of documents to share • Post it on Github • Present it online in a news application • “What’s a news application?”
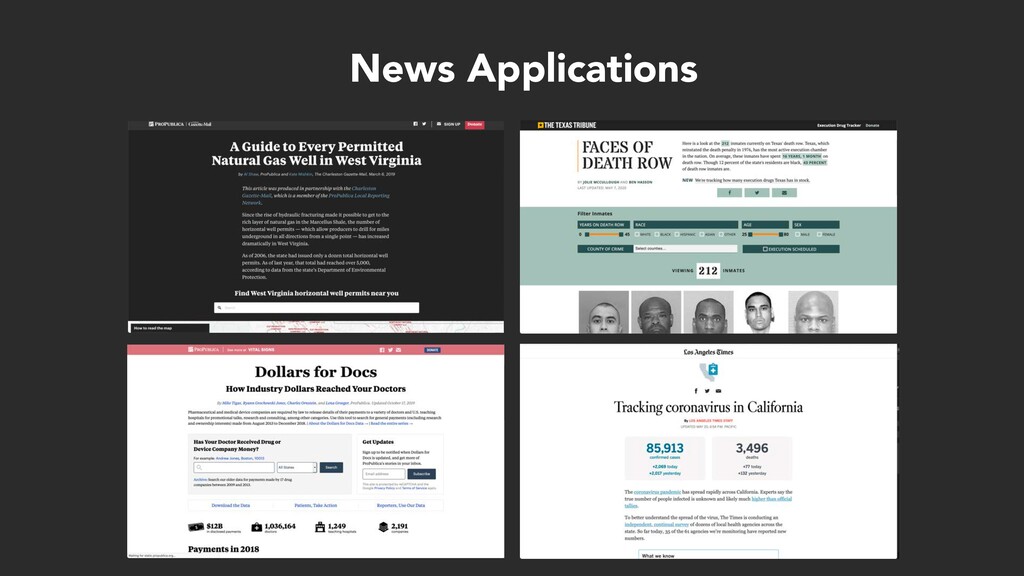
a story. They might be searchable databases, sleek visualizations or something else altogether. But no matter what form they take, news apps encourage readers to interact with data in a context that is meaningful to them: looking up crime trends in their area, checking the safety records of their local doctor, or searching political contributions to their candidate of choice.” –The Data Journalism Handbook, European Journalism Centre
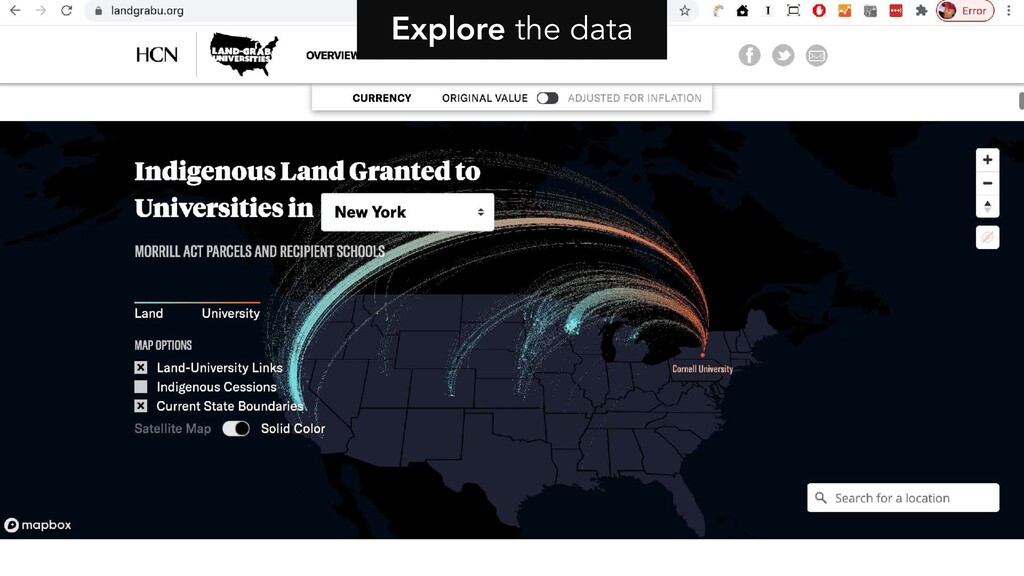
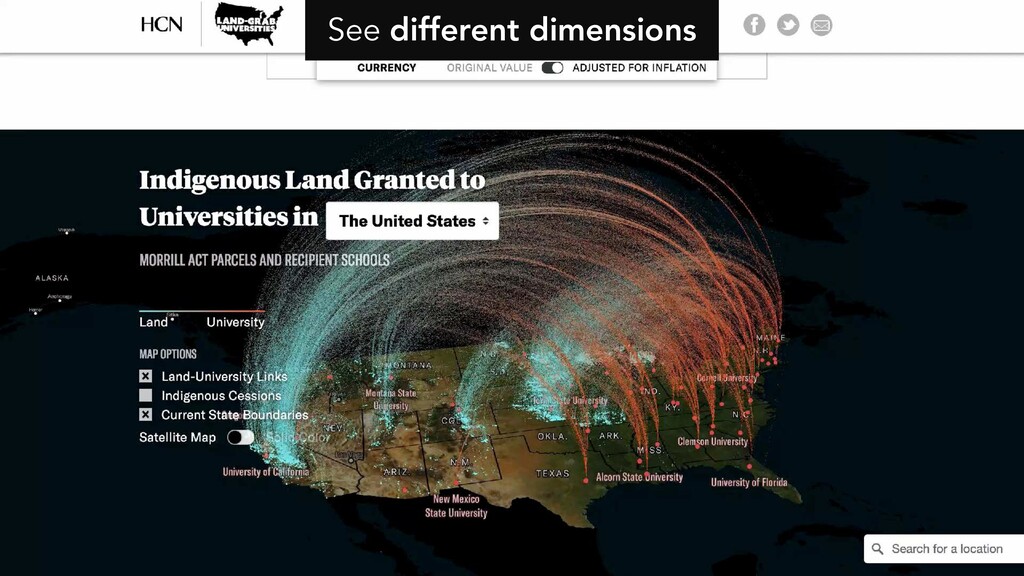
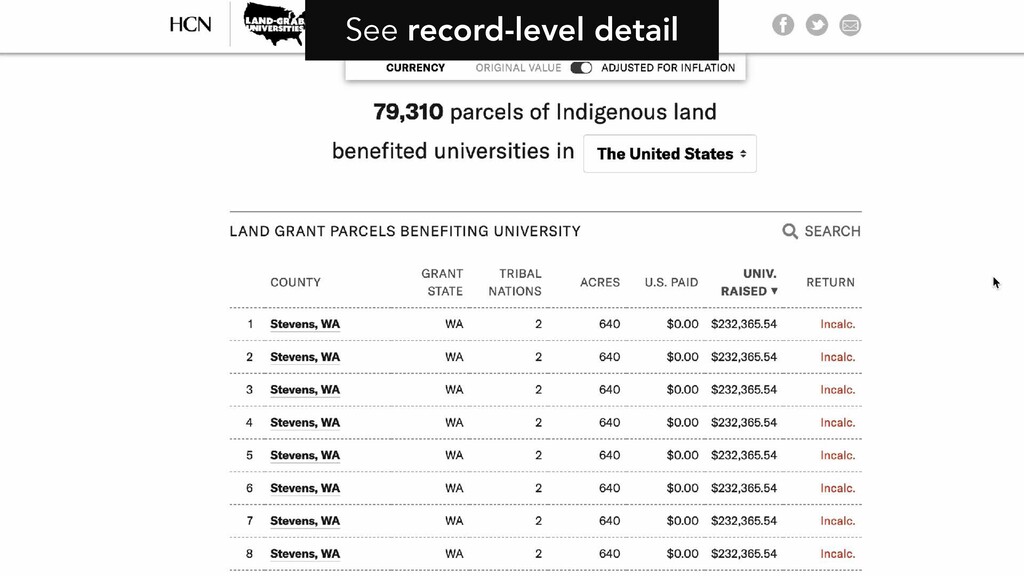
an entire data set • See different dimensions of data – more than a “list” • Get summary views like topline stats or maps • Filter and sort data • See record-level detail • Recenter a story around your focus of interest
an entire data set • See different dimensions of data – more than a “list” • Get summary views like topline stats or maps • Filter and sort data • See record-level detail • Recenter a story around your focus of interest
an entire data set • See different dimensions of data – more than a “list” • Get summary views like topline stats or maps • Filter and sort data • See record-level detail • Recenter a story around your focus of interest
an entire data set • See different dimensions of data – more than a “list” • Get summary views like topline stats or maps • Filter and sort data • See record-level detail • Recenter a story around your focus of interest
an entire data set • See different dimensions of data – more than a “list” • Get summary views like topline stats or maps • Filter and sort data • See record-level detail • Recenter a story around your focus of interest
an entire data set • See different dimensions of data – more than a “list” • Get summary views like topline stats or maps • Filter and sort data • See record-level detail • Recenter a story around your focus of interest
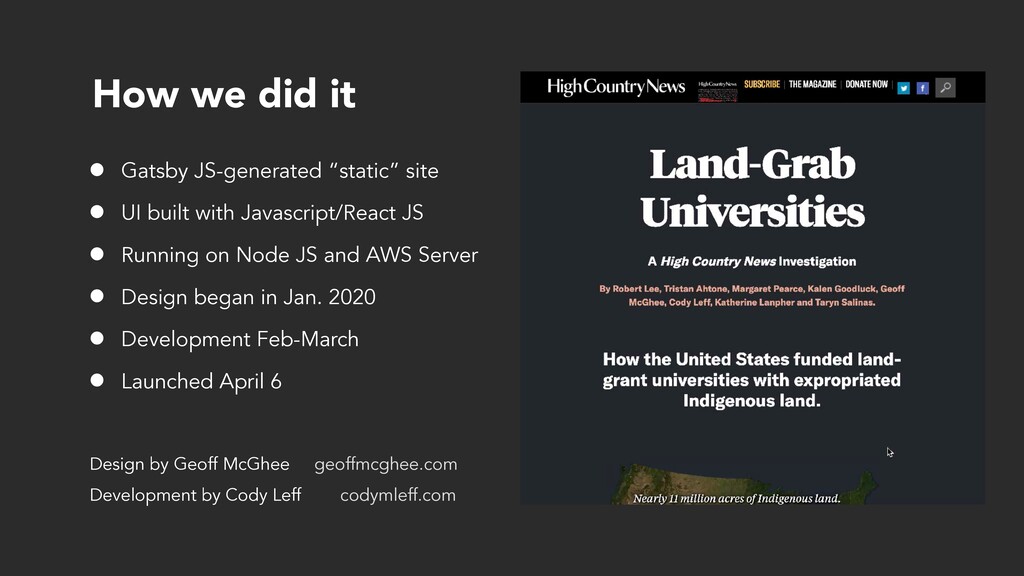
UI built with Javascript/React JS • Running on Node JS and AWS Server • Design began in Jan. 2020 • Development Feb-March • Launched April 6 Design by Geoff McGhee geoffmcghee.com Development by Cody Leff codymleff.com
picked? Altitude and slope analysis, distance to natural water sources, inches of average rainfall, land cover type vs price paid, distance to road network, “hot spots” of selection • Patterns by state? Did Eastern/scrip states show different tendencies for selection? Areas with heterogenous selection by many states (like California Central Valley?) • Mineral/resources wealth - oil, gas, mining, timber abundance • Current estimated value of properties, or of all properties in a parcel • Relationship to present-day Native Nation/tribal population centers and headquarters • University program and policy changes • Enrollment change at LGUs – over all time since records kept? • Existence of Native/Indigenous study programs • Scholarship programs directed to American Indian/Alaskan Native students • Value of federal research grants to universities
King, Jennifer Sahn and everyone at High Country News • Prof. Robert “Bobby” Lee • Margaret Pearce and Erik Steiner for graphics advice and data help • Cody Leff for tireless development work • Support from the Pulitzer Center for Crisis Reporting and the Fund for Investigative Journalism @mcgeoff on Twitter [email protected] Questions welcome