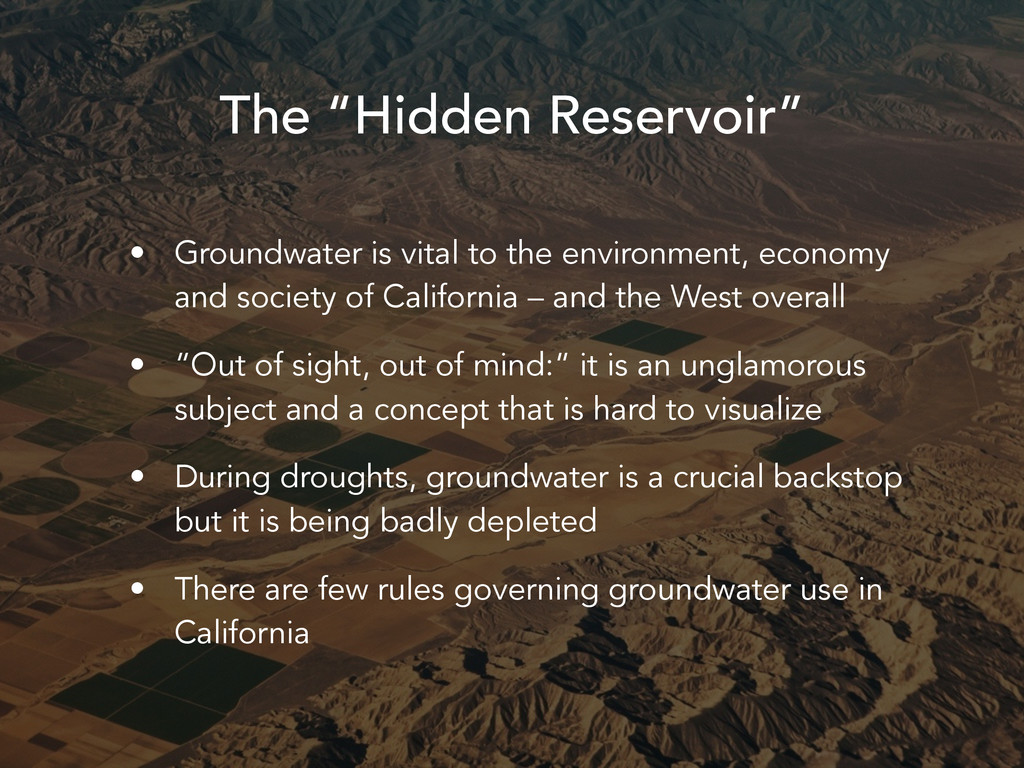
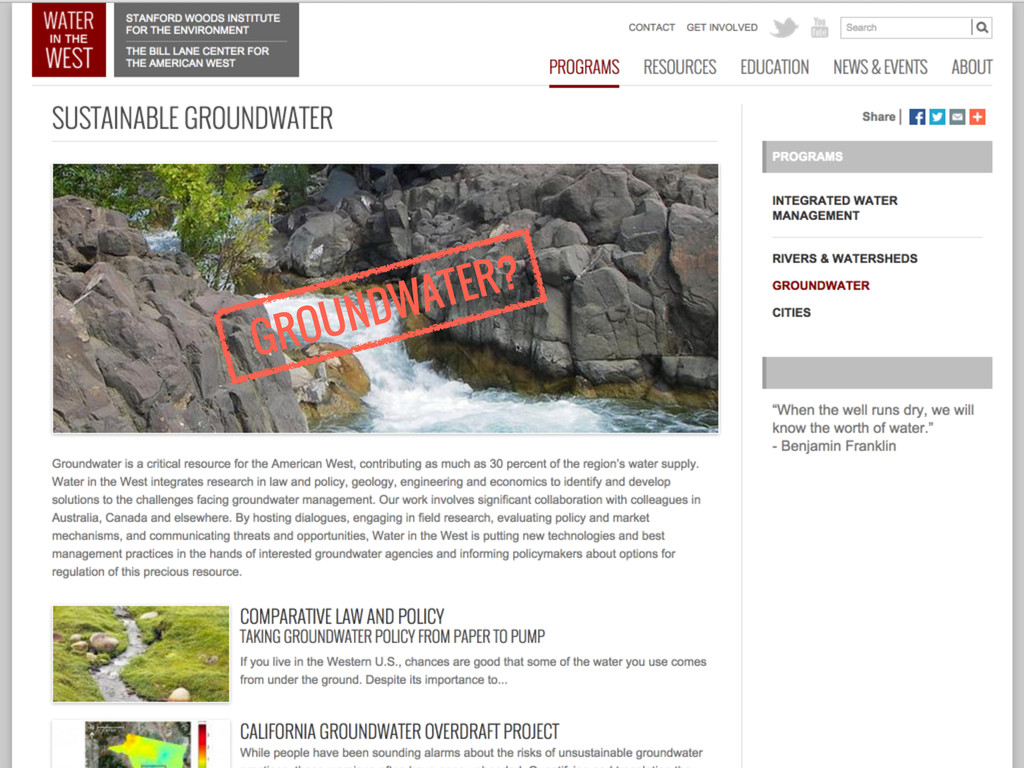
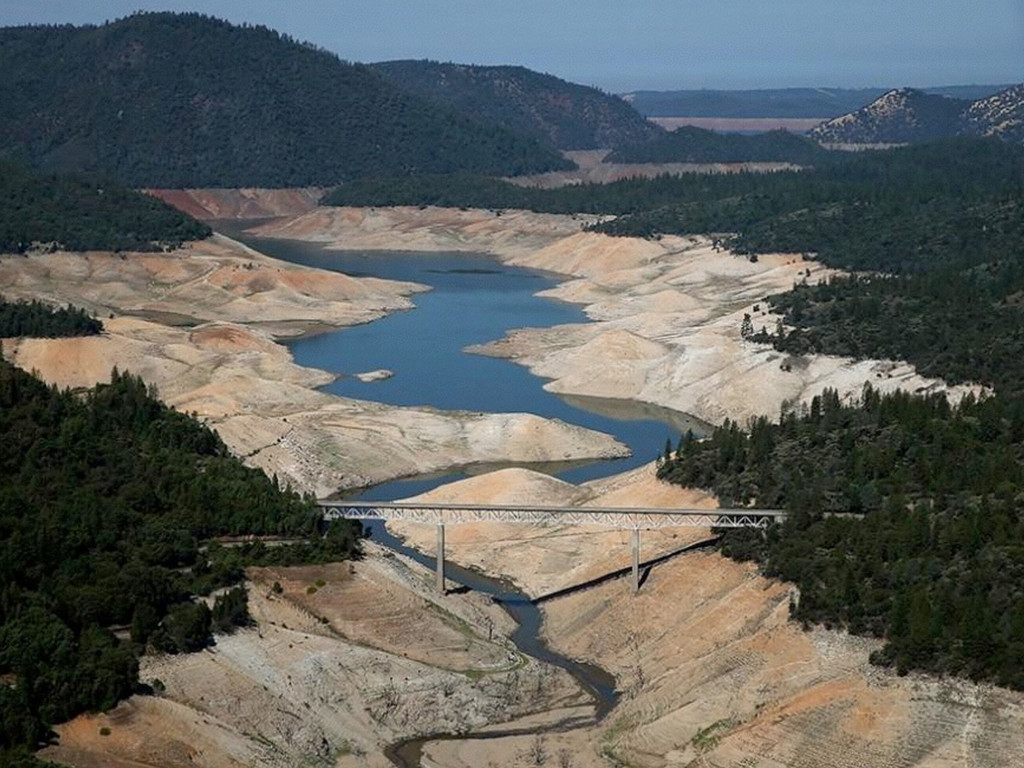
economy and society of California – and the West overall • “Out of sight, out of mind:” it is an unglamorous subject and a concept that is hard to visualize • During droughts, groundwater is a crucial backstop but it is being badly depleted • There are few rules governing groundwater use in California
Fahlund, advised by David Freyberg, Rebecca Nelson, Geoff McGhee • Supported by grant from California Water Foundation • Leon Szeptycki, Janny Choy, and Tara Moran joined team
science, policy, and art. By communicating this complex subject in simple ways that distill its complexity, we seek to pave the way for improvements to groundwater management in California, including voluntary best practices, changes to local or state policy, and/or legal reforms.”
are decision makers as well as their constituents and other immediate influencers. We further segment our audience to consider those residing within and outside of overdrafted groundwater basins. … Those outside of directly affected areas may be apathetic to those impacts they perceive to be affecting others. Because the majority of citizens in California fall outside one of the critically overdrafted basins in the state, many of our communications target this audience.”
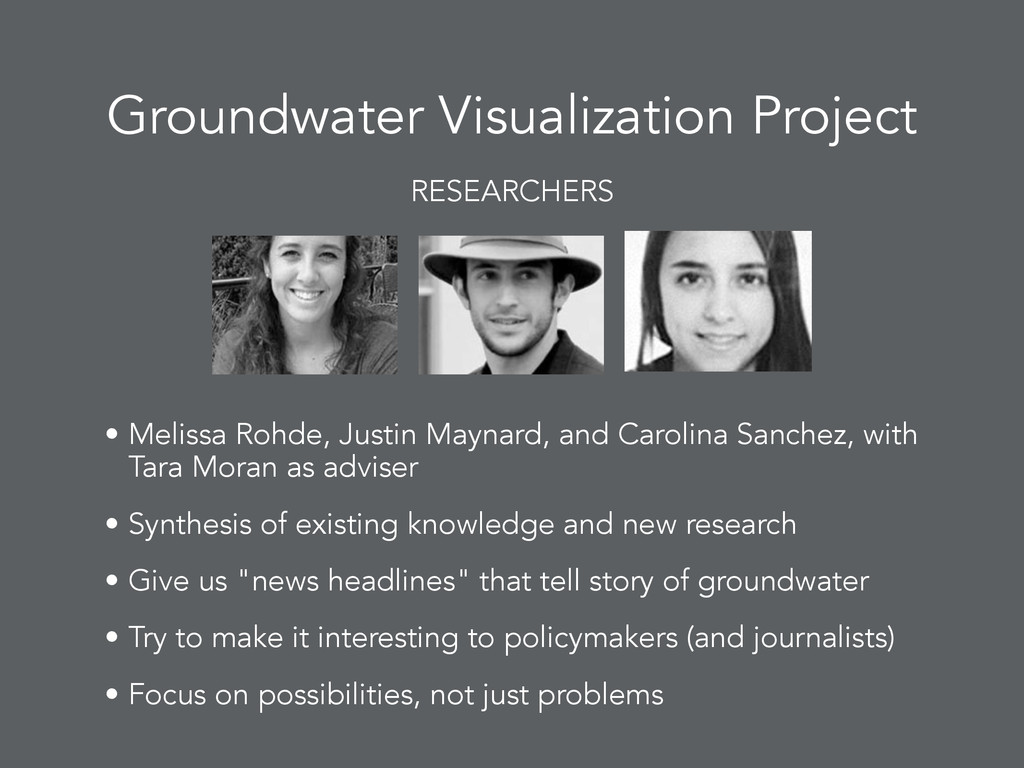
Sanchez, with Tara Moran as adviser • Synthesis of existing knowledge and new research • Give us "news headlines" that tell story of groundwater • Try to make it interesting to policymakers (and journalists) • Focus on possibilities, not just problems RESEARCHERS
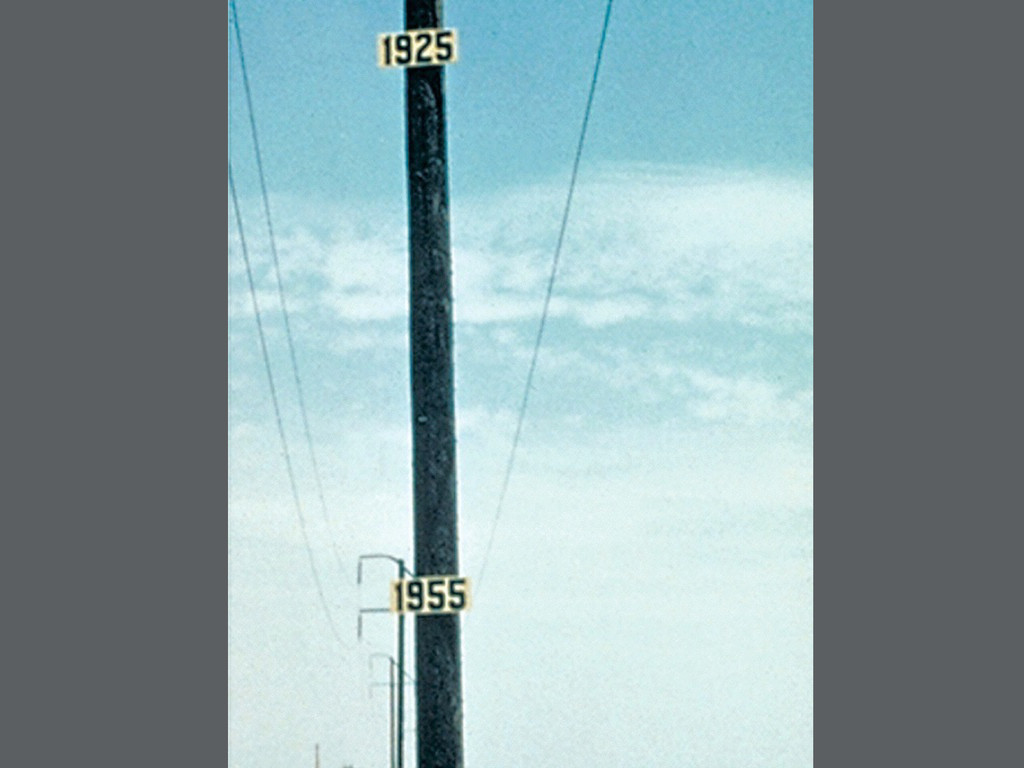
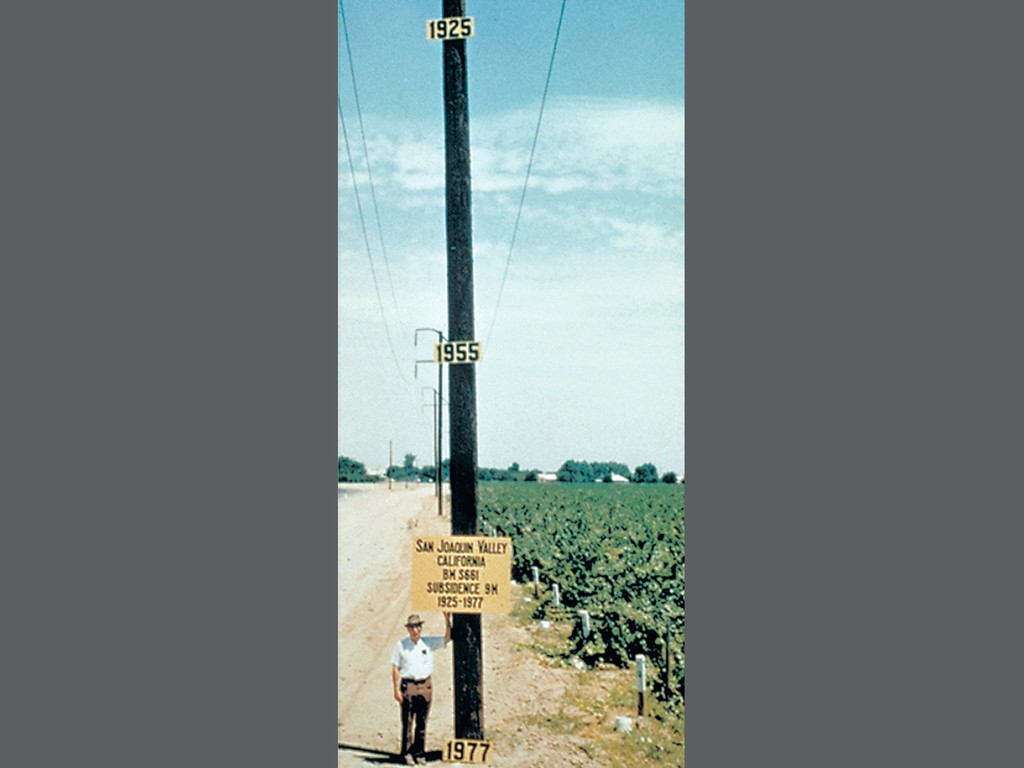
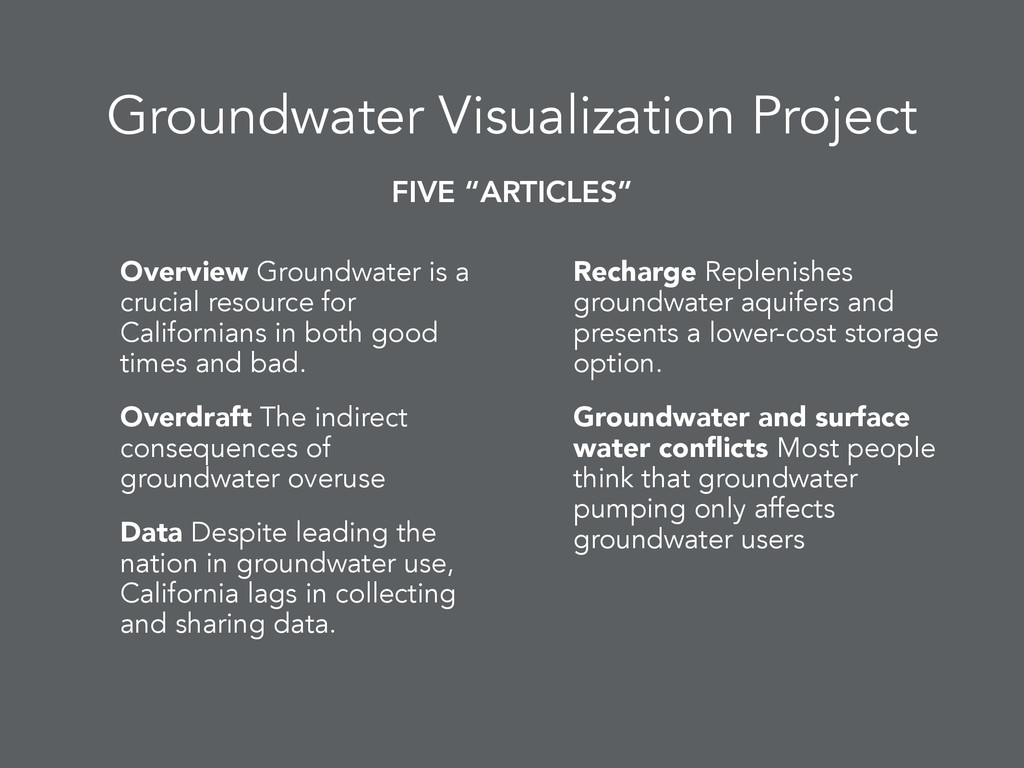
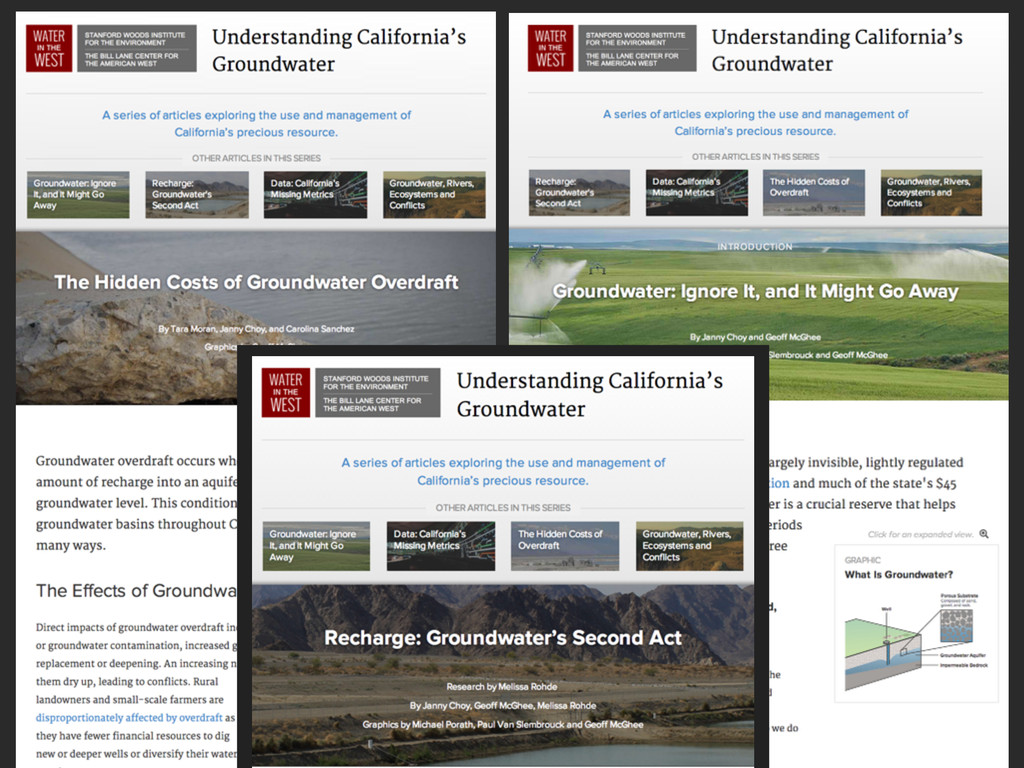
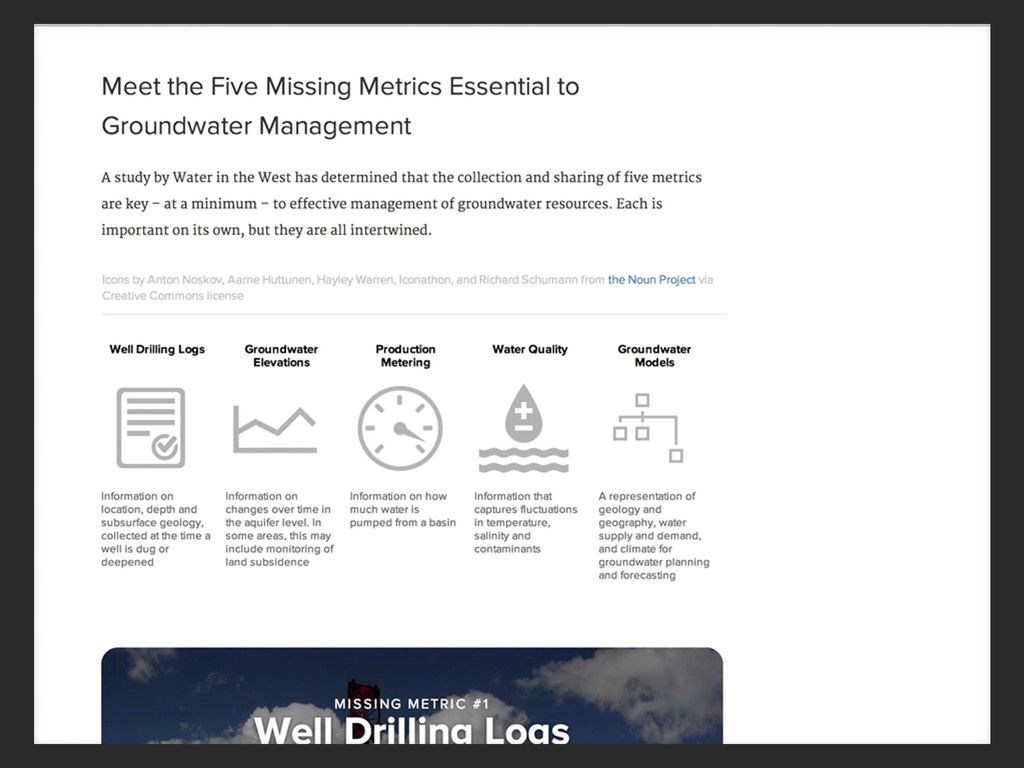
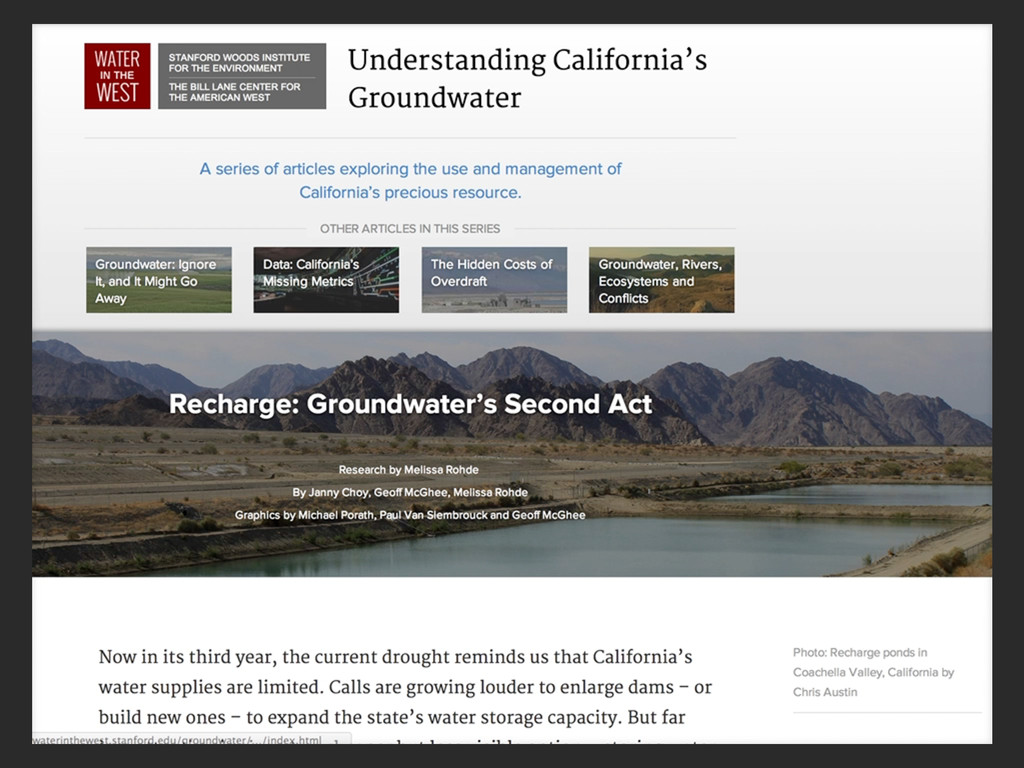
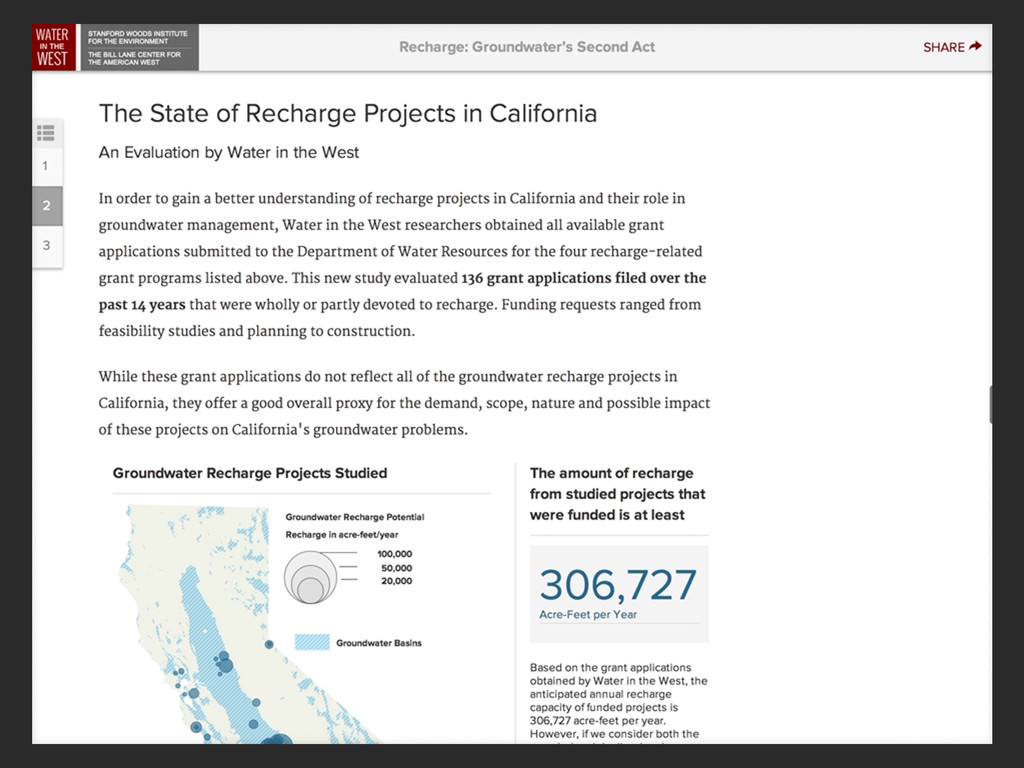
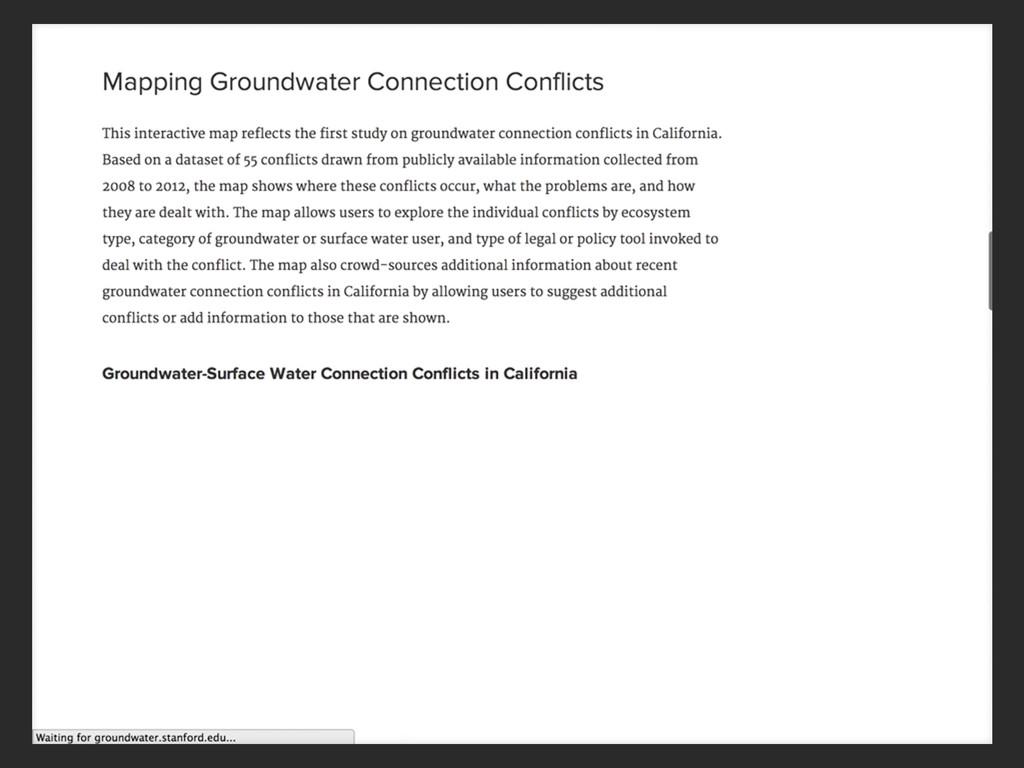
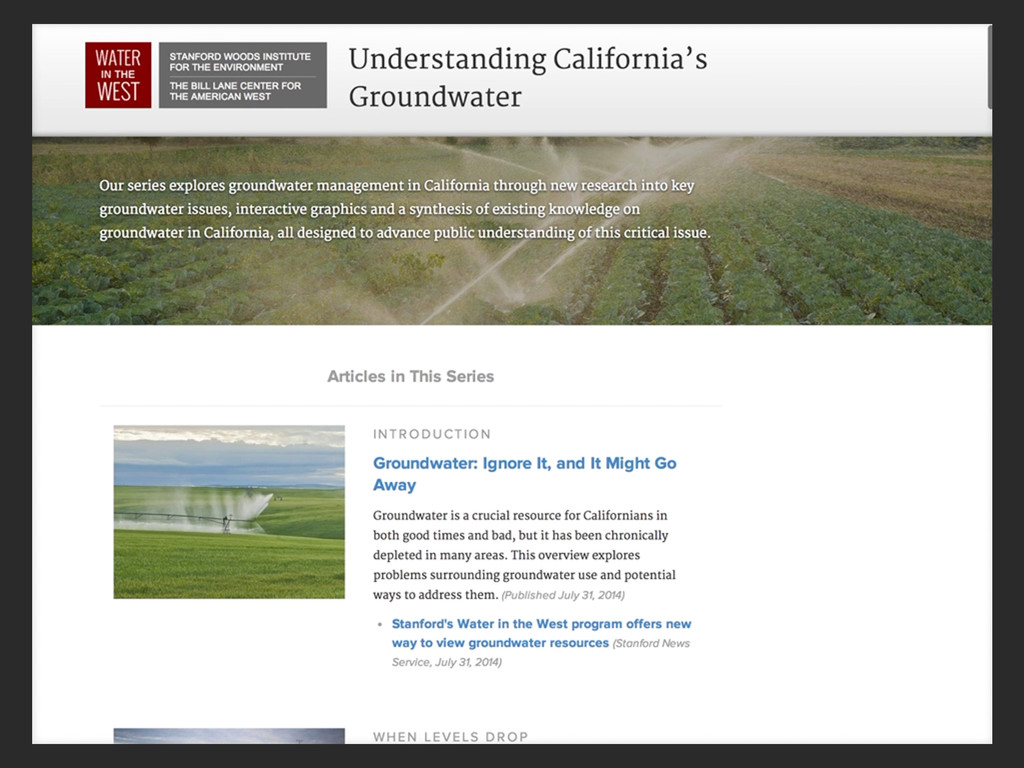
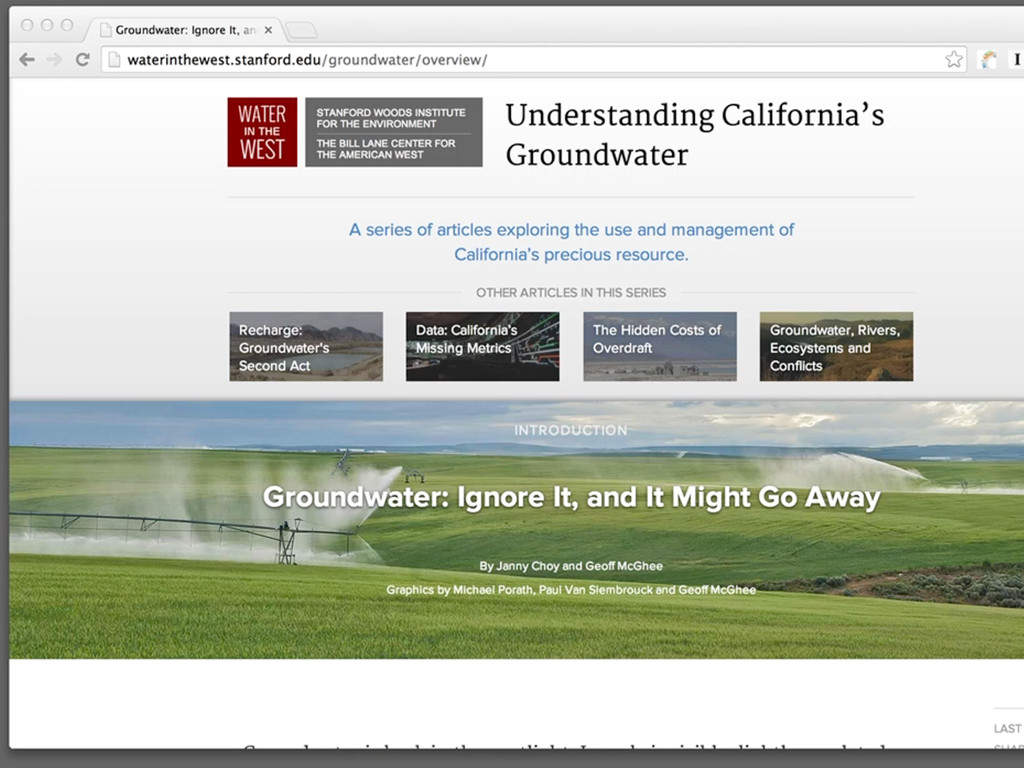
Californians in both good times and bad. Overdraft The indirect consequences of groundwater overuse Data Despite leading the nation in groundwater use, California lags in collecting and sharing data. Recharge Replenishes groundwater aquifers and presents a lower-cost storage option. Groundwater and surface water conflicts Most people think that groundwater pumping only affects groundwater users FIVE “ARTICLES”
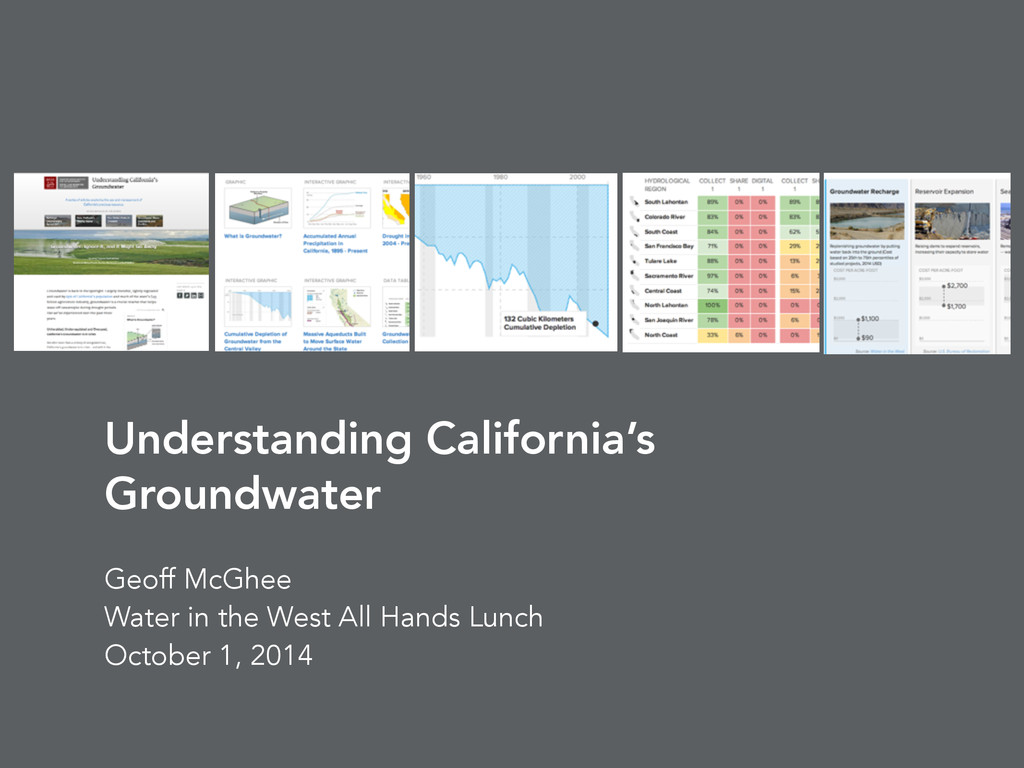
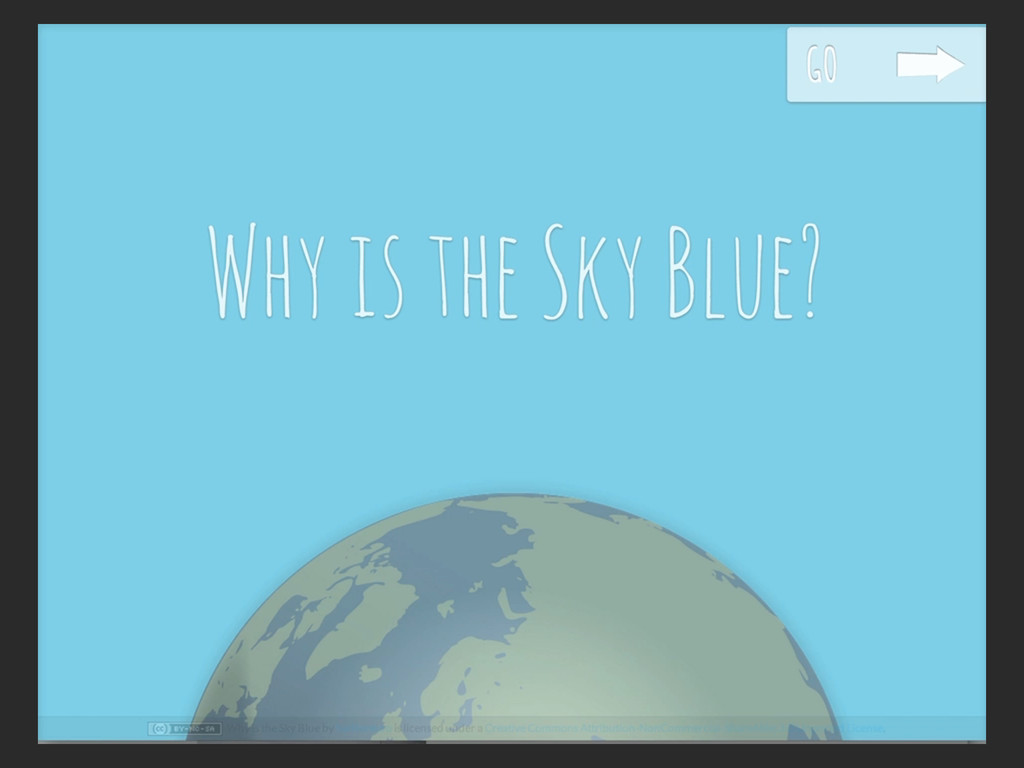
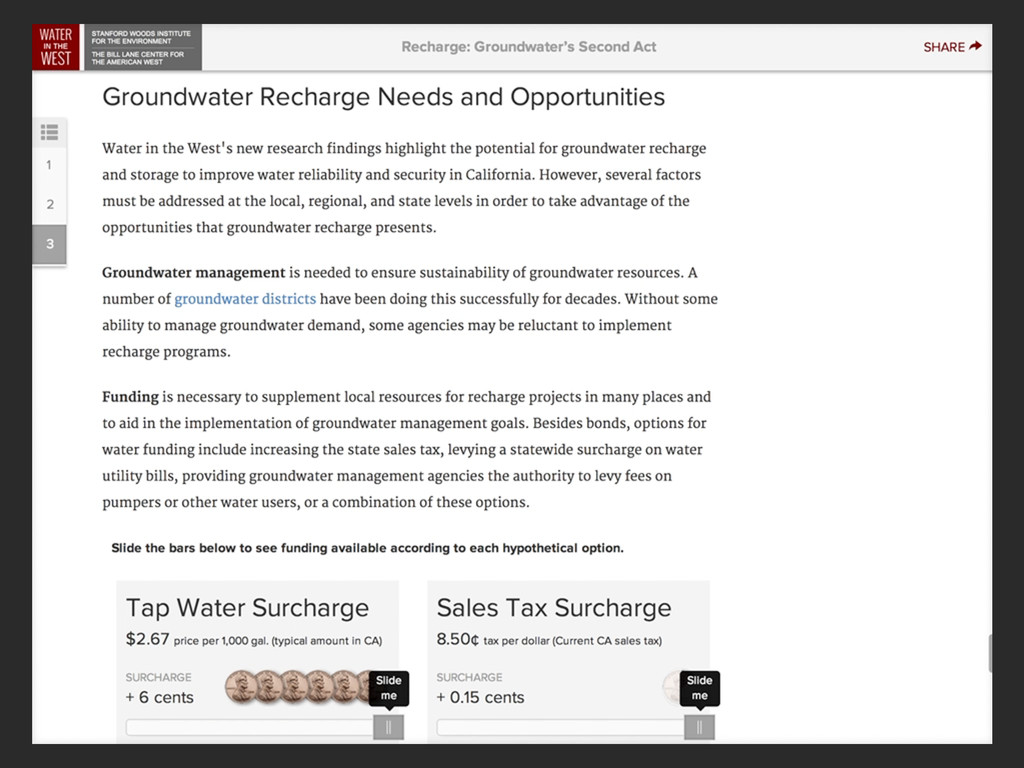
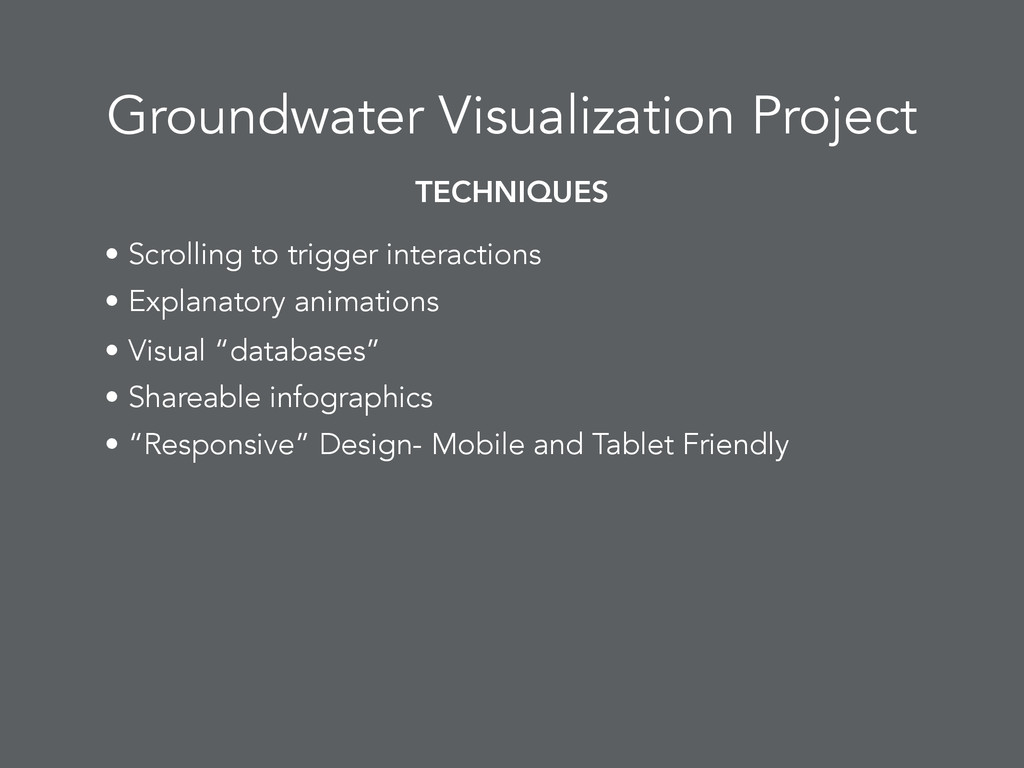
• Inspired by explanatory animations like “why is the sky blue?” ! ! ! • Evolved to become a longer-form article with information graphics and multimedia elements spread throughout • Text and graphics trade off as focus of story ! ! Groundwater Visualization Project FORMAT
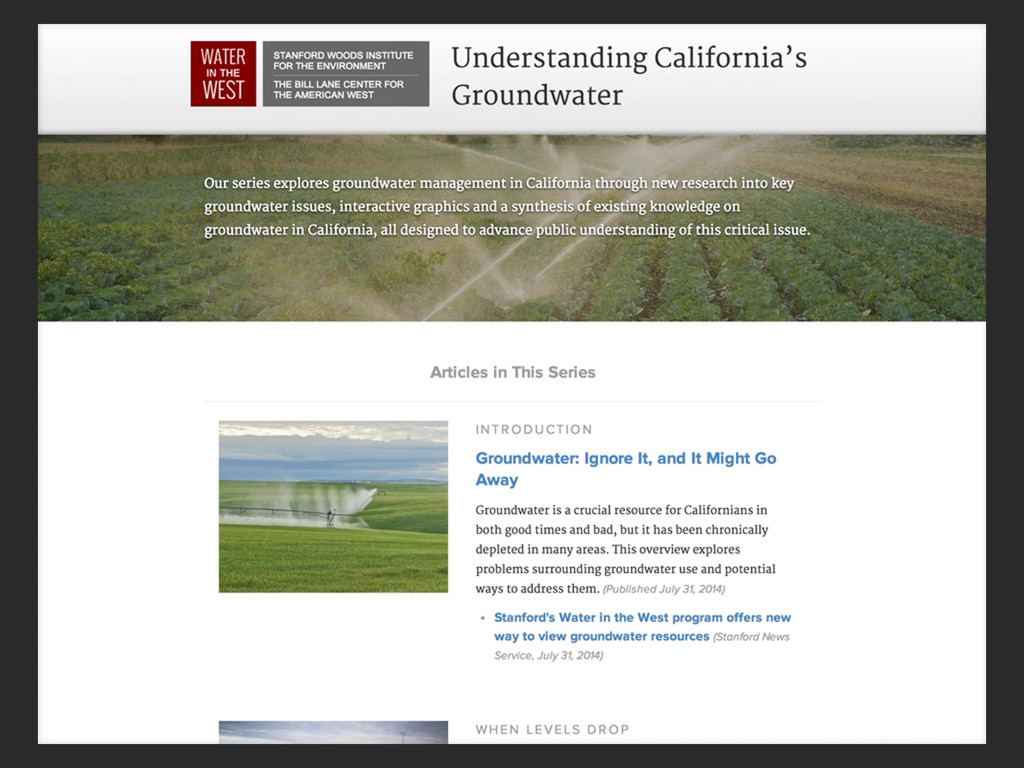
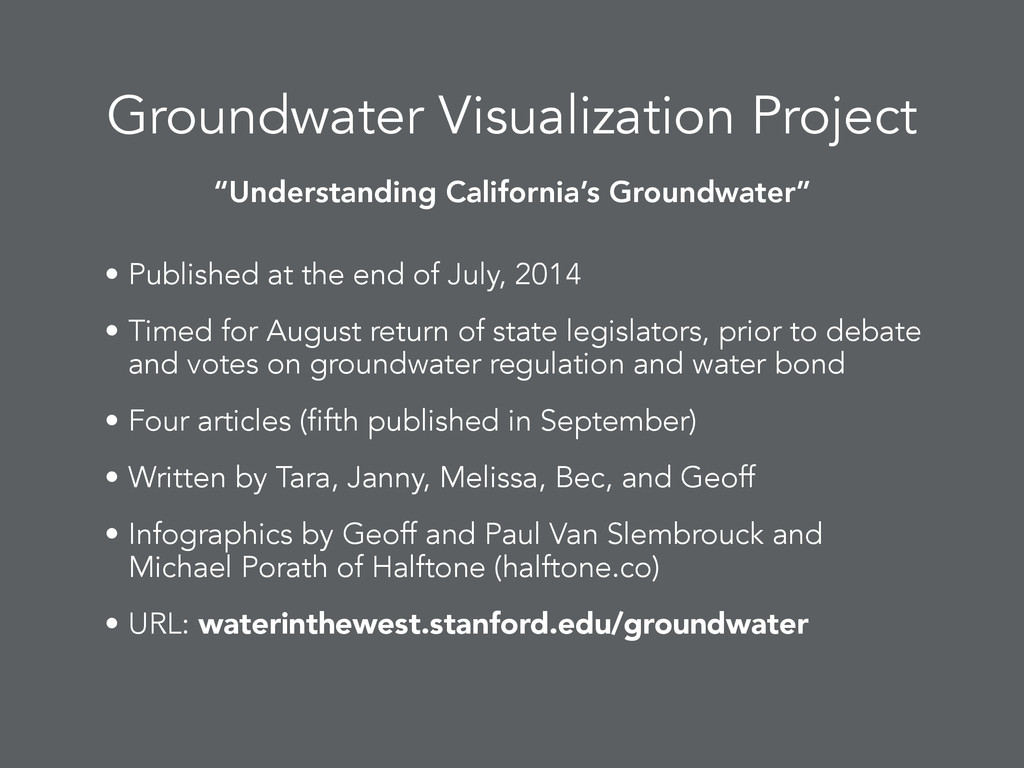
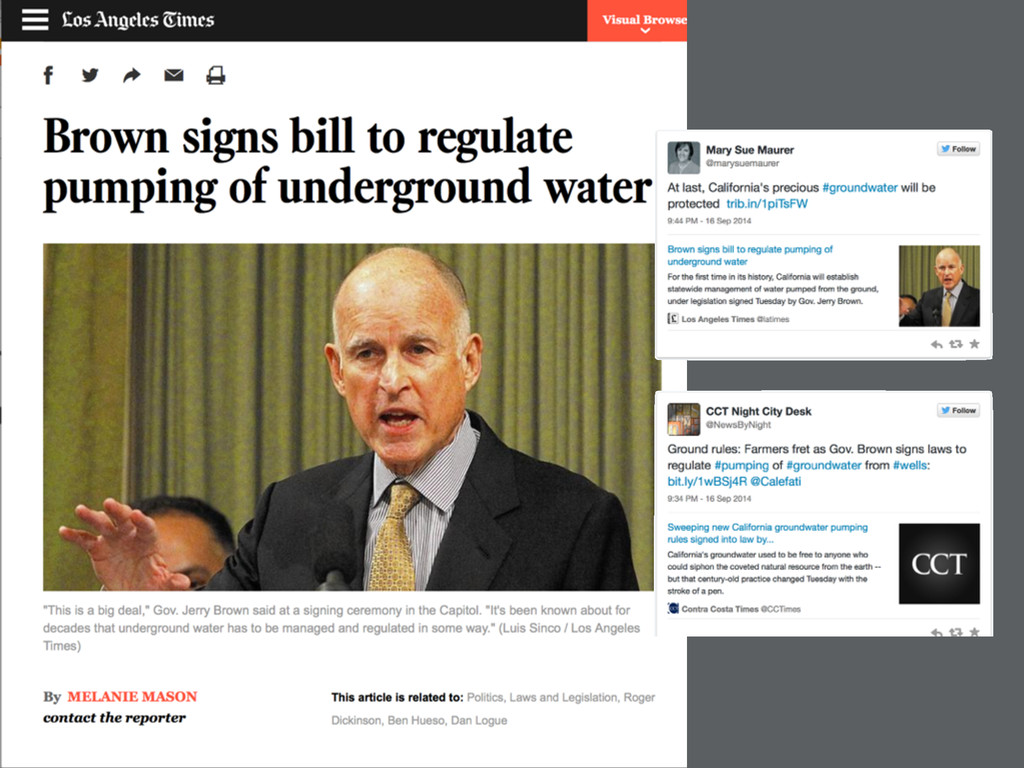
2014 • Timed for August return of state legislators, prior to debate and votes on groundwater regulation and water bond • Four articles (fifth published in September) • Written by Tara, Janny, Melissa, Bec, and Geoff • Infographics by Geoff and Paul Van Slembrouck and Michael Porath of Halftone (halftone.co) • URL: waterinthewest.stanford.edu/groundwater ! “Understanding California’s Groundwater”
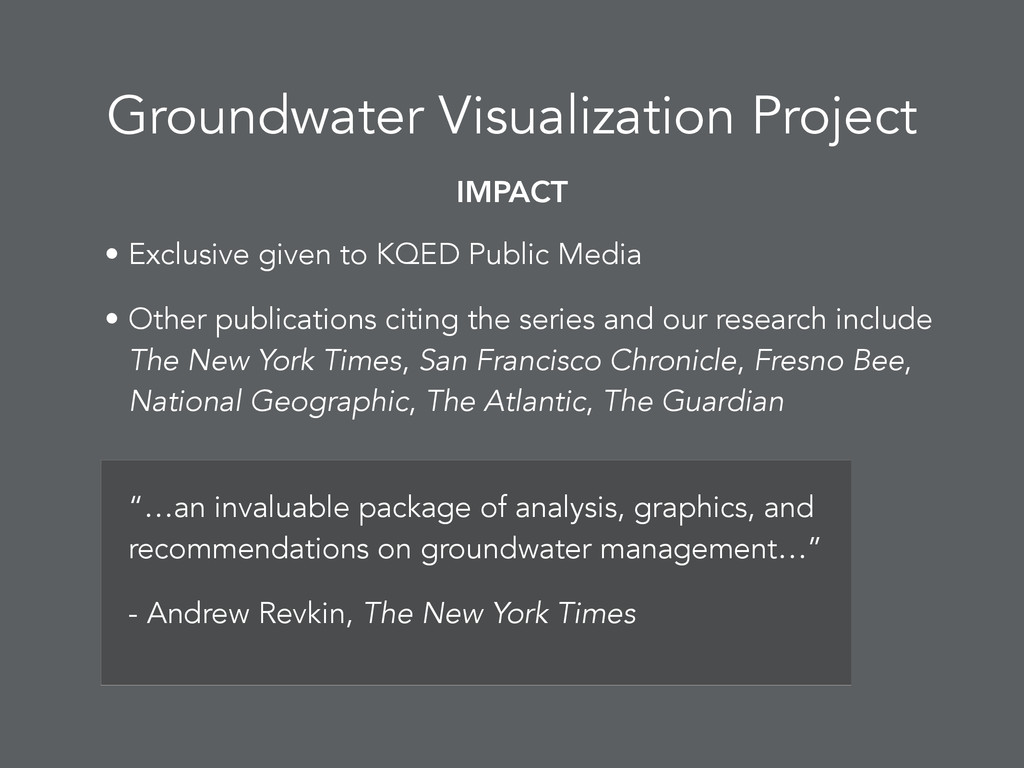
• Other publications citing the series and our research include The New York Times, San Francisco Chronicle, Fresno Bee, National Geographic, The Atlantic, The Guardian “…an invaluable package of analysis, graphics, and recommendations on groundwater management…” - Andrew Revkin, The New York Times IMPACT
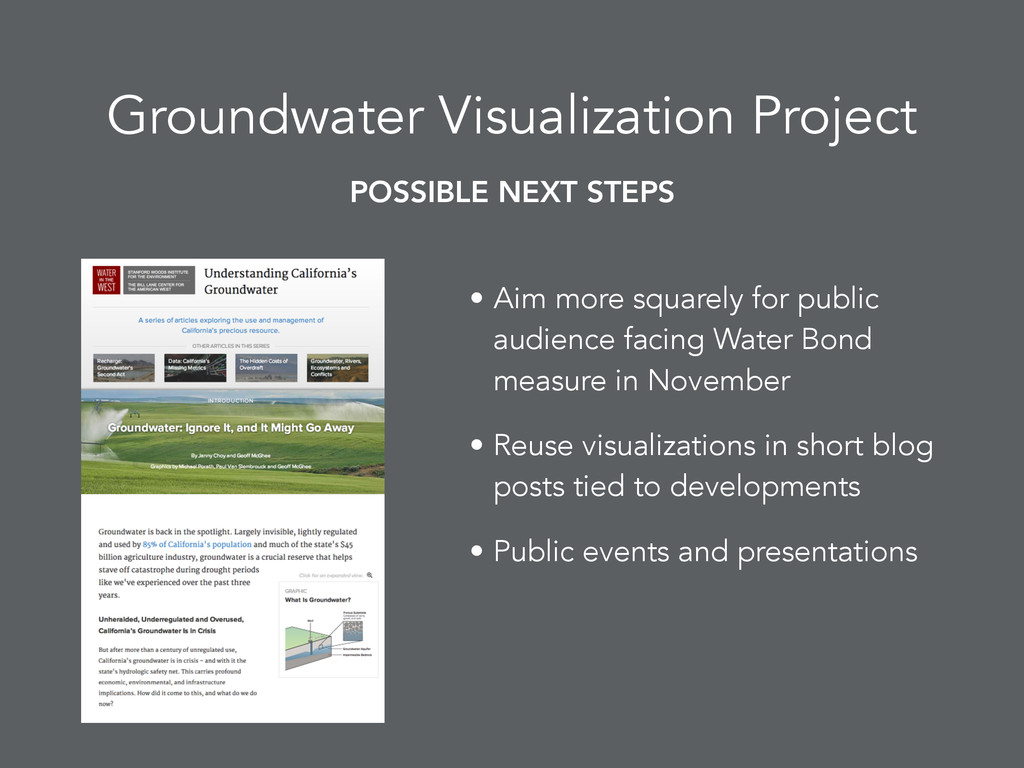
facing Water Bond measure in November • Reuse visualizations in short blog posts tied to developments • Public events and presentations POSSIBLE NEXT STEPS