Upgrade to Pro — share decks privately, control downloads, hide ads and more …

Low level debugging in Ruby

Low level debugging in Ruby

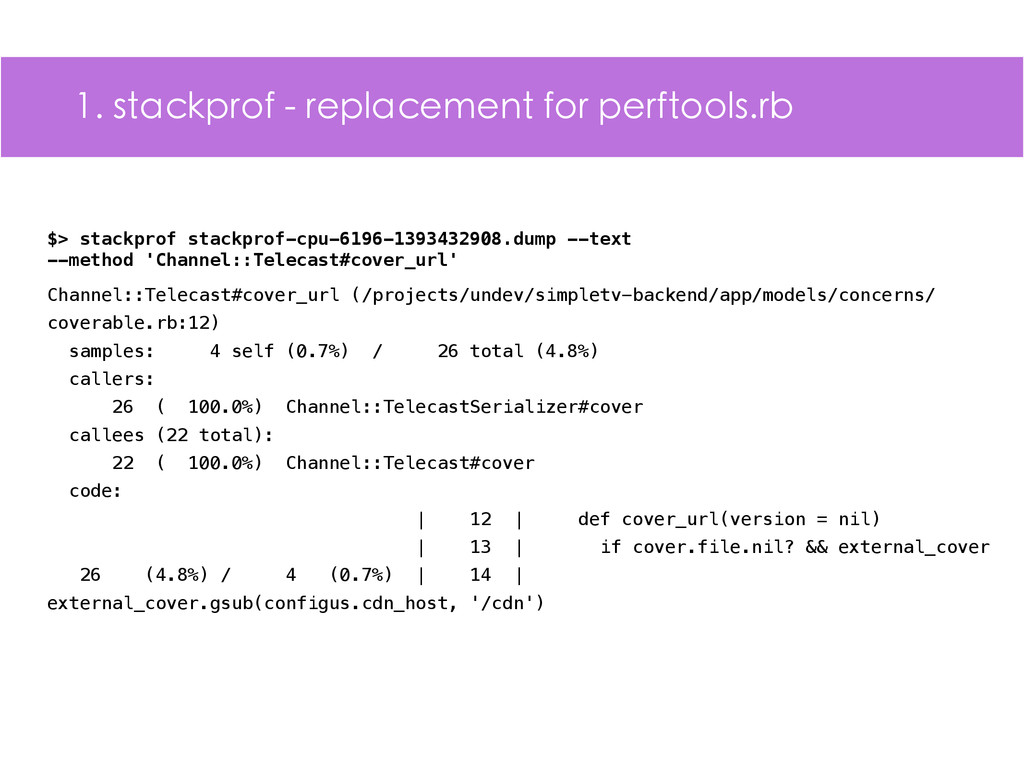
This presentation is devoted to debugging Ruby programs. At the beginning we discussed common tools like lsof, strace, etc.; in the second half - tools from the Ruby world (stackprof, ObjectSpace, byebug, etc.).

Anton Kaliaev

April 02, 2014
Tweet

More Decks by Anton Kaliaev

Other Decks in Programming

Transcript

  1. Software writer at Undev.ru 2 years with Ruby 1 year

    without Rails work on NPTV.com About me
  2. 1. lsof - list open files COMMAND PID USER FD

    TYPE DEVICE SIZE/OFF NODE NAME ruby 4227 vagrant mem REG 8,1 407307 404672 .../pango-2.1.0/pango.so ... ruby 4227 vagrant 0u CHR 136,1 0t0 4 /dev/pts/1 ruby 4227 vagrant 1u CHR 136,1 0t0 4 /dev/pts/1 ruby 4227 vagrant 2u CHR 136,1 0t0 4 /dev/pts/1 ruby 4227 vagrant 3r FIFO 0,8 0t0 50370 pipe ... ruby 4227 vagrant 9u 0000 0,9 0 548 anon_inode ruby 4227 vagrant 10u IPv4 50391 0t0 TCP *:8085 (LISTEN) ruby 4227 vagrant 11u IPv4 50392 0t0 TCP *:8086 (LISTEN) ruby 4227 vagrant 12u IPv4 50400 0t0 TCP 10.0.2.15:8085->10.0.2.2:59542 (ESTABLISHED) ruby 4227 vagrant 13u IPv4 50423 0t0 TCP 10.0.2.15:8086->10.0.2.2:38724 (ESTABLISHED) $> lsof -Pnp 4227
  3. 1. lsof - list open files COMMAND PID USER FD

    TYPE DEVICE SIZE/OFF NODE NAME ruby 7380 vagrant 9u IPv4 27118 0t0 TCP 127.0.0.1:8080 (LISTEN) ruby 7383 vagrant 9u IPv4 27118 0t0 TCP 127.0.0.1:8080 (LISTEN) ruby 7385 vagrant 9u IPv4 27118 0t0 TCP 127.0.0.1:8080 (LISTEN) $> lsof -Pni :8080 $> ps a | grep unicorn 7380 pts/0 Sl+ 0:00 unicorn master -c config/unicorn.rb 7383 pts/0 Sl+ 0:03 unicorn worker[0] -c config/unicorn.rb 7385 pts/0 Sl+ 0:03 unicorn worker[1] -c config/unicorn.rb
  4. 1. lsof - list open files http://ph7spot.com/musings/leveraging-lsof ‣ check service

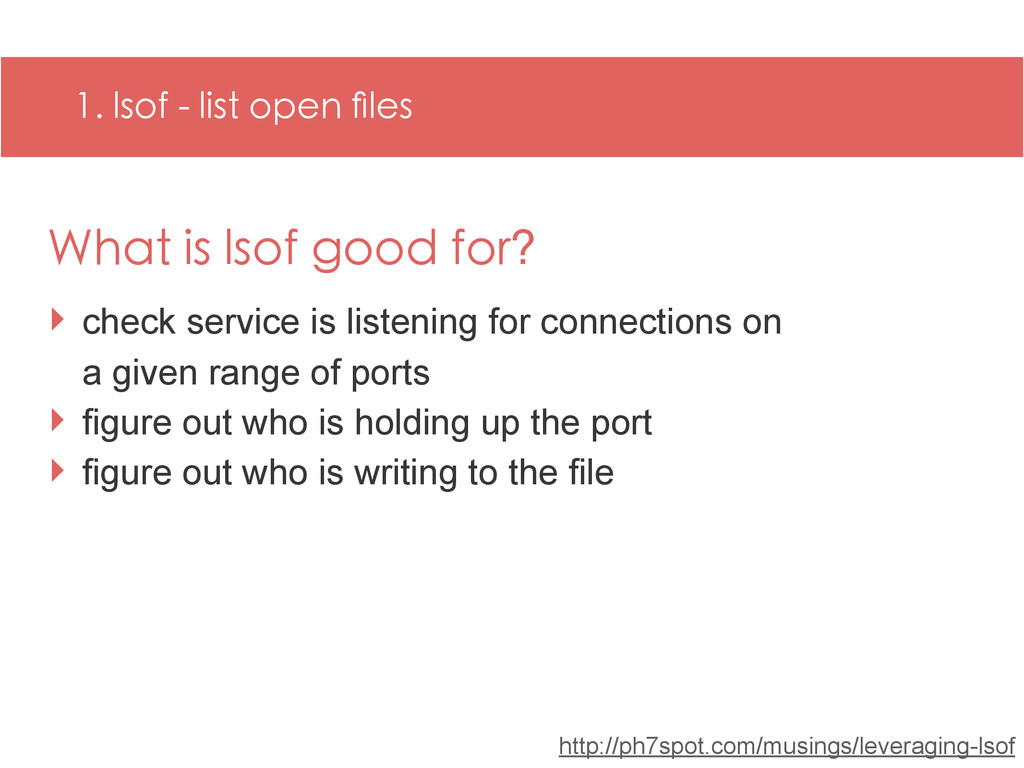
    is listening for connections on a given range of ports ‣ figure out who is holding up the port ‣ figure out who is writing to the file What is lsof good for?
  5. tcpdump tcpdump -i eth0 -s 0 -nqA <expr> (dump traffic

    on a network) tcpdump -w <file> f. Wireshark
  6. 2. tcpdump - dump traffic on a network 18:31:29.140787 IP

    10.0.1.6.52181 > 23.63.125.15.80: Flags [S], seq 1721092979, win 65535, options [mss 1460,nop,wscale 4,nop,nop,TS val 743929763 ecr 0,sackOK,eol], length 0 18:31:29.150866 IP 23.63.125.15.80 > 10.0.1.6.52181: Flags [S.], seq 673593777, ack 1721092980, win 14480, options [mss 1460,sackOK,TS val 1433256622 ecr 743929763,nop,wscale 1], length 0 18:31:29.150908 IP 10.0.1.6.52181 > 23.63.125.15.80: Flags [.], ack 673593778, win 8235, options [nop,nop,TS val 743929773 ecr 1433256622], length 0 $> sudo tcpdump -c 3 -i en3 -nS host 23.63.125.15
  7. 2. tcpdump - dump traffic on a network $> sudo

    tcpdump -n dst port 8086 http://linuxshare.ru/docs/net/tcpdump.html 09:29:17.660075 IP 10.0.2.2.31293 > 10.0.2.15.8086: Flags [S], seq 51904001, win 65535, options [mss 1460], length 0 09:29:17.660284 IP 10.0.2.2.31293 > 10.0.2.15.8086: Flags [.], ack 2547948783, win 65535, length 0 09:29:17.662686 IP 10.0.2.2.31293 > 10.0.2.15.8086: Flags [P.], seq 0:1228, ack 1, win 65535, length 1228 09:29:17.663047 IP 10.0.2.2.31293 > 10.0.2.15.8086: Flags [P.], seq 1228:1466, ack 1, win 65535, length 238 09:29:18.502495 IP 10.0.2.2.31293 > 10.0.2.15.8086: Flags [.], ack 2921, win 65535, length 0 09:29:18.502671 IP 10.0.2.2.31293 > 10.0.2.15.8086: Flags [.], ack 5841, win 65535, length 0
  8. 3. strace - trace system calls and signals % time

    seconds usecs/call calls errors syscall ------ ----------- ----------- --------- --------- ---------------- 24.76 0.075677 30 2555 ppoll 24.75 0.075664 14 5432 623 stat 15.45 0.047238 17 2817 172 read 10.06 0.030761 37 828 lstat 9.75 0.029787 37 798 493 open 5.38 0.016456 29 559 fstat 3.50 0.010701 9 1209 rt_sigprocmask 2.24 0.006857 4 1935 write 1.92 0.005872 41 142 142 ioctl 0.52 0.001586 9 176 17 epoll_ctl 0.29 0.000876 3 254 getcwd 0.27 0.000830 2 359 brk 0.27 0.000821 3 314 epoll_wait 0.21 0.000642 6 109 writev 0.20 0.000604 2 328 close 0.13 0.000385 4 108 getegid 0.10 0.000309 21 15 getpeername 0.09 0.000269 7 41 mmap 0.05 0.000164 5 33 8 access 0.05 0.000164 164 1 wait4 $> strace -cp 4391
  9. 3. strace - trace system calls and signals open("<path-to-ruby>/gems/http_parser.rb-0.6.0/lib/sfk/bootstrap/views/pages.rb", O_RDONLY)

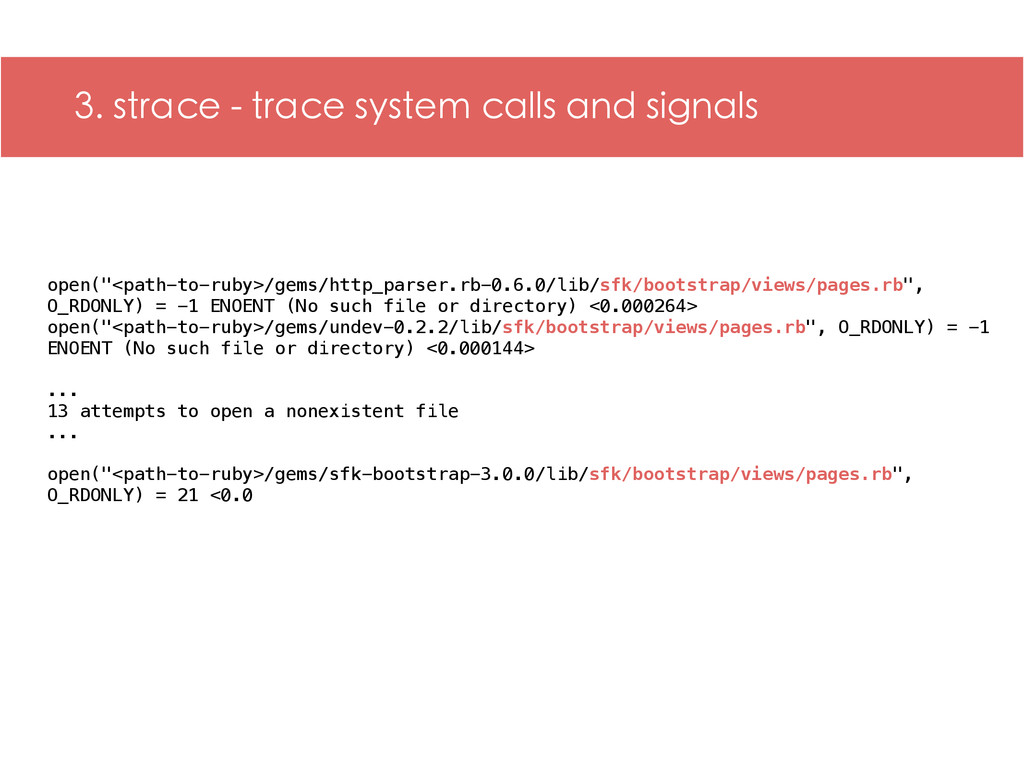
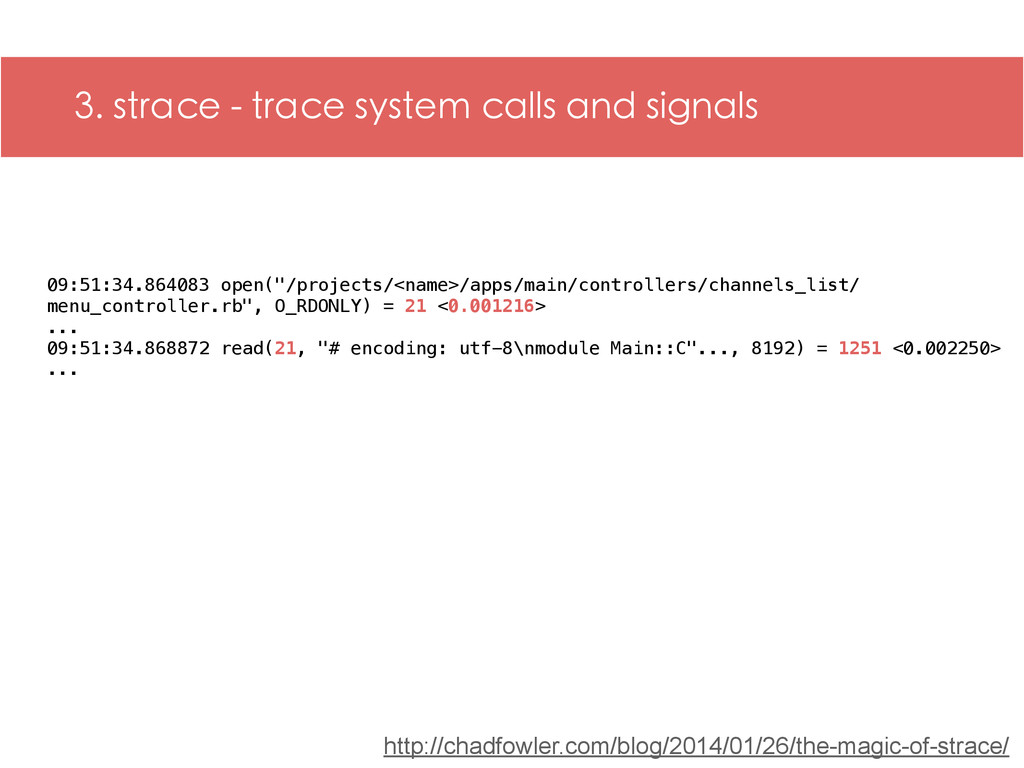
    = -1 ENOENT (No such file or directory) <0.000264> open("<path-to-ruby>/gems/undev-0.2.2/lib/sfk/bootstrap/views/pages.rb", O_RDONLY) = -1 ENOENT (No such file or directory) <0.000144> ... 13 attempts to open a nonexistent file ... open("<path-to-ruby>/gems/sfk-bootstrap-3.0.0/lib/sfk/bootstrap/views/pages.rb", O_RDONLY) = 21 <0.0
  10. 3. strace - trace system calls and signals 09:51:34.864083 open("/projects/<name>/apps/main/controllers/channels_list/

    menu_controller.rb", O_RDONLY) = 21 <0.001216> ... 09:51:34.868872 read(21, "# encoding: utf-8\nmodule Main::C"..., 8192) = 1251 <0.002250> ... http://chadfowler.com/blog/2014/01/26/the-magic-of-strace/
  11. 4. GDB - the GNU debugger http://robots.thoughtbot.com/using-gdb-to-inspect-a-running-ruby-process $> gdb /path/to/ruby

    9851 (gdb) ruby_eval "Kernel.caller" => ["/home/vagrant/.rvm/gems/ruby-2.0.0-p353/gems/unicorn-4.8.2/lib/unicorn/http_server.rb: 388:in `select'", "/home/vagrant/.rvm/gems/ruby-2.0.0-p353/gems/unicorn-4.8.2/lib/unicorn/http_server.rb: 388:in `master_sleep'", "/home/vagrant/.rvm/gems/ruby-2.0.0-p353/gems/unicorn-4.8.2/lib/unicorn/http_server.rb: 291:in `join'", "/home/vagrant/.rvm/gems/ruby-2.0.0-p353/gems/unicorn-4.8.2/bin/unicorn:126:in `<top (required)>'", "/home/vagrant/.rvm/gems/ruby-2.0.0-p353/bin/unicorn:23:in `load'", "/home/vagrant/.rvm/gems/ruby-2.0.0-p353/bin/unicorn:23:in `<main>'", "/home/vagrant/.rvm/gems/ruby-2.0.0-p353/bin/ruby_executable_hooks:15:in `eval'", "/home/vagrant/.rvm/gems/ruby-2.0.0-p353/bin/ruby_executable_hooks:15:in `<main>'"]
  12. 4. GDB - the GNU debugger $> gdb /path/to/ruby 9851

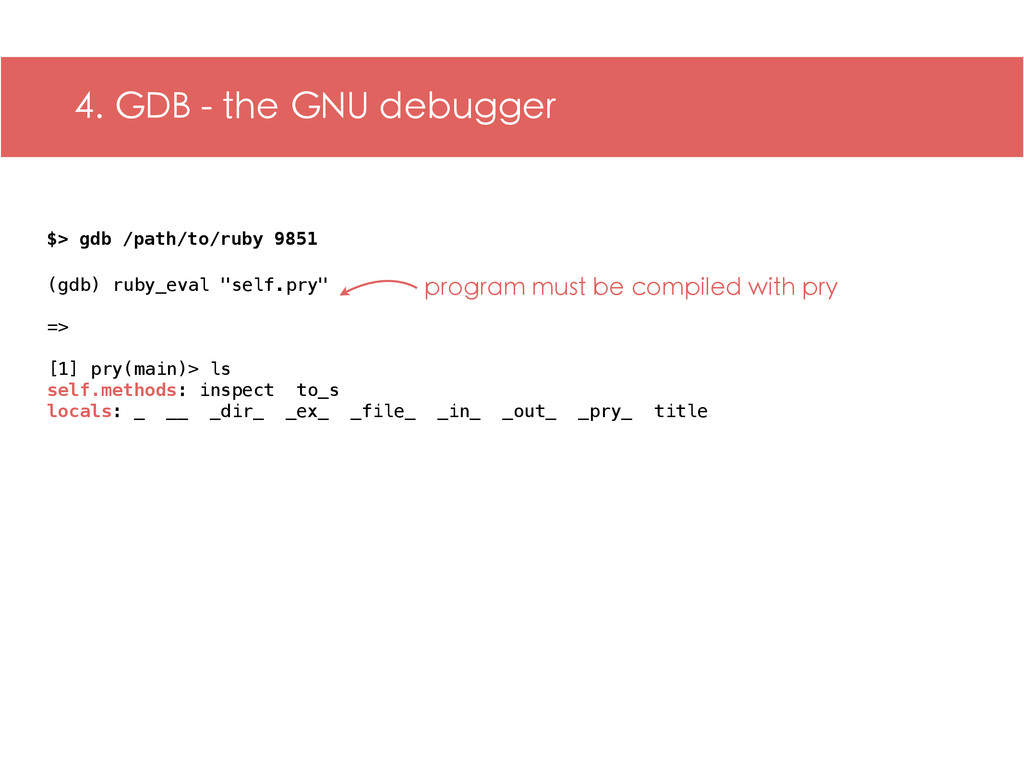
    (gdb) ruby_eval "self.pry" => [1] pry(main)> ls self.methods: inspect to_s locals: _ __ _dir_ _ex_ _file_ _in_ _out_ _pry_ title program must be compiled with pry
  13. 4. GDB - the GNU debugger ‣ ptrace() system call

    ‣ breakpoints via INT 3 instruction How gdb works http://aosabook.org/en/gdb.html http://www.alexonlinux.com/how-debugger-works 0000000000400508 <main>: 400508: 55 push %rbp 400509: 48 89 e5 mov %rsp,%rbp 40050c: bf 18 06 40 00 mov $0x400618,%edi 400511: e8 12 ff ff ff callq 400428 <puts@plt> 400516: bf 2a 06 40 00 mov $0x40062a,%edi 40051b: e8 08 ff ff ff callq 400428 <puts@plt> 400520: b8 00 00 00 00 mov $0x0,%eax 400525: c9 leaveq 400526: c3 retq replaced with 0xcc
  14. 1. stackprof - replacement for perftools.rb ================================== Mode: cpu(1000) Samples:

    545 (0.00% miss rate) GC: 48 (8.81%) ================================== TOTAL (pct) SAMPLES (pct) FRAME 42 (7.7%) 39 (7.2%) #<Module:0x000000020550f8>.escape 33 (6.1%) 23 (4.2%) ActiveRecord::ConnectionAdapters::Column.new_time 21 (3.9%) 21 (3.9%) Set#include? 13 (2.4%) 13 (2.4%) block in ActiveSupport::Dependencies#search_for_file 13 (2.4%) 13 (2.4%) block in ActiveSupport::Dependencies#autoloadable_module? 26 (4.8%) 4 (0.7%) Channel::Telecast#cover_url $> stackprof stackprof-cpu-6196-1393432908.dump --text
  15. 1. stackprof - replacement for perftools.rb Channel::Telecast#cover_url (/projects/undev/simpletv-backend/app/models/concerns/ coverable.rb:12) samples:

    4 self (0.7%) / 26 total (4.8%) callers: 26 ( 100.0%) Channel::TelecastSerializer#cover callees (22 total): 22 ( 100.0%) Channel::Telecast#cover code: | 12 | def cover_url(version = nil) | 13 | if cover.file.nil? && external_cover 26 (4.8%) / 4 (0.7%) | 14 | external_cover.gsub(configus.cdn_host, '/cdn') $> stackprof stackprof-cpu-6196-1393432908.dump --text --method 'Channel::Telecast#cover_url'
  16. 1. stackprof - replacement for perftools.rb ‣ wall (using ITIMER_REAL

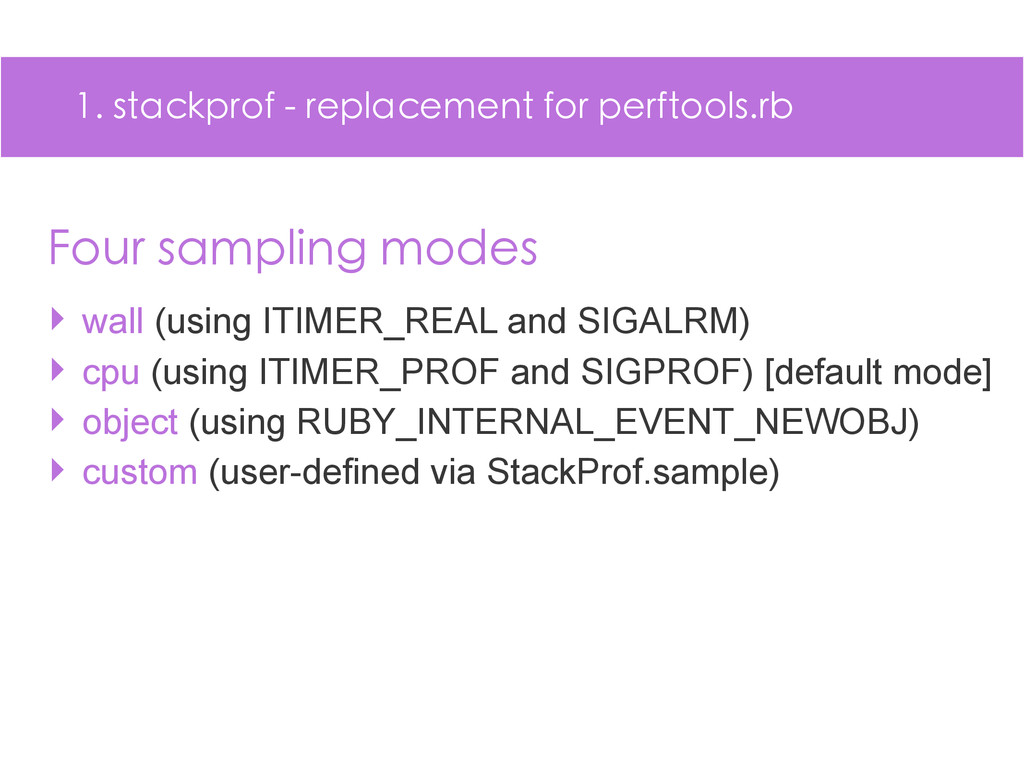
    and SIGALRM) ‣ cpu (using ITIMER_PROF and SIGPROF) [default mode] ‣ object (using RUBY_INTERNAL_EVENT_NEWOBJ) ‣ custom (user-defined via StackProf.sample) Four sampling modes
  17. 2. ObjectSpace - traversing live objects http://cirw.in/blog/find-references # diff will

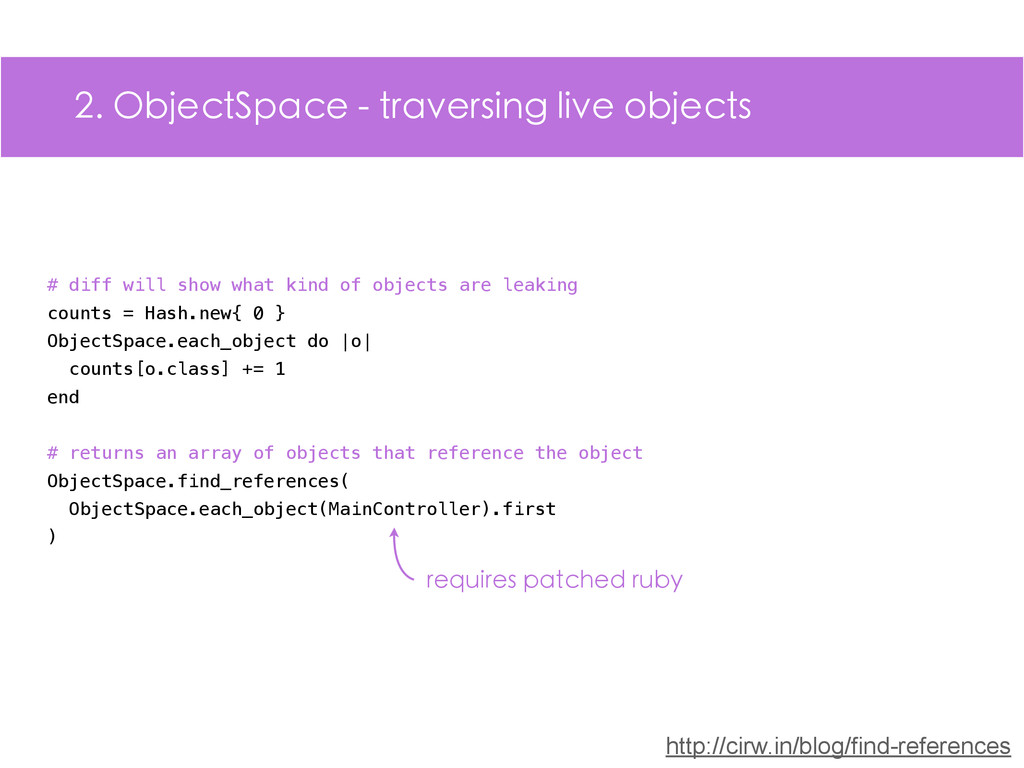
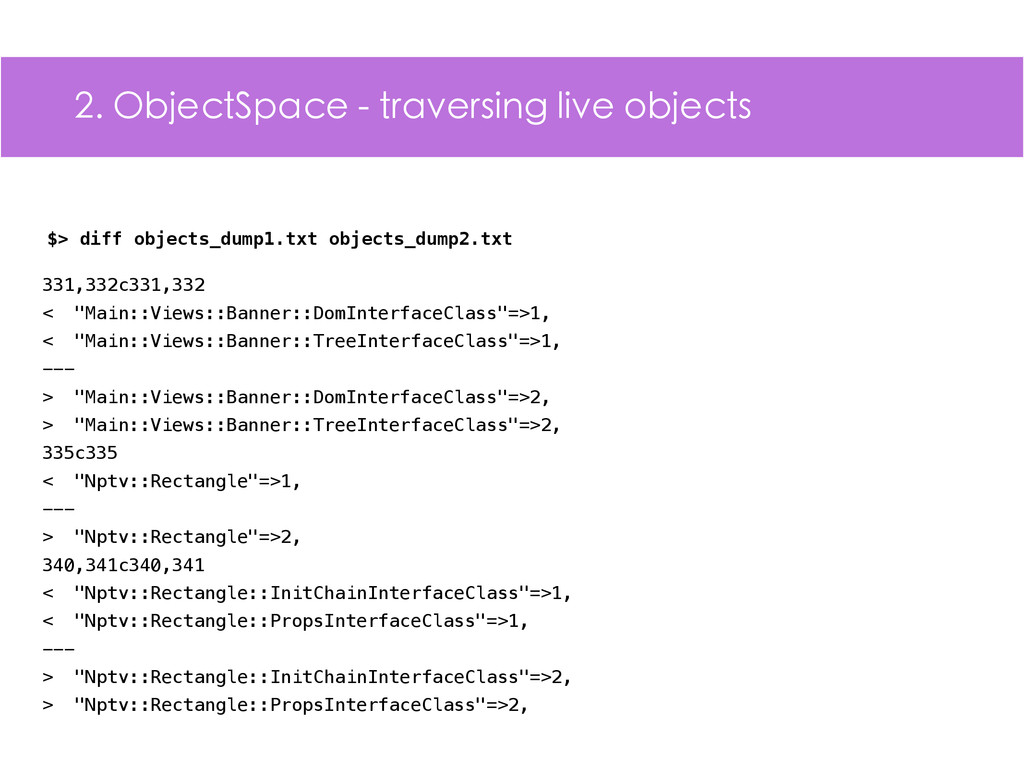
    show what kind of objects are leaking counts = Hash.new{ 0 } ObjectSpace.each_object do |o| counts[o.class] += 1 end # returns an array of objects that reference the object ObjectSpace.find_references( ObjectSpace.each_object(MainController).first ) requires patched ruby
  18. 2. ObjectSpace - traversing live objects 331,332c331,332 < "Main::Views::Banner::DomInterfaceClass"=>1, <

    "Main::Views::Banner::TreeInterfaceClass"=>1, --- > "Main::Views::Banner::DomInterfaceClass"=>2, > "Main::Views::Banner::TreeInterfaceClass"=>2, 335c335 < "Nptv::Rectangle"=>1, --- > "Nptv::Rectangle"=>2, 340,341c340,341 < "Nptv::Rectangle::InitChainInterfaceClass"=>1, < "Nptv::Rectangle::PropsInterfaceClass"=>1, --- > "Nptv::Rectangle::InitChainInterfaceClass"=>2, > "Nptv::Rectangle::PropsInterfaceClass"=>2, $> diff objects_dump1.txt objects_dump2.txt
  19. 3. AllocationStats - tracing object allocations sourcefile class count ----------------------------------------

    ------------------------------------ ----- <RUBYLIBDIR>/psych/visitors/yaml_tree.rb Array 12 <RUBYLIBDIR>/psych/visitors/yaml_tree.rb String 20 <RUBYLIBDIR>/psych/visitors/yaml_tree.rb MatchData 3 <RUBYLIBDIR>/psych/visitors/yaml_tree.rb Method 5 <RUBYLIBDIR>/psych/nodes/node.rb Array 3 (eval) Psych::Nodes::Sequence 1 <RUBYLIBDIR>/psych/tree_builder.rb Psych::Nodes::Document 1 <RUBYLIBDIR>/psych/tree_builder.rb Psych::Nodes::Stream 1 <RUBYLIBDIR>/psych/visitors/yaml_tree.rb Proc 1 <RUBYLIBDIR>/psych/visitors/yaml_tree.rb RubyVM::Env 1 <RUBYLIBDIR>/psych/visitors/yaml_tree.rb Hash 3 stats = AllocationStats.trace do y = YAML.dump(["one string", "two string"]) end puts stats.allocations(alias_paths: true).group_by(:sourcefile, :class).to_text
  20. ObjectSpace require 'objspace' class C include ObjectSpace def foo trace_object_allocations

    do obj = Object.new p "#{allocation_sourcefile(obj)}:#{allocation_sourceline(obj)}" end end end C.new.foo #=> "objtrace.rb:8"
  21. 4. rbtrace - trace ruby method calls $> rbtrace -p

    10788 --slow=500 Array#map <1.141959> BasicObject#instance_exec <1.142354> Proc#call <1.144842> SFK::Http::Request#run_callback <1.144969> Array#each <1.145001> SFK::Http::Request#run_callbacks <1.145026> SFK::Http::Request#parse_response <1.193339> Proc#call <1.193364> EventMachine::Deferrable#set_deferred_status <1.201030> EventMachine::Deferrable#succeed <1.201062> EventMachine::HttpClient#unbind <1.202498> EventMachine::HttpClient#on_request_complete <1.202530> Proc#call <1.202781> HTTP::Parser#<< <1.202871> EventMachine::HttpConnection#receive_data <1.202889> EventMachine::HttpStubConnection#receive_data <1.203051
  22. 5. byebug - Ruby 2.X debugger $> byebug triangle.rb [1,

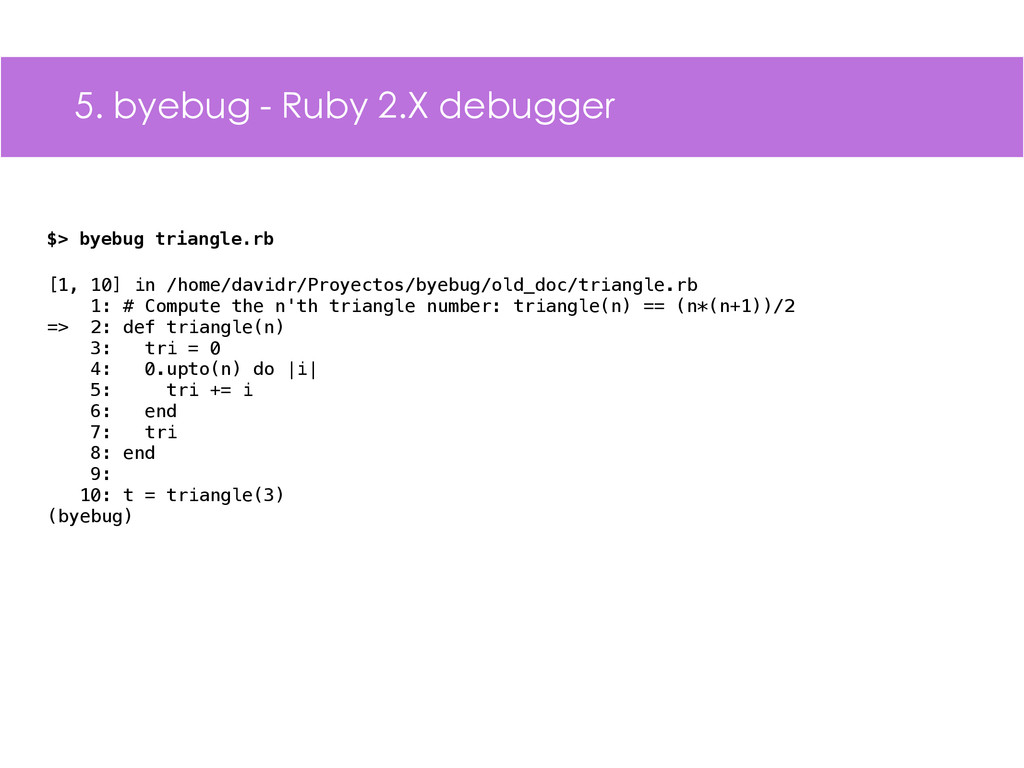
    10] in /home/davidr/Proyectos/byebug/old_doc/triangle.rb 1: # Compute the n'th triangle number: triangle(n) == (n*(n+1))/2 => 2: def triangle(n) 3: tri = 0 4: 0.upto(n) do |i| 5: tri += i 6: end 7: tri 8: end 9: 10: t = triangle(3) (byebug)
  23. TracePoint API trace = TracePoint.new(:call) do |tp| p [tp.lineno, tp.defined_class,

    tp.method_id, tp.event] end #=> #<TracePoint:0x007f17372cdb20> trace.enable #=> #<TracePoint:0x007f17372cdb20> puts "Hello, TracePoint!" # ... # [48, IRB::Notifier::AbstractNotifier, :printf, :call] # ...