Upgrade to Pro — share decks privately, control downloads, hide ads and more …

Testing of Sensor Observation Services: A Performance Evaluation

Testing of Sensor Observation Services: A Performance Evaluation

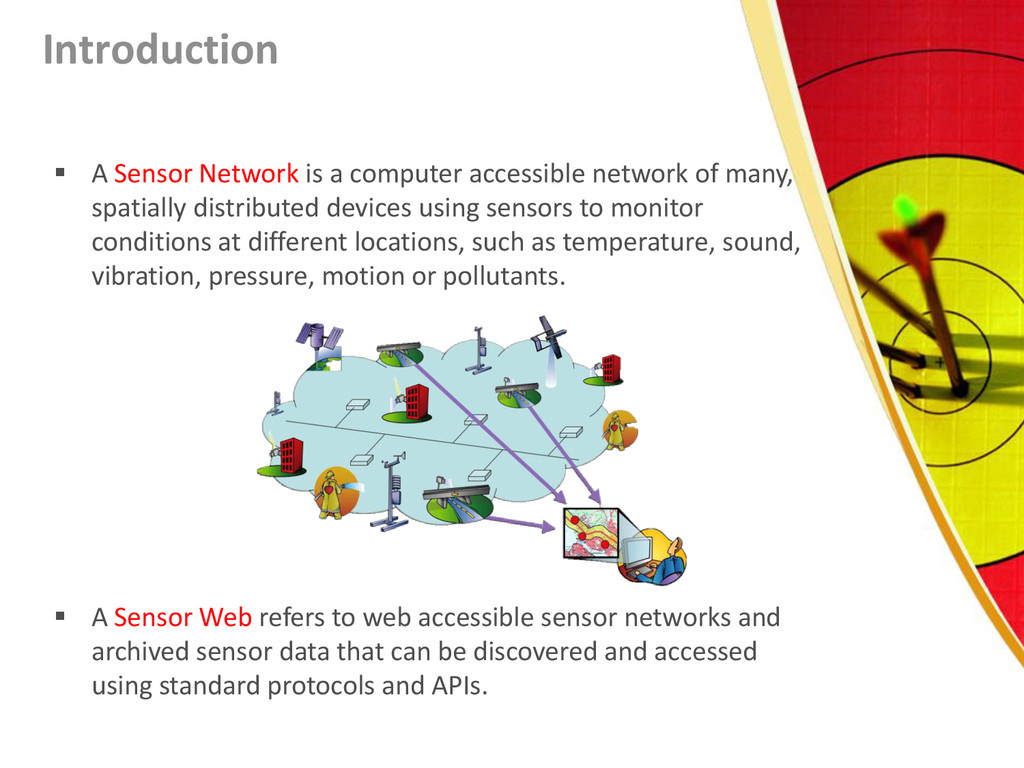
Recently, sensor webs have been increasingly used to monitor and sense a multitude of observations for various applications, from simple phenomena, such as air pollution measurements, to
complex events, for instance perimeter security, or effluent
tracking. Therefore, the performance of sensor data delivery
mechanisms is becoming more and more important to ensure that services dependent upon sensor web technology perform
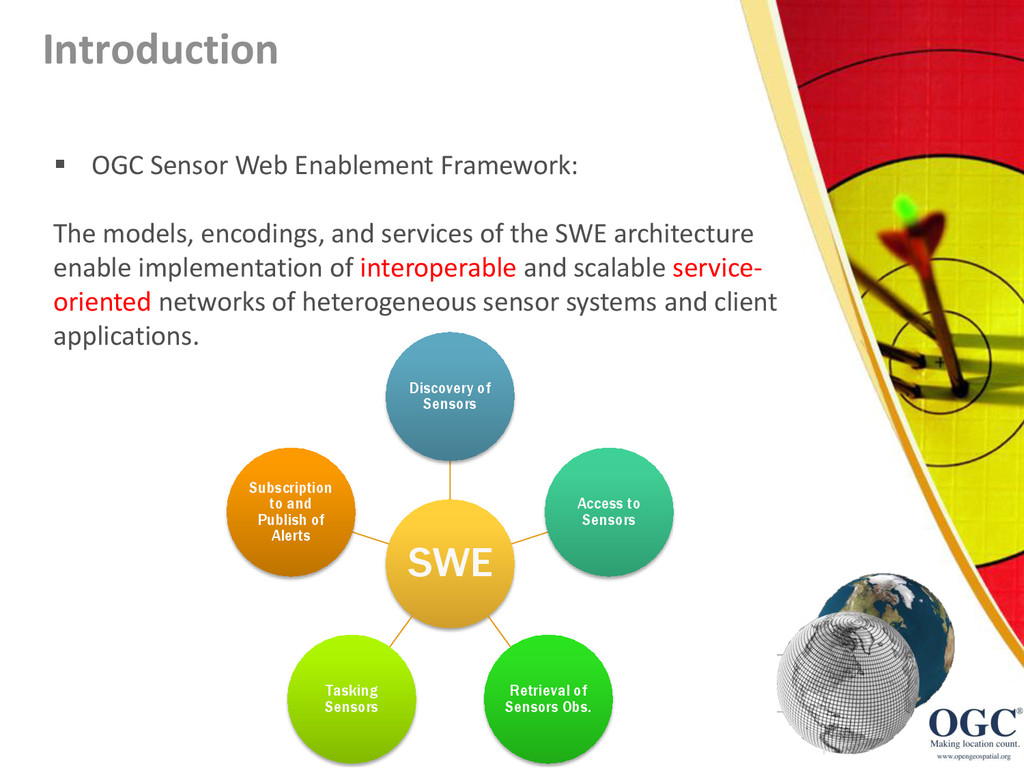
satisfactorily. In the Open Geospatial Consortium (OGC) Sensor
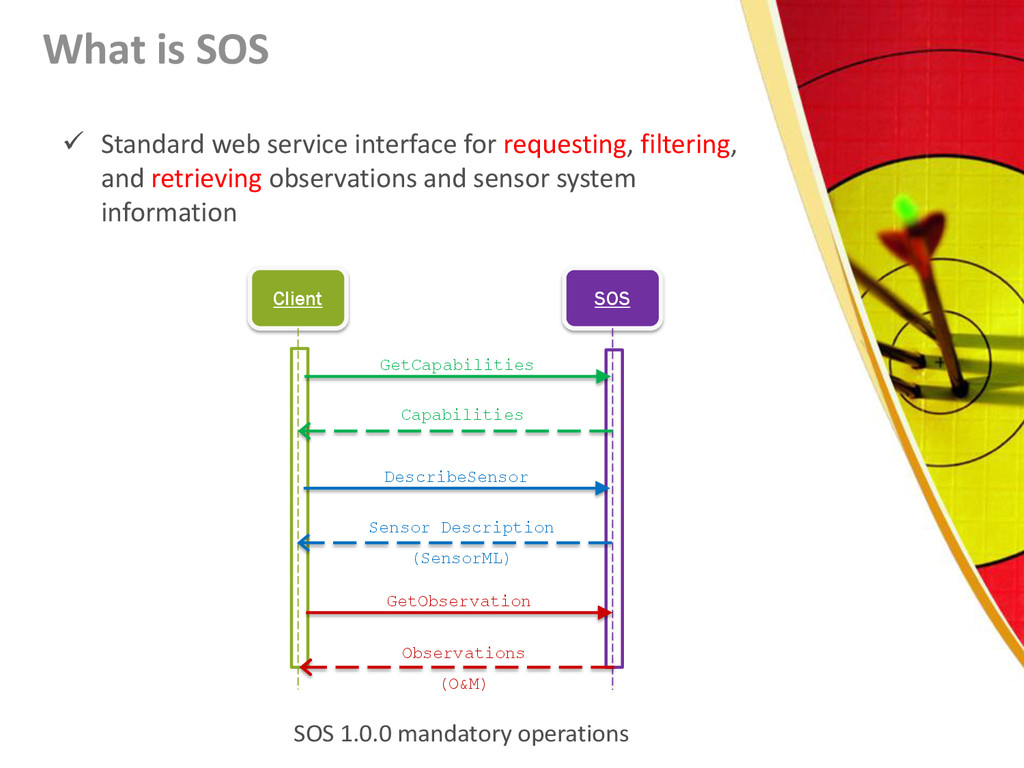
Web Enablement (SWE) framework, Sensor Observation Service
(SOS) is a standard web service interface responsible for
requesting, filtering, and retrieving sensor observations. In this
paper, we present initial results from a quantitative analysis of
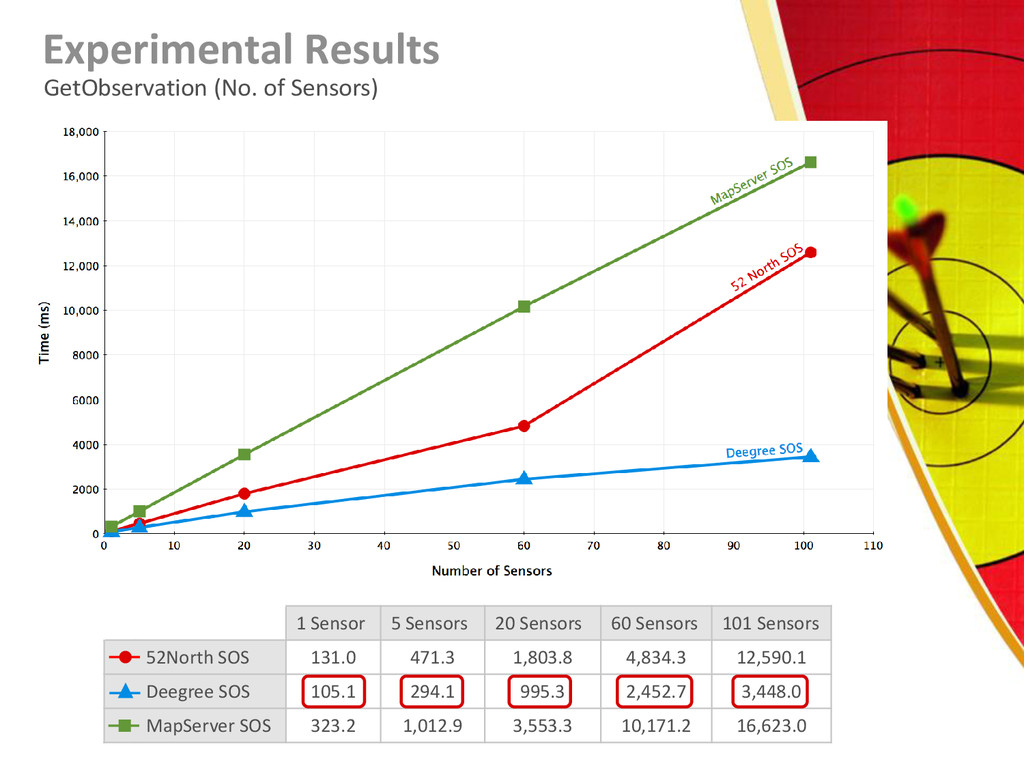
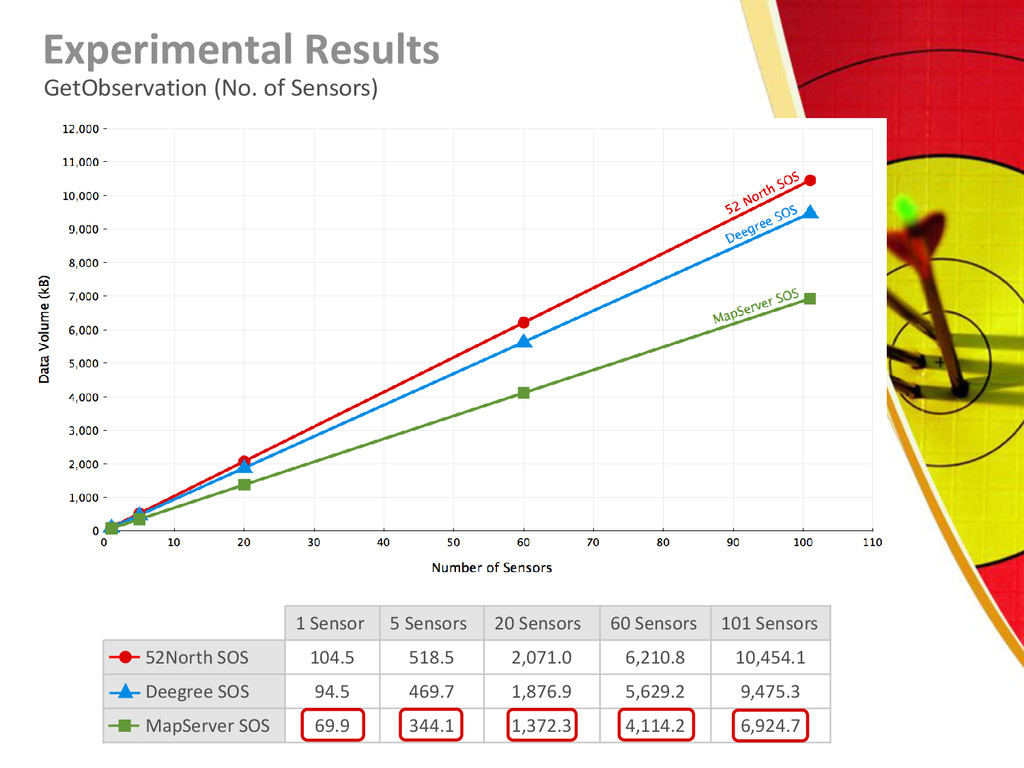
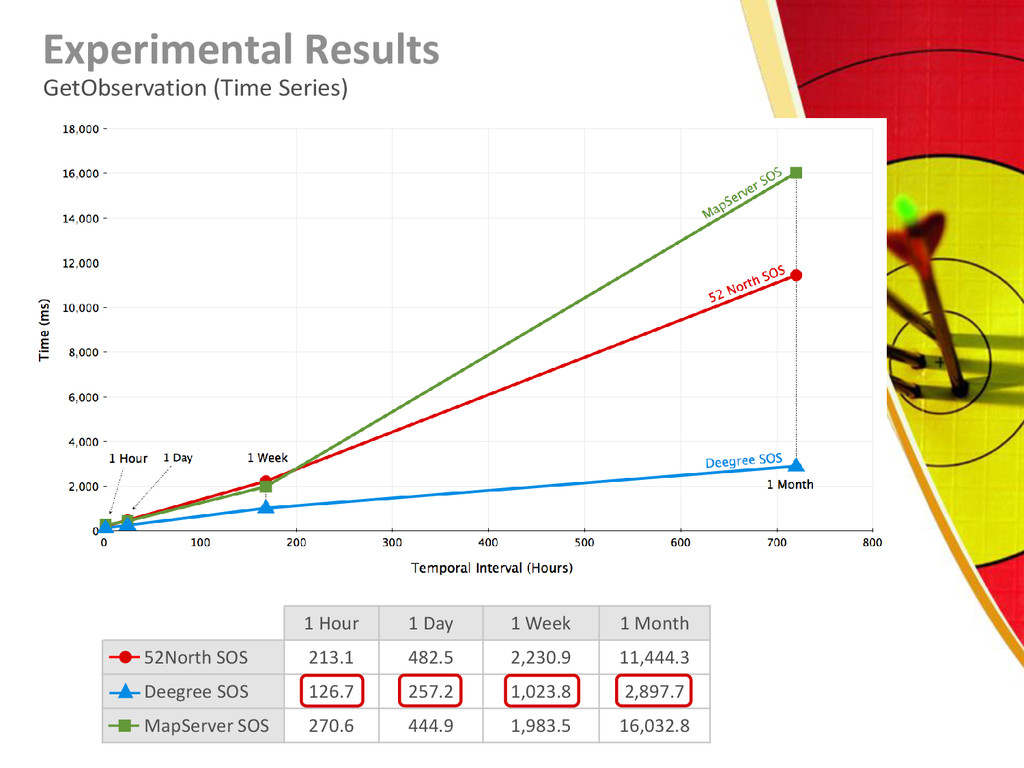
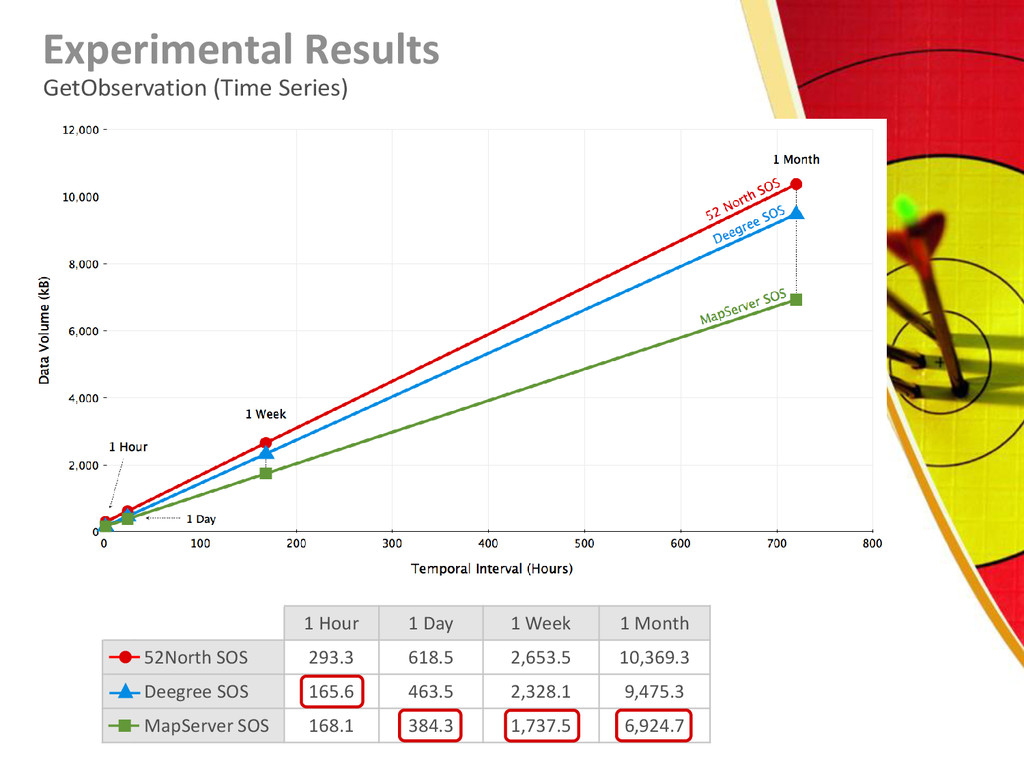
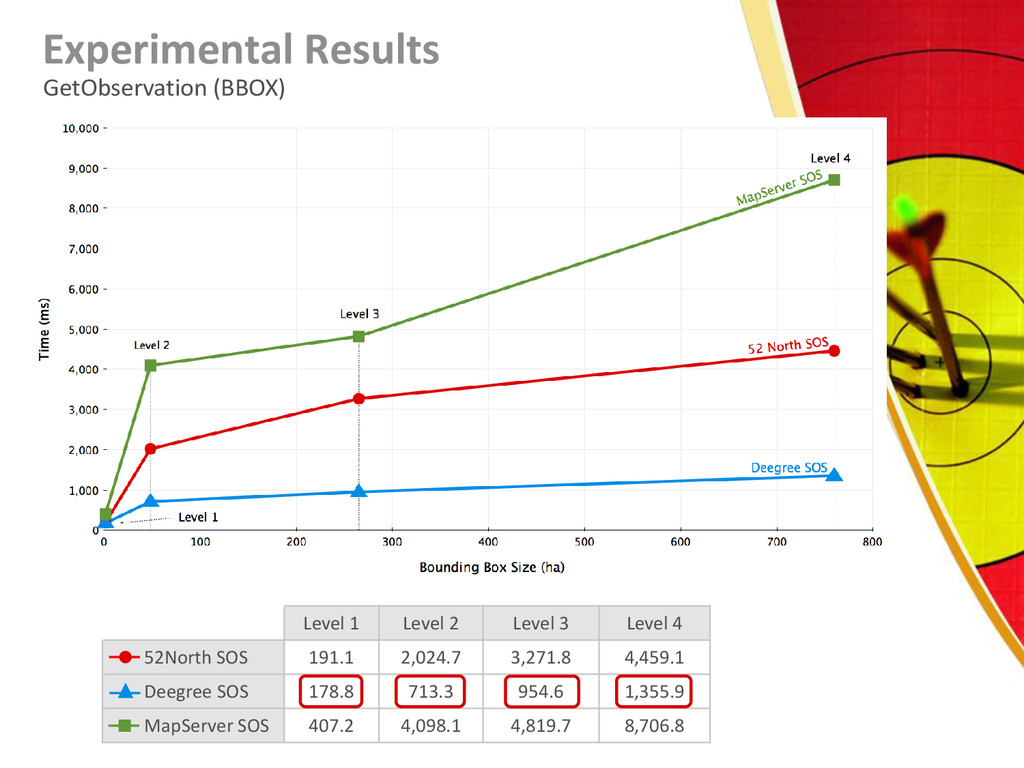
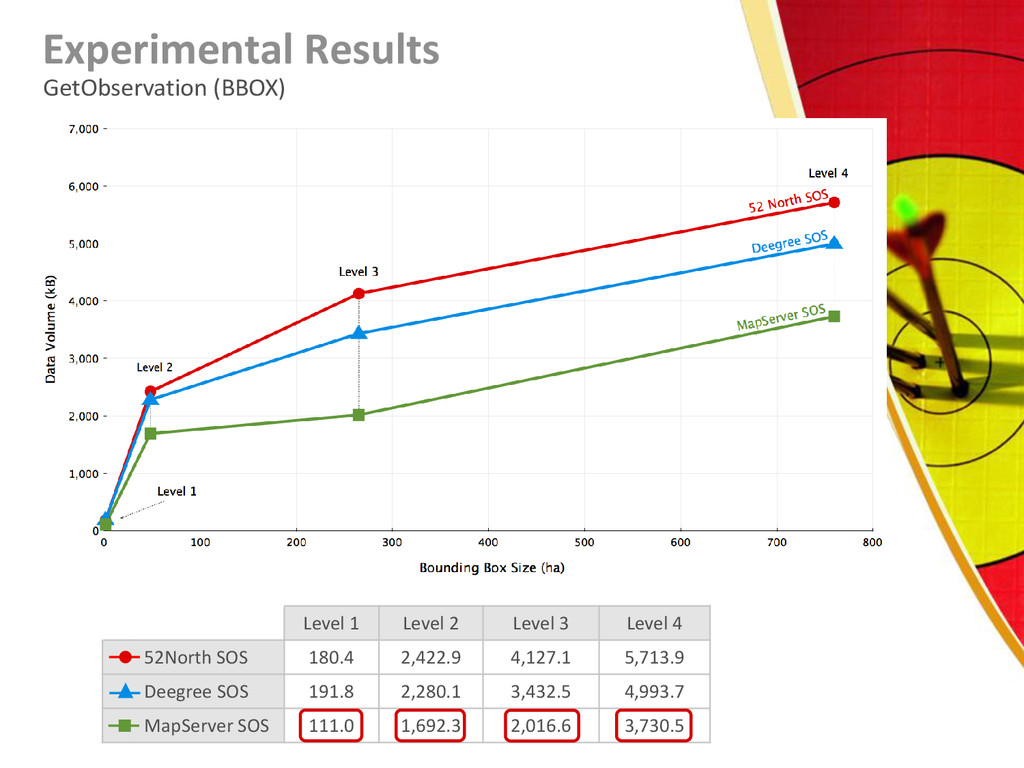
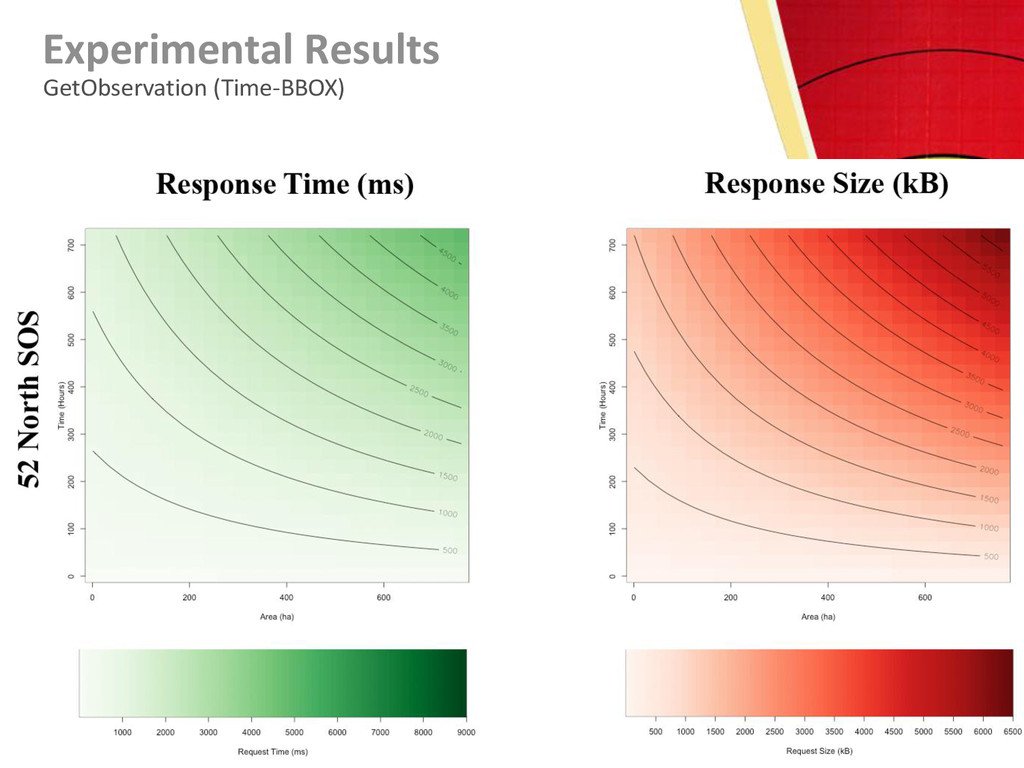
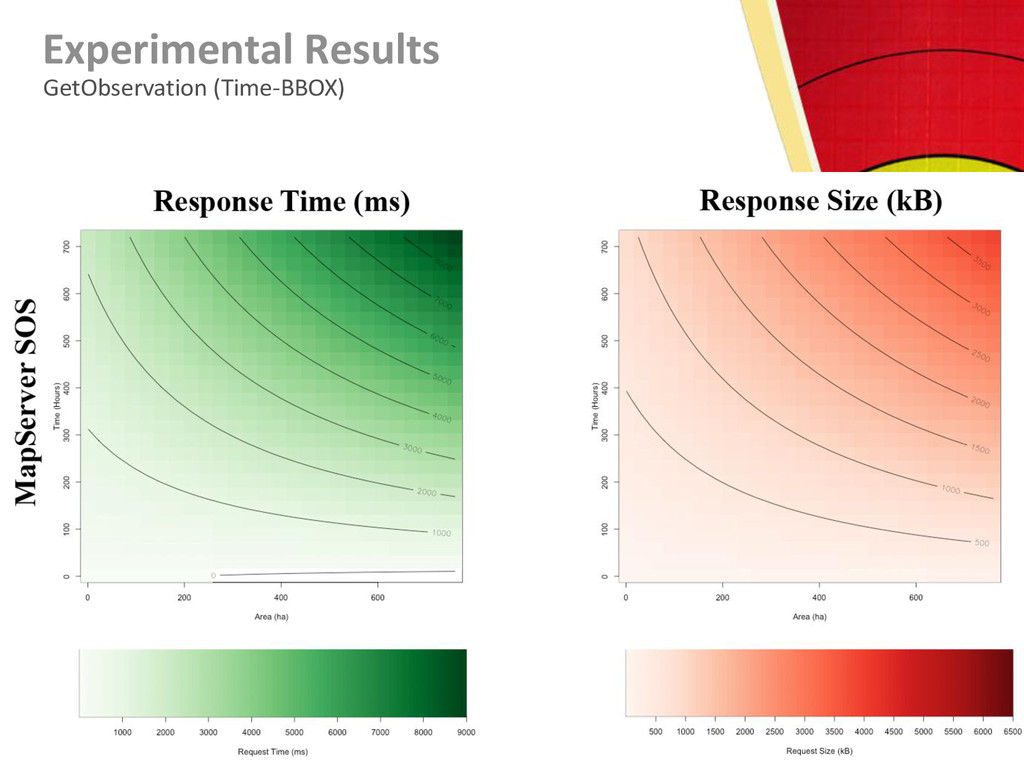
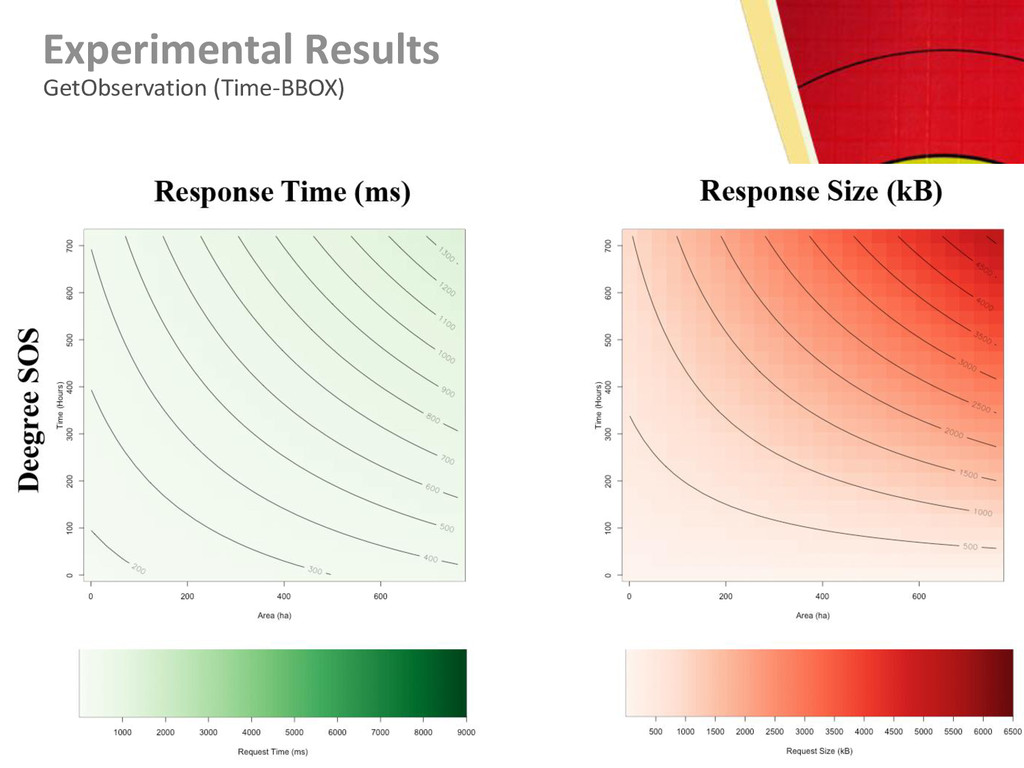
SOS servers’ performance. To do this, we measured the response
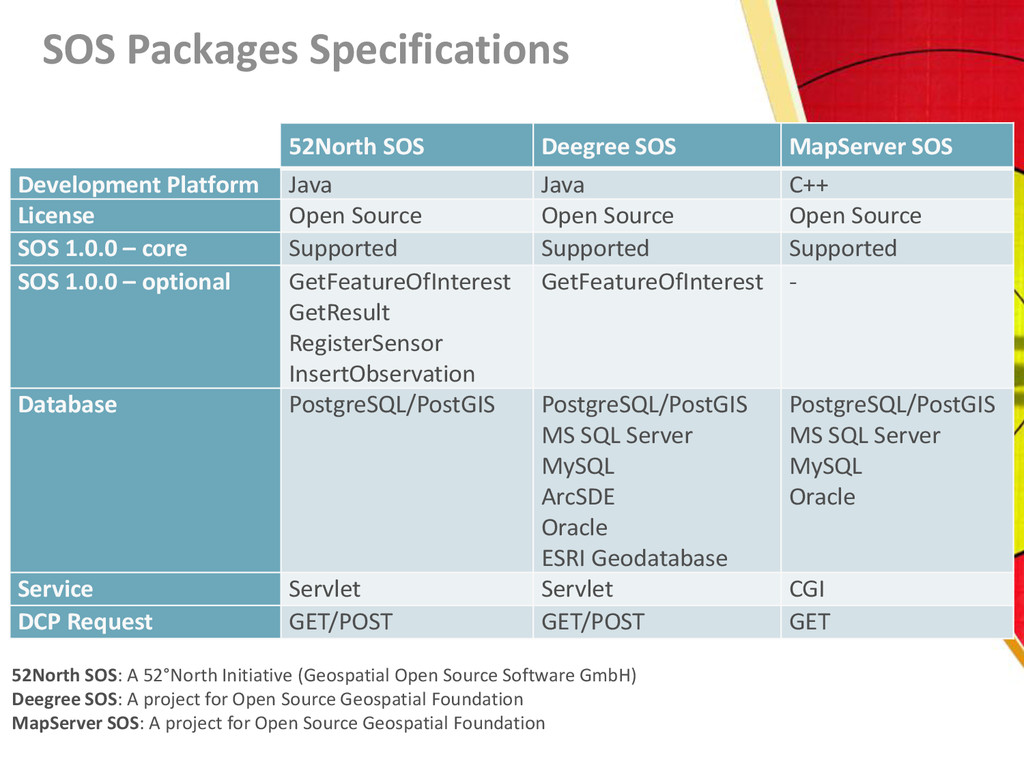
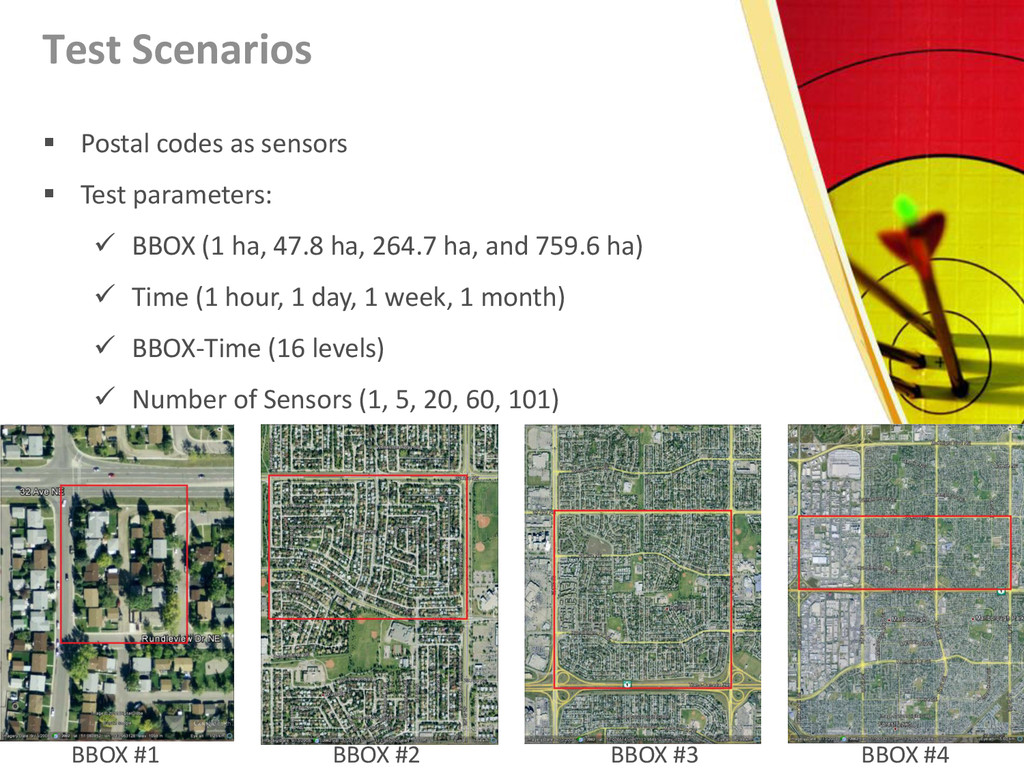
time and transferred data volume, the response size, of three SOS servers – 52North, MapServer, and Deegree – based on different test scenarios. The results are illustrated and discussed. Our findings can be helpful: (i) to understand how different parameters affect the SOS servers; (ii) to help SOS developers identify areas for improvement of their SOS; and (iii) to help application developers and users make informed decisions about their choice of SOS server.

Ebrahim Poorazizi

November 07, 2012
Tweet

More Decks by Ebrahim Poorazizi

Other Decks in Research

Transcript

  1. Testing of Sensor Observation Service Implementations A Performance Evaluation Ebrahim

    Poorazizi, Steve Liang, Andrew Hunter {mepooraz, steve.liang, ahunter}@ucalgary.ca Department of Geomatics Engineering, University of Calgary
  2. Outline  Introduction  What is SOS  SOS Packages

    Specifications  Test Scenarios  Data Simulation  Test Environment  Experimental Results  Conclusions
  3.  A Sensor Network is a computer accessible network of

    many, spatially distributed devices using sensors to monitor conditions at different locations, such as temperature, sound, vibration, pressure, motion or pollutants.  A Sensor Web refers to web accessible sensor networks and archived sensor data that can be discovered and accessed using standard protocols and APIs. Introduction
  4.  OGC Sensor Web Enablement Framework: The models, encodings, and

    services of the SWE architecture enable implementation of interoperable and scalable service- oriented networks of heterogeneous sensor systems and client applications. Introduction SWE Discovery of Sensors Access to Sensors Retrieval of Sensors Obs. Tasking Sensors Subscription to and Publish of Alerts
  5. Client SOS GetObservation Observations (O&M) DescribeSensor Sensor Description (SensorML) GetCapabilities

    Capabilities What is SOS  Standard web service interface for requesting, filtering, and retrieving observations and sensor system information SOS 1.0.0 mandatory operations
  6. 52North SOS Deegree SOS MapServer SOS Development Platform Java Java

    C++ License Open Source Open Source Open Source SOS 1.0.0 – core Supported Supported Supported SOS 1.0.0 – optional GetFeatureOfInterest GetResult RegisterSensor InsertObservation GetFeatureOfInterest - Database PostgreSQL/PostGIS PostgreSQL/PostGIS MS SQL Server MySQL ArcSDE Oracle ESRI Geodatabase PostgreSQL/PostGIS MS SQL Server MySQL Oracle Service Servlet Servlet CGI DCP Request GET/POST GET/POST GET 52North SOS: A 52°North Initiative (Geospatial Open Source Software GmbH) Deegree SOS: A project for Open Source Geospatial Foundation MapServer SOS: A project for Open Source Geospatial Foundation SOS Packages Specifications
  7. Test Scenarios  Postal codes as sensors  Test parameters:

     BBOX (1 ha, 47.8 ha, 264.7 ha, and 759.6 ha)  Time (1 hour, 1 day, 1 week, 1 month)  BBOX-Time (16 levels)  Number of Sensors (1, 5, 20, 60, 101) BBOX #1 BBOX #2 BBOX #3 BBOX #4
  8. Data Simulation  101 postal codes (of Calgary) were randomly

    selected  Time period: 15 min in 1 month for each sensor  Total number of observations: 4*24*30*101 = 290880  Database size:  188MB for PostgreSQL (52North SOS)  46MB for PostgreSQL (Deegree SOS)  39MB for PostgreSQL (MapServer SOS)
  9. Test Environment  Server specifications: Hardware Acer Aspire 3970 (Host)

    VMware (VM) CPU Intel Core i7 3.4 GHz 4 Cores of 8 RAM 8 GB 2 GB HDD 1.5 TB 20 GB OS Windows 7 Home Premium (64-bit) Ubuntu 11.10 (64-bit)  Each SOS package was installed on a separate VM  Client specifications: Hardware Dell OptiPlex 990 CPU Intel Core i5 3.1 GHz RAM 8 GB HDD 500 GB OS Windows 7 Professional(64-bit)
  10. Test Environment  All tests have been done from a

    remote client  Apache JMeter was used to test  Average of 30 requests for each test case were measured Server @ GeoSensor Web Lab Client @ Trailer H WWW
  11. Experimental Results GetObservation (No. of Sensors) 1 Sensor 5 Sensors

    20 Sensors 60 Sensors 101 Sensors 52North SOS 131.0 471.3 1,803.8 4,834.3 12,590.1 Deegree SOS 105.1 294.1 995.3 2,452.7 3,448.0 MapServer SOS 323.2 1,012.9 3,553.3 10,171.2 16,623.0
  12. Experimental Results GetObservation (No. of Sensors) 1 Sensor 5 Sensors

    20 Sensors 60 Sensors 101 Sensors 52North SOS 104.5 518.5 2,071.0 6,210.8 10,454.1 Deegree SOS 94.5 469.7 1,876.9 5,629.2 9,475.3 MapServer SOS 69.9 344.1 1,372.3 4,114.2 6,924.7
  13. Experimental Results GetObservation (Time Series) 1 Hour 1 Day 1

    Week 1 Month 52North SOS 213.1 482.5 2,230.9 11,444.3 Deegree SOS 126.7 257.2 1,023.8 2,897.7 MapServer SOS 270.6 444.9 1,983.5 16,032.8
  14. Experimental Results GetObservation (Time Series) 1 Hour 1 Day 1

    Week 1 Month 52North SOS 293.3 618.5 2,653.5 10,369.3 Deegree SOS 165.6 463.5 2,328.1 9,475.3 MapServer SOS 168.1 384.3 1,737.5 6,924.7
  15. Experimental Results GetObservation (BBOX) Level 1 Level 2 Level 3

    Level 4 52North SOS 191.1 2,024.7 3,271.8 4,459.1 Deegree SOS 178.8 713.3 954.6 1,355.9 MapServer SOS 407.2 4,098.1 4,819.7 8,706.8
  16. Experimental Results GetObservation (BBOX) Level 1 Level 2 Level 3

    Level 4 52North SOS 180.4 2,422.9 4,127.1 5,713.9 Deegree SOS 191.8 2,280.1 3,432.5 4,993.7 MapServer SOS 111.0 1,692.3 2,016.6 3,730.5
  17. Conclusions  Deegree SOS performs the best in terms of

    response time, especially when data requests cover larger areas, and longer temporal intervals.  MapServer SOS returns the smallest volume of data to the client.  52North SOS showed competitive performance across all types of queries, but does not scale quite as well as Deegree SOS.  Response time could be improved by reducing the size of the response document.