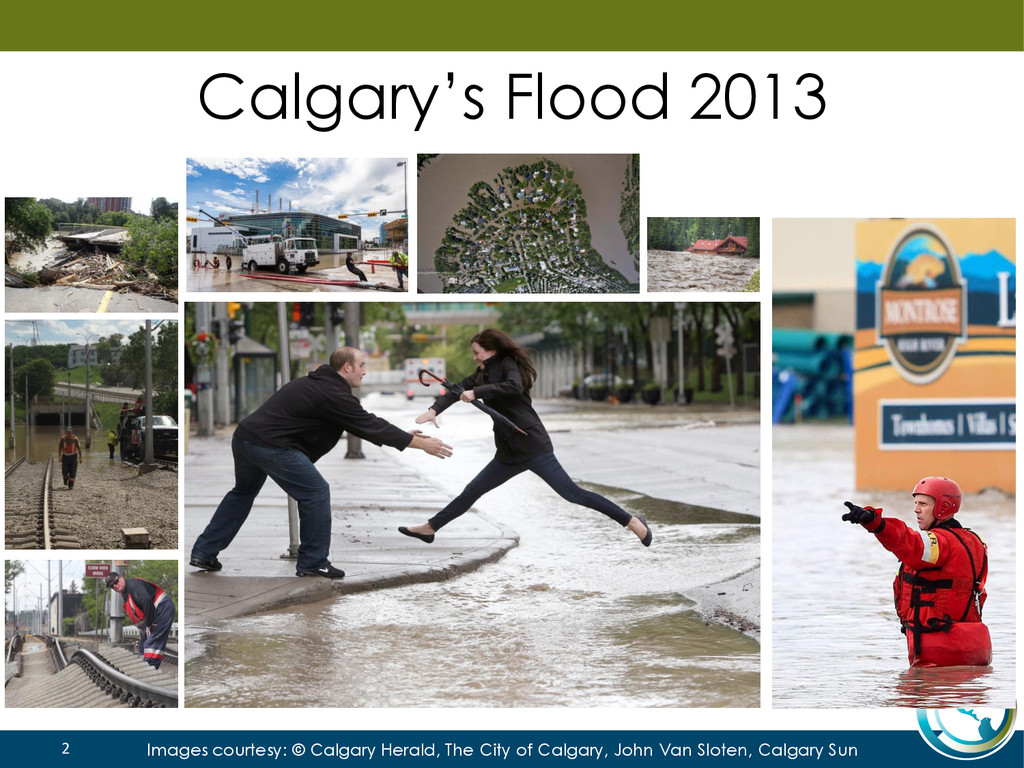
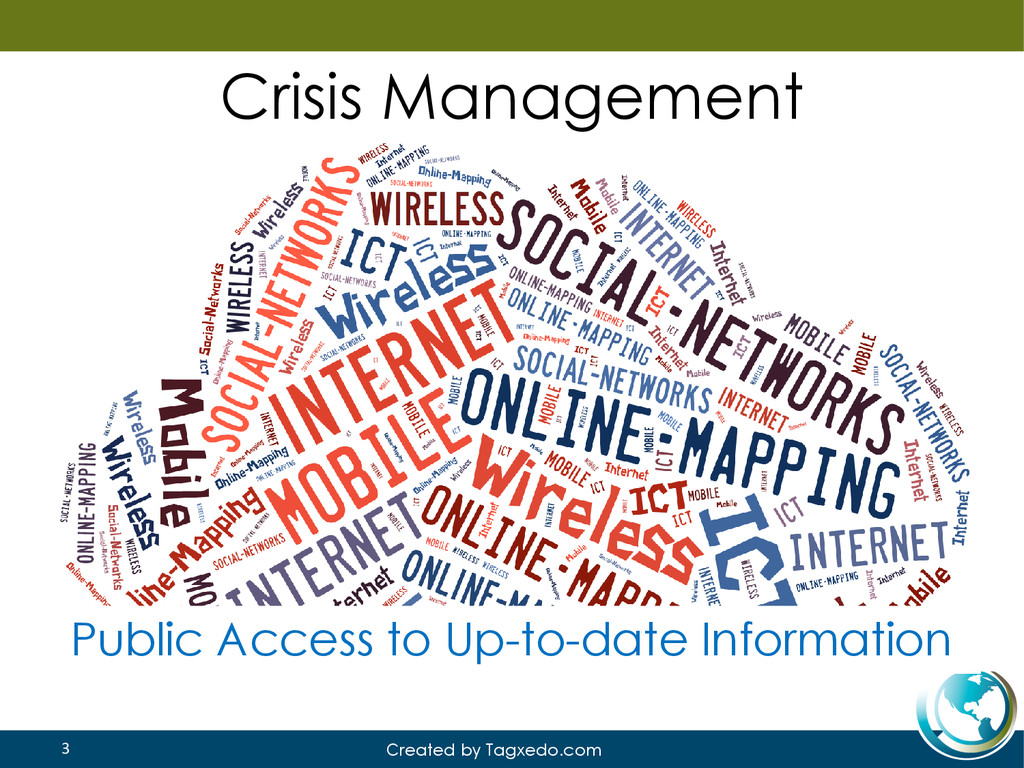
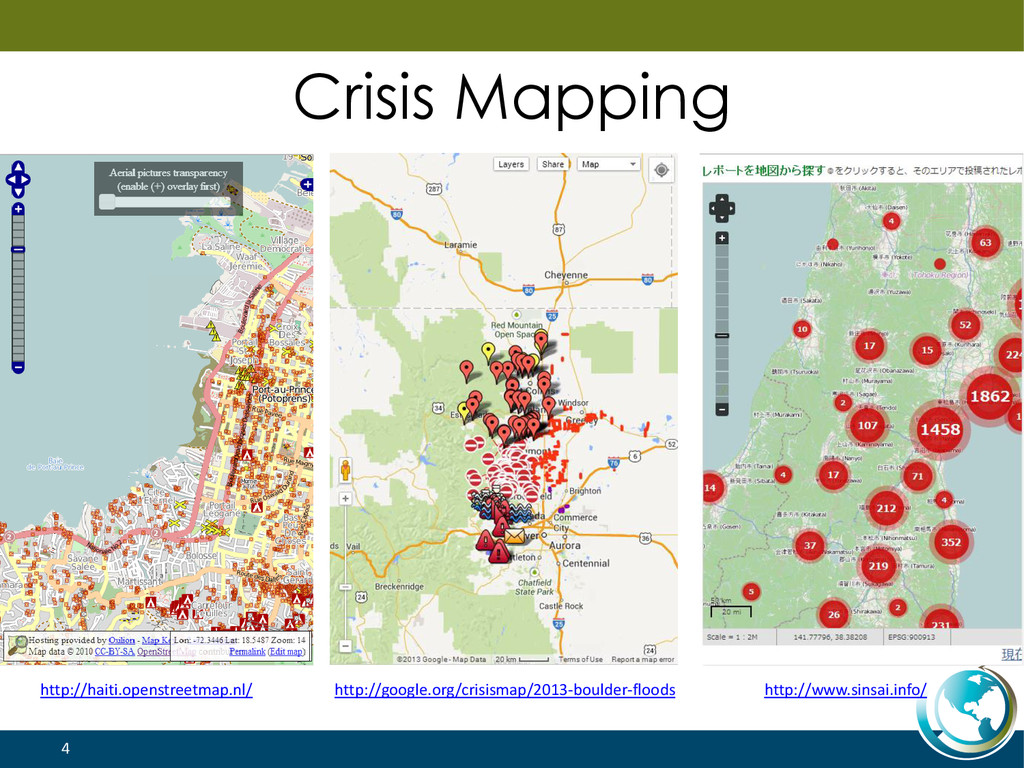
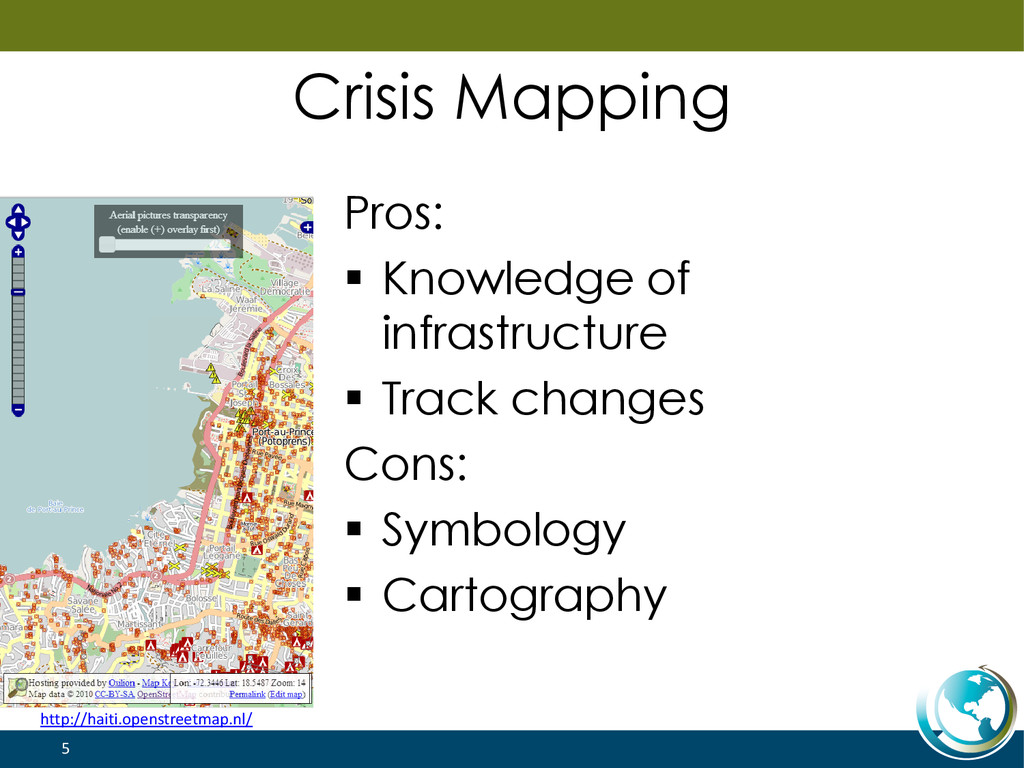
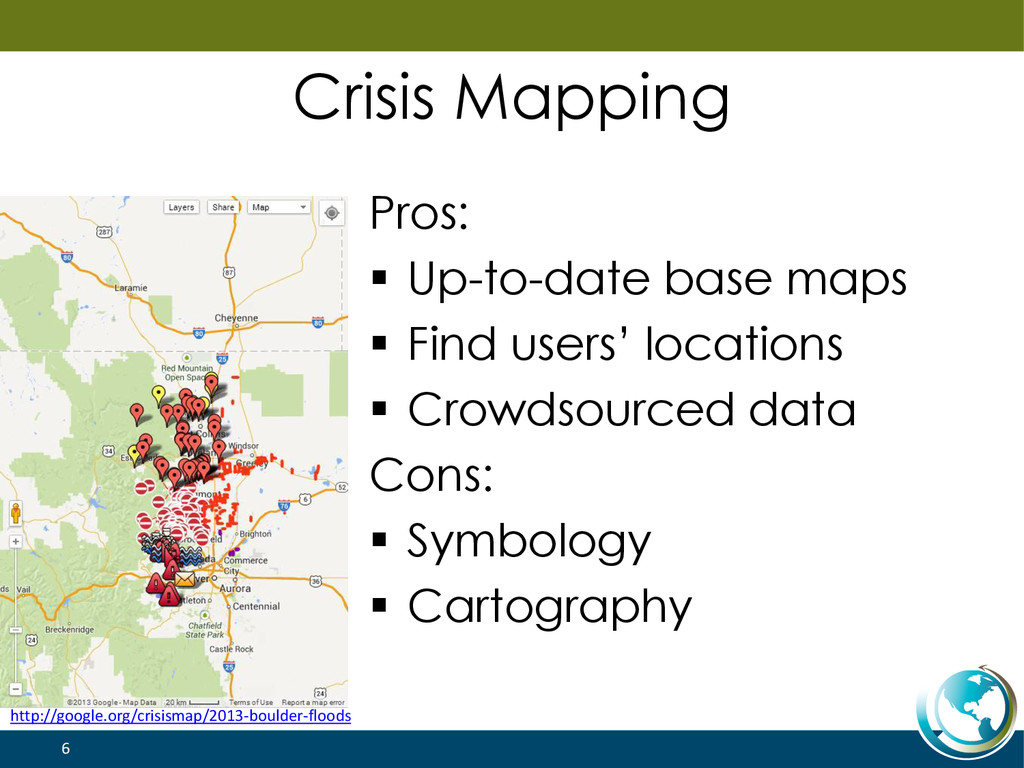
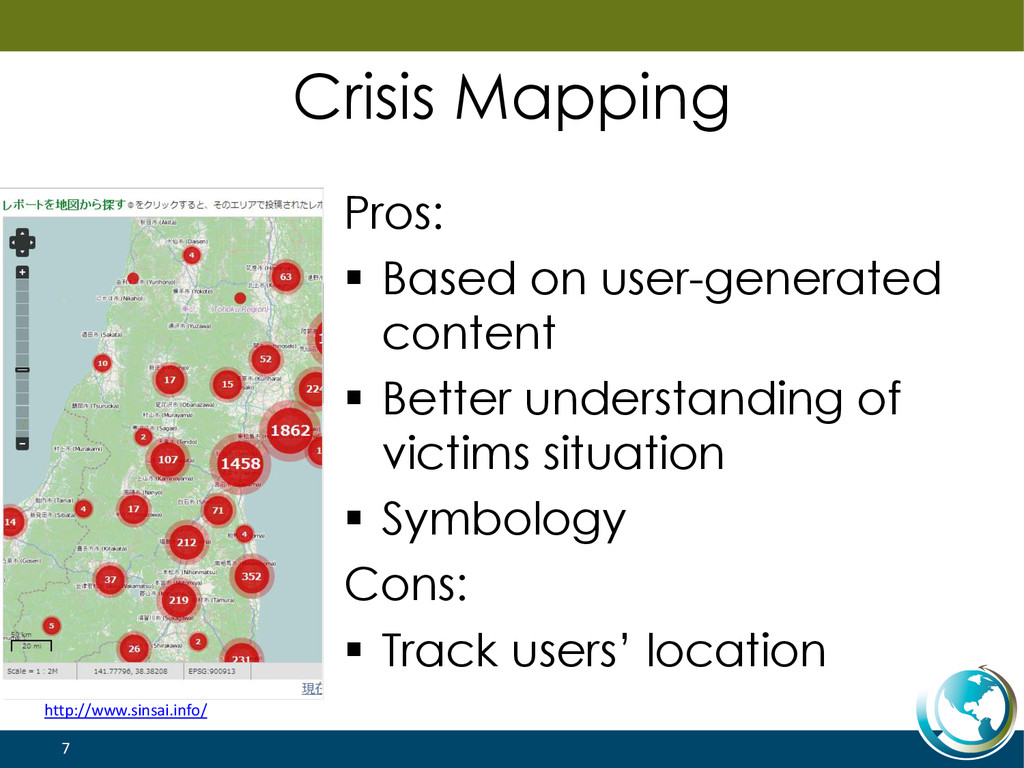
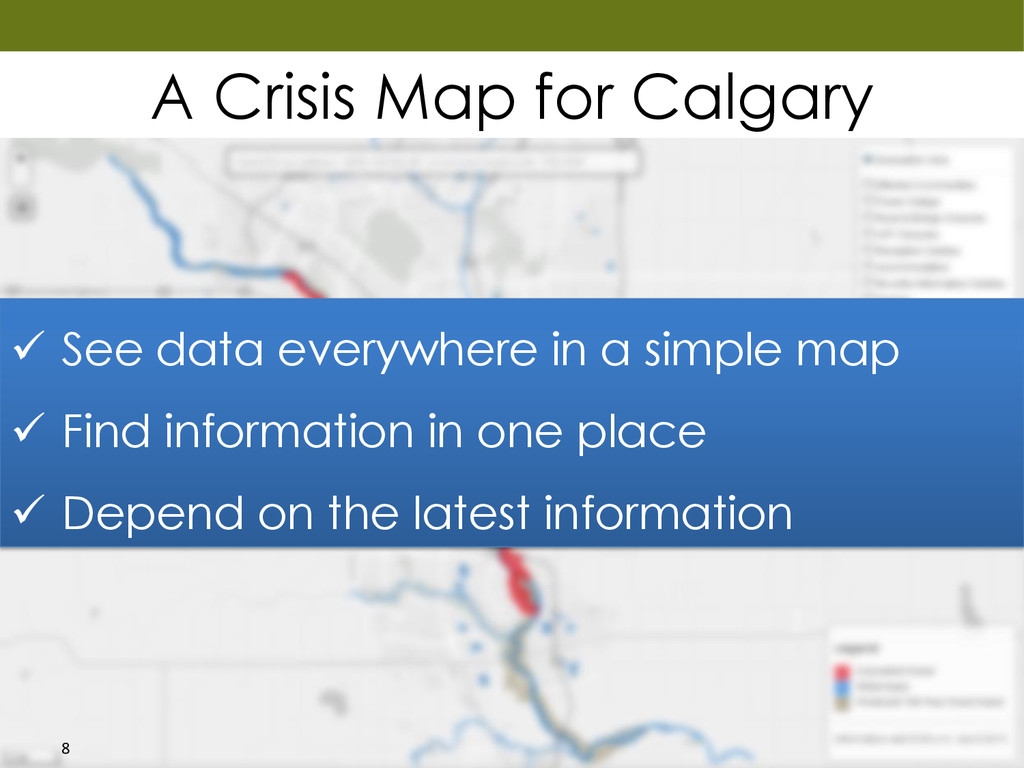
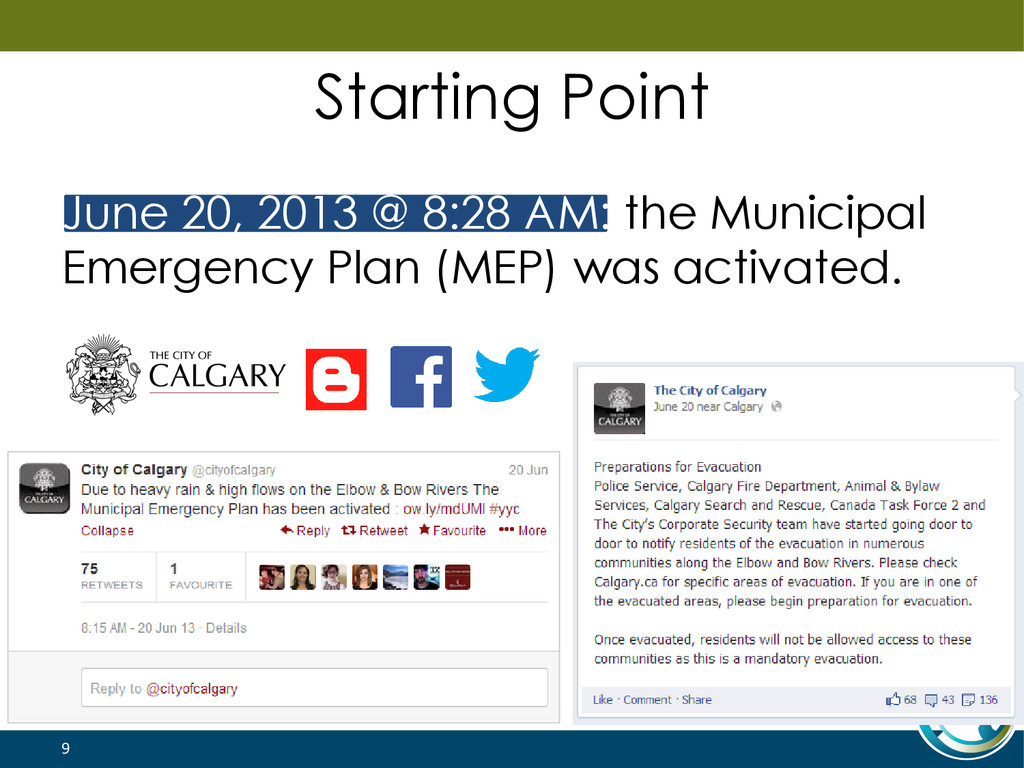
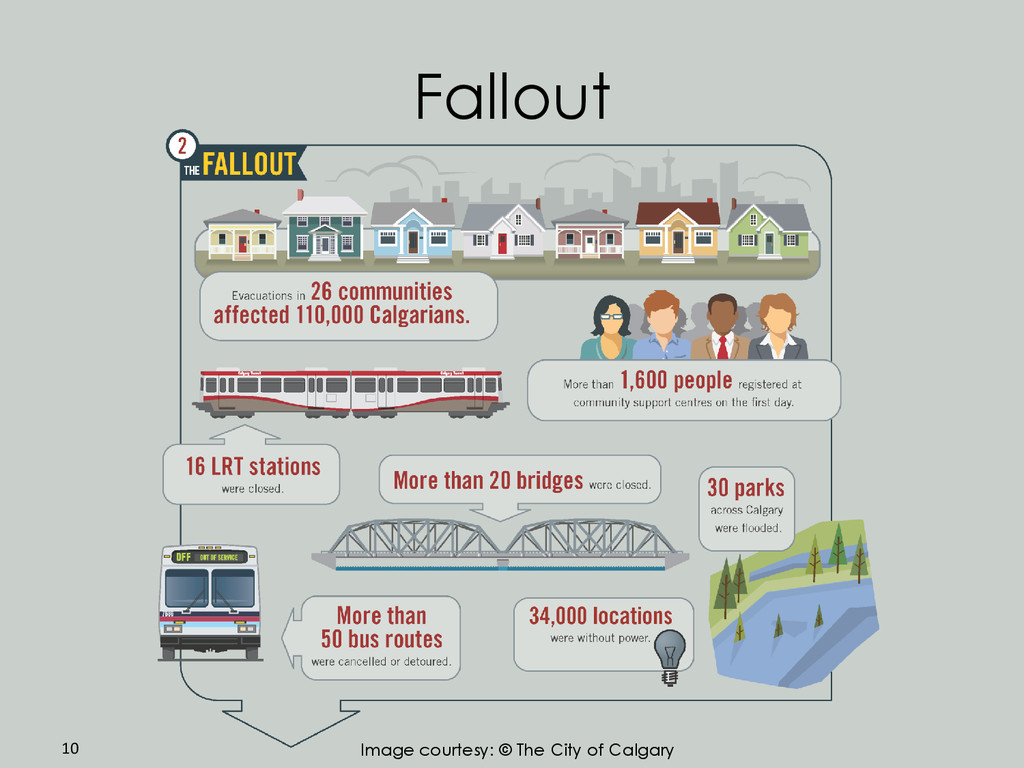
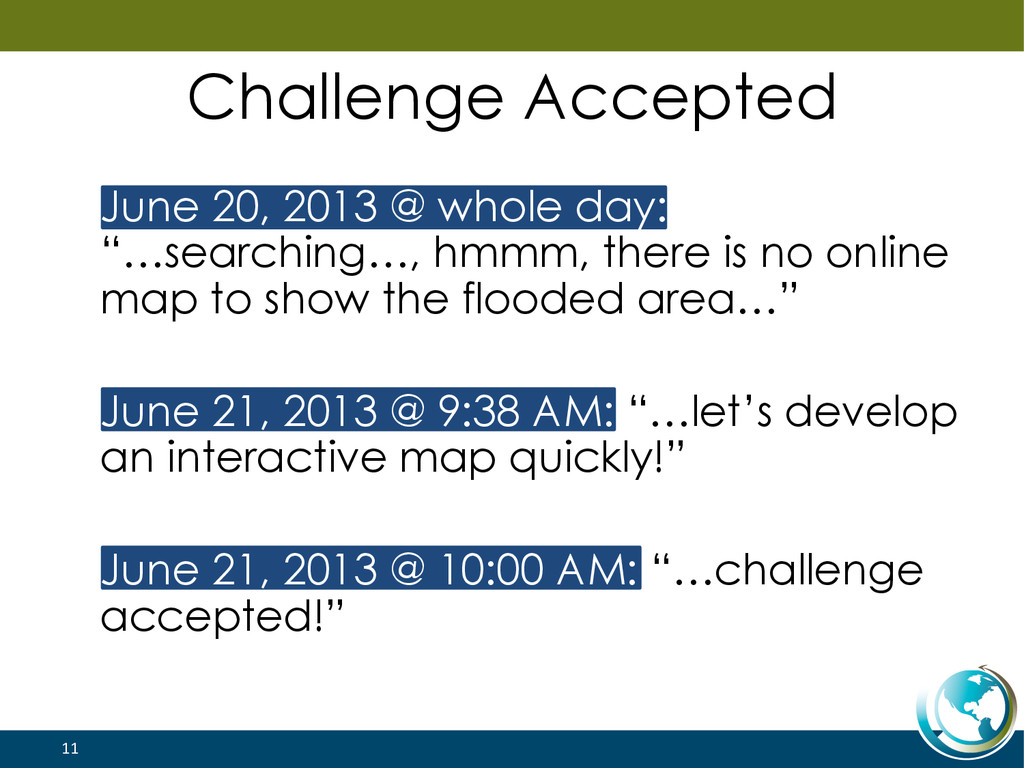
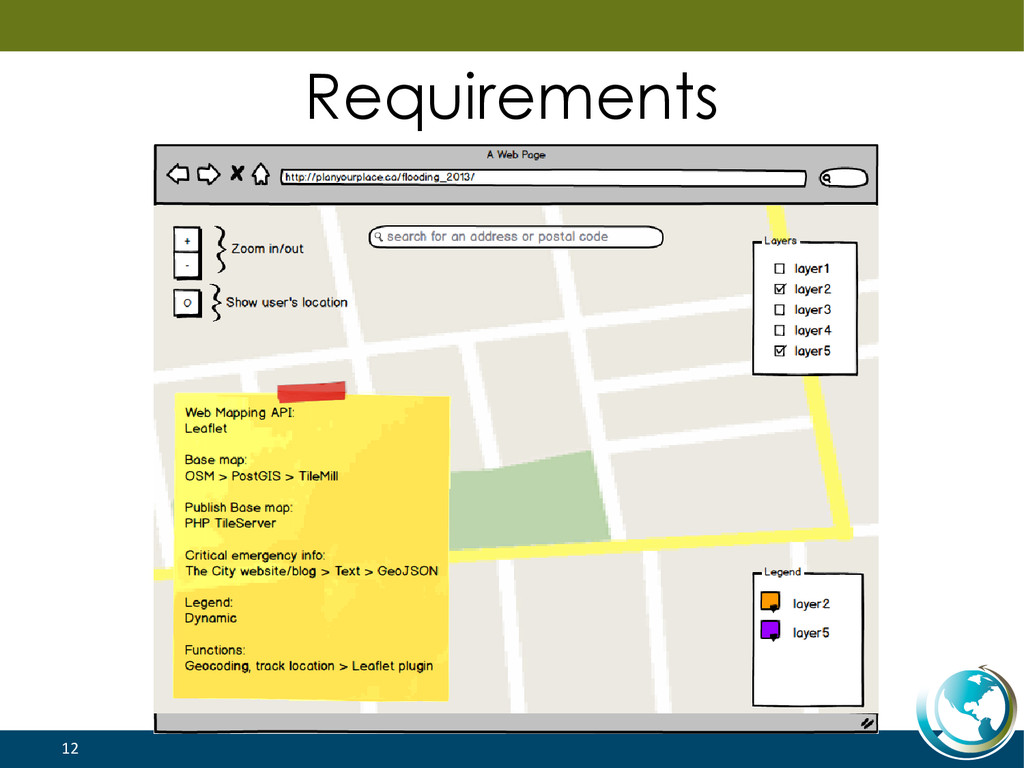
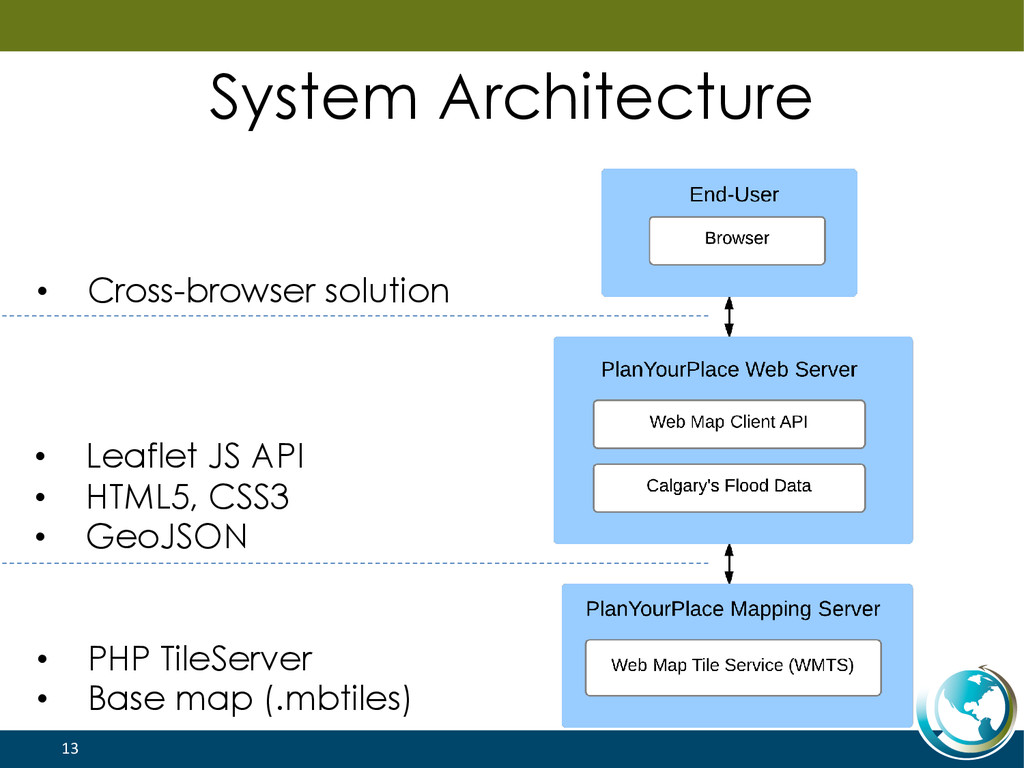
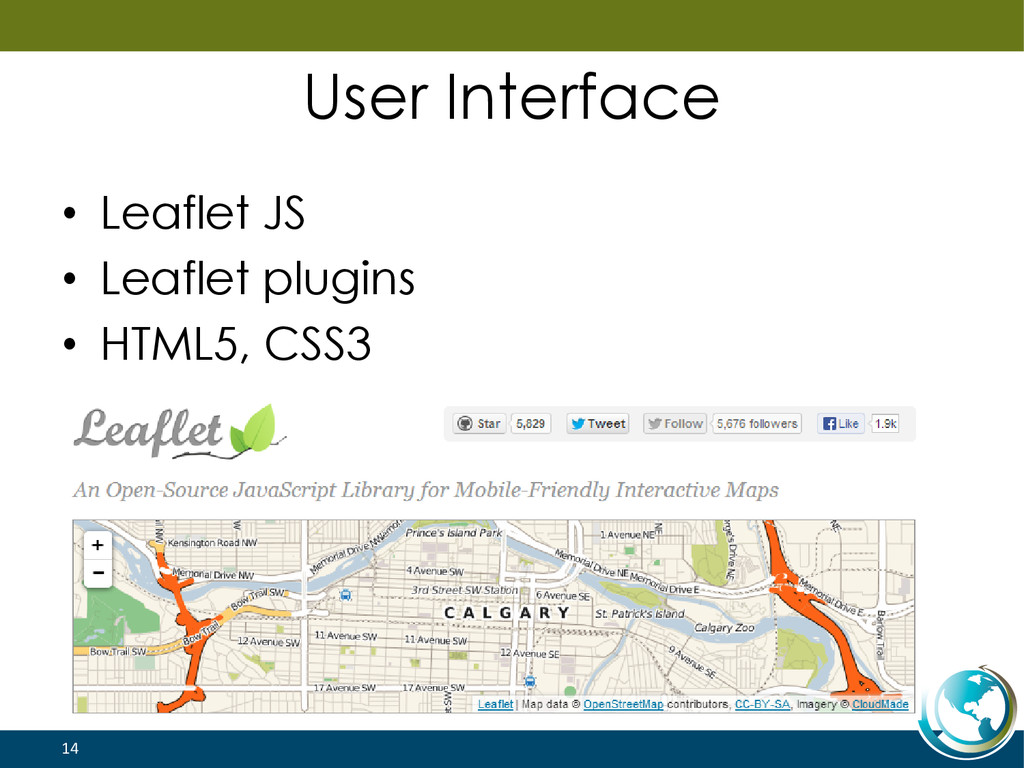
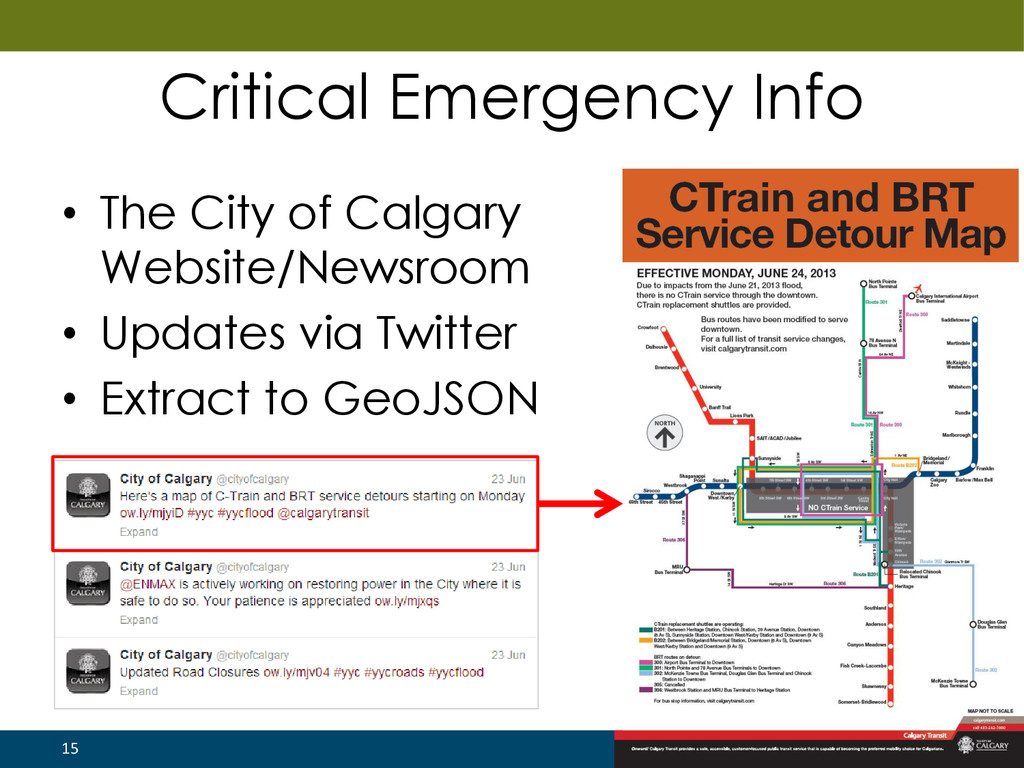
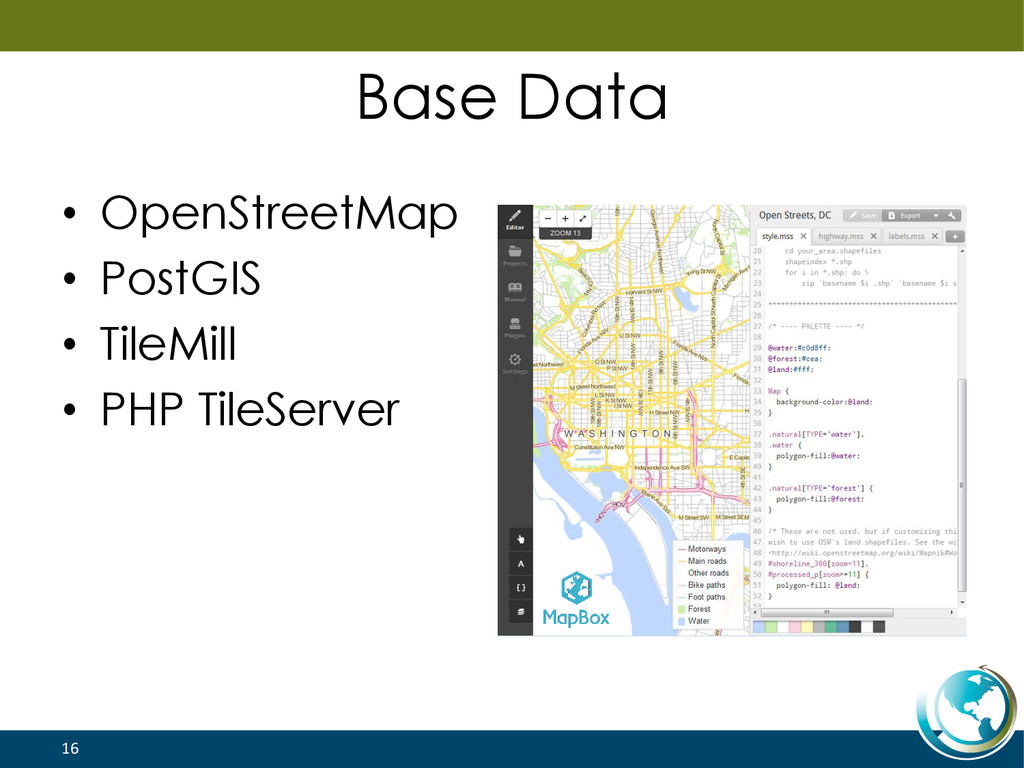
In June 2013, Albertans witnessed a catastrophic flooding event described by the provincial government as the worst in Alberta's history. During crisis events, public access to up-to-date information plays an important role in raising situational awareness, delivering assistance to those affected by the crisis, and to aid the development of mitigation plans. Crisis mapping, using platforms such as Ushahidi have been used extensively to help people find and use critical emergency information, document road and bridge closures, power outage areas, emergency aid locations, etc. In this paper, we present the development of an interactive flood mapping mashup for the City of Calgary, based on free and open source software packages. The system incorporates state-of-the-art technologies such as Web 2.0 mapping APIs, WMTS (Web Map Tile Service), and open geo-data standards to implement the user interface and the back-end mapping server. WMTS technology was used to provide the base map. To do so, City of Calgary geospatial data was extracted from OpenStreetMap, and map tiles were generated using TileMill, MapBox’s cartographic design studio. The principal server-side component used to deploy the map data was PHP Tile Server. On the client-side, Leaflet’s API was used to develop the mapping functionality and visualize crisis information. Web client technologies HTML5, CSS3, and AJAX were used to rapidly develop a flexible and interactive mapping solution. Spatial data was encoded using GeoJSON extracted from the textual information provided by the City of Calgary. These tools, and open data allowed us to rapidly deploy the site and provide citizens access to a wide range of crisis data via a single map.