Upgrade to Pro
— share decks privately, control downloads, hide ads and more …
Speaker Deck
Features
Speaker Deck
PRO
Sign in
Sign up for free
Search
Search
Druid + R
Search
Metamarkets
April 03, 2013
Technology
210
0
Share
Embed
Copy iframe code
Copy JS code
Copy link
Start on current slide
Druid + R
Metamarkets
April 03, 2013
More Decks by Metamarkets
See All by Metamarkets
R Workshop for Beginners
metamx
2
4.7k
Other Decks in Technology
See All in Technology
「休む」重要さ
smt7174
7
1.8k
信頼できるテスティングAIをどう育てるか?
odan611
0
160
文字起こし基盤の信頼性
abnoumaru
0
150
エンタープライズデータへ安全につなぐ Production-ready なエージェント設計 ― AI × MCP リファレンスアーキテクチャ ― #AIDevDay
cdataj
1
260
なぜ、あなたのAPIは使われないのか? AX時代の設計原則、ガードレール、運用体制
yokawasa
1
260
AI エージェント時代のデジタルアイデンティティ
fujie
1
1.2k
13年運用タイトルのサーバーサイドが辿り着いた現在地 ― モンスターストライクにおける技術・組織・AI活用から得た知見
mixi_engineers
PRO
1
320
セキュリティ研修【MIXI 26新卒技術研修】
mixi_engineers
PRO
31
25k
ウォーターフォール開発案件のPMとしてAI活用を模索している話
hatahata021
2
200
AIがAPIを書く時代に、私たちは何を設計すべきか
nagix
0
150
新たなDBアーキテクチャ「LTAP」にDeep Dive!!
inoutk
0
150
自己解決や回答速度を上げる、サポート業務へのAIの組み込み方【SORACOM Discovery 2026】
soracom
PRO
0
100
Featured
See All Featured
My Coaching Mixtape
mlcsv
0
180
Leading Effective Engineering Teams in the AI Era
addyosmani
9
2.2k
The Curious Case for Waylosing
cassininazir
1
440
HDC tutorial
michielstock
2
760
Pawsitive SEO: Lessons from My Dog (and Many Mistakes) on Thriving as a Consultant in the Age of AI
davidcarrasco
0
200
Applied NLP in the Age of Generative AI
inesmontani
PRO
4
2.4k
Lightning Talk: Beautiful Slides for Beginners
inesmontani
PRO
2
610
DBのスキルで生き残る技術 - AI時代におけるテーブル設計の勘所
soudai
PRO
67
56k
SEO Brein meetup: CTRL+C is not how to scale international SEO
lindahogenes
1
2.8k
Navigating Algorithm Shifts & AI Overviews - #SMXNext
aleyda
1
1.5k
Lightning talk: Run Django tests with GitHub Actions
sabderemane
0
230
Scaling GitHub
holman
464
140k
Transcript
Druid + R aggregate all your data
agenda An Overview of Druid RDruid Lab Conclusions
motivation visualize big data existing data engines did not meet
our needs
motivation relational databases scans were too slow! NoSQL computationally intractable
pre-computations took too long! nothing existed that could solve our problems (or was cost prohibitive)
enter Druid real-time distributed column-oriented analytical data store scales horizontally
open-source
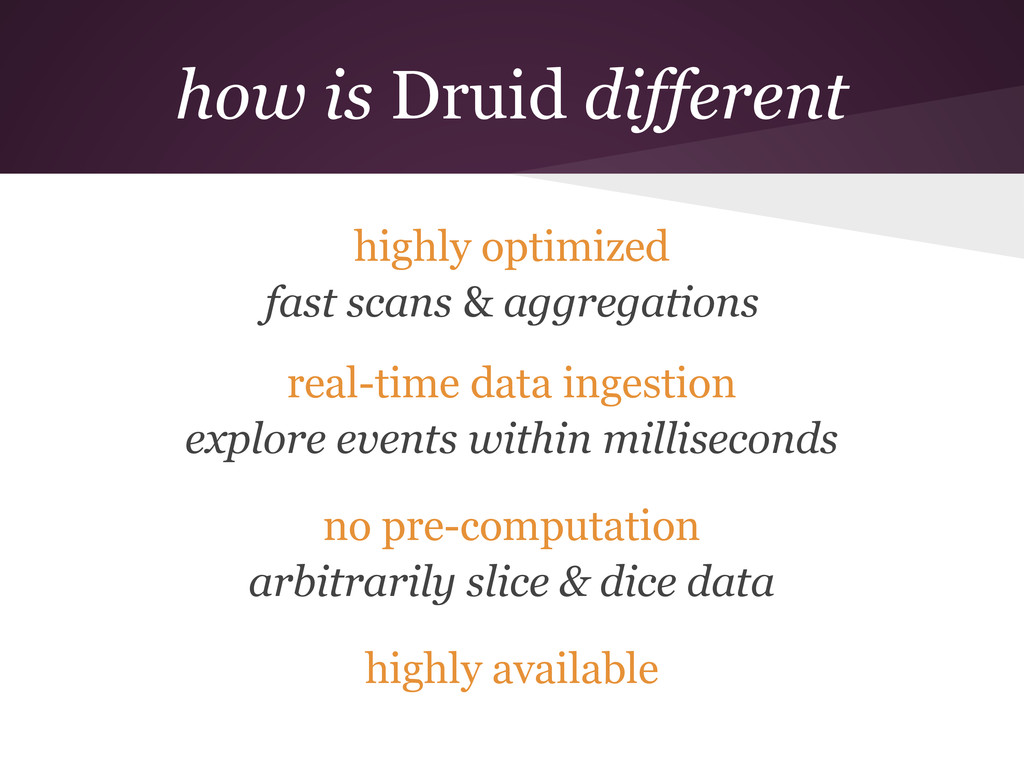
how is Druid different highly optimized fast scans & aggregations
real-time data ingestion explore events within milliseconds no pre-computation arbitrarily slice & dice data highly available
using Druid we will explore Druid architecture in future meetups
let's learn to use Druid!
RDruid slicing & dicing on steroids
what are we addressing? slicing and dicing data in R
is fun… …until you run out of memory
solution fire up a 64G EC2 machine and hope it
works or let Druid do the work for you
how we use it ad-hoc reporting analyze client data internal
metrics prototyping
metrics
let’s try it code bit.ly/YtJ1Xj
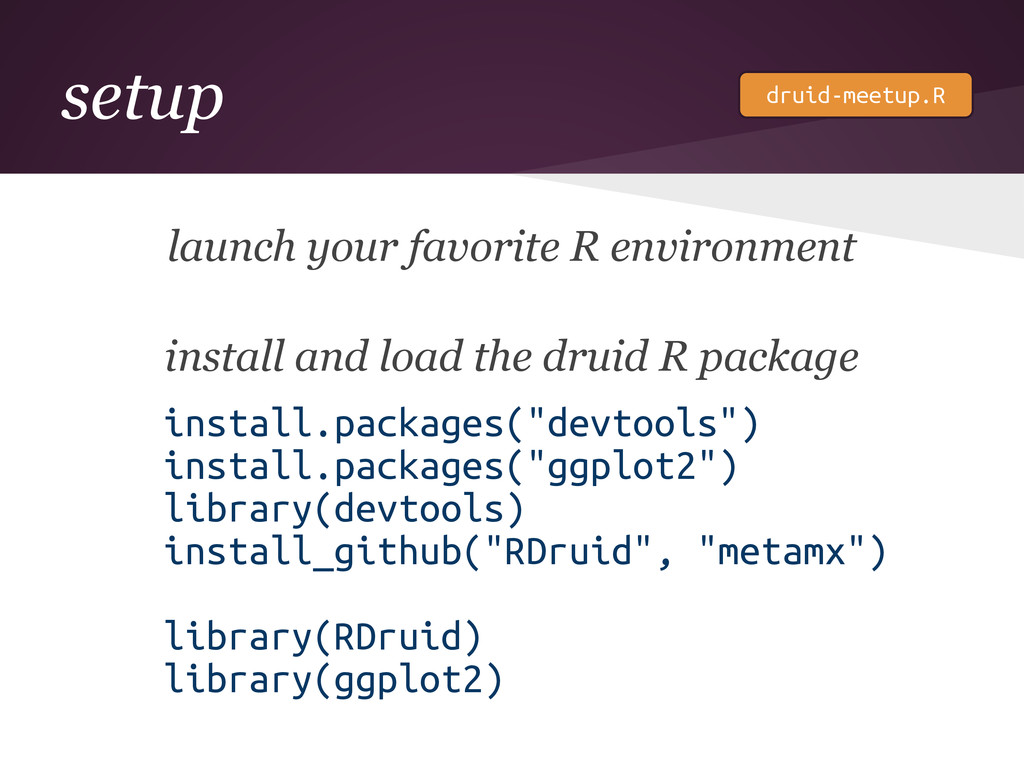
setup launch your favorite R environment install and load the
druid R package install.packages("devtools") install.packages("ggplot2") library(devtools) install_github("RDruid", "metamx") library(RDruid) library(ggplot2) druid-meetup.R
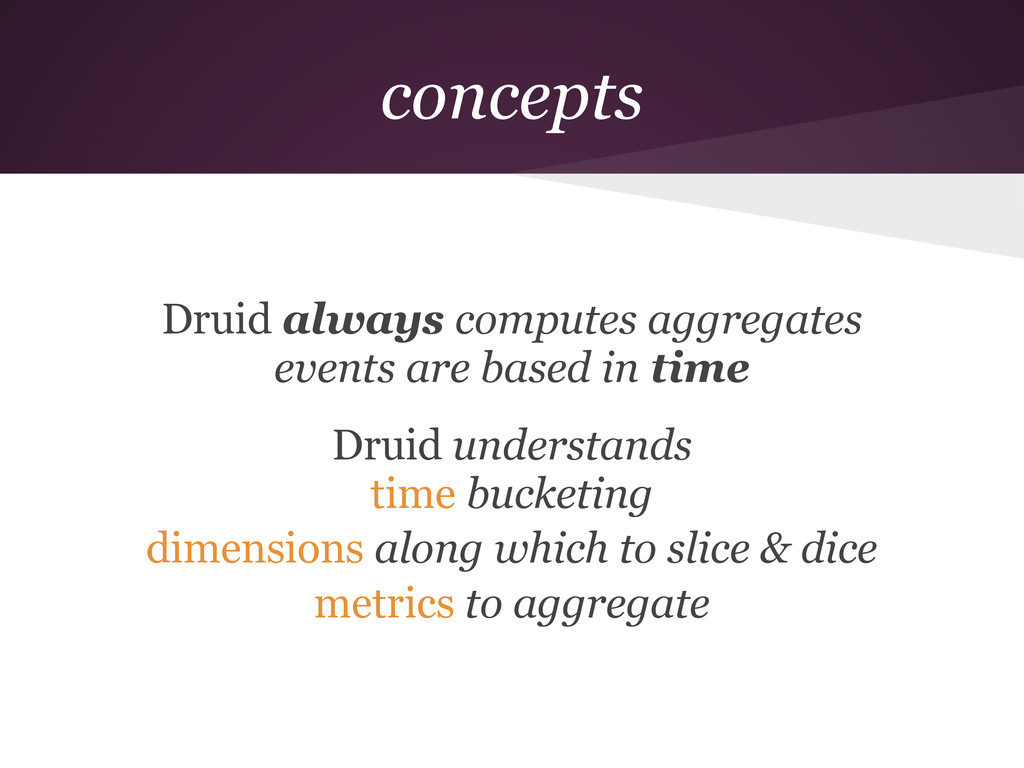
concepts Druid always computes aggregates events are based in time
Druid understands time bucketing dimensions along which to slice & dice metrics to aggregate
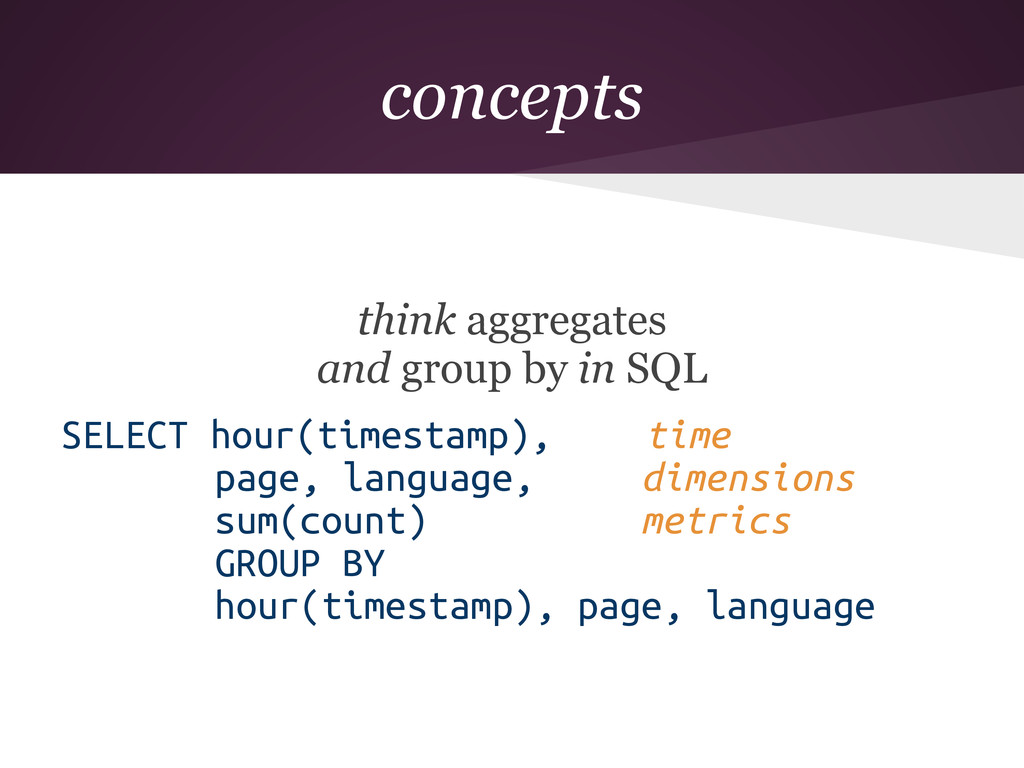
concepts think aggregates and group by in SQL SELECT hour(timestamp),
time page, language, dimensions sum(count) metrics GROUP BY hour(timestamp), page, language
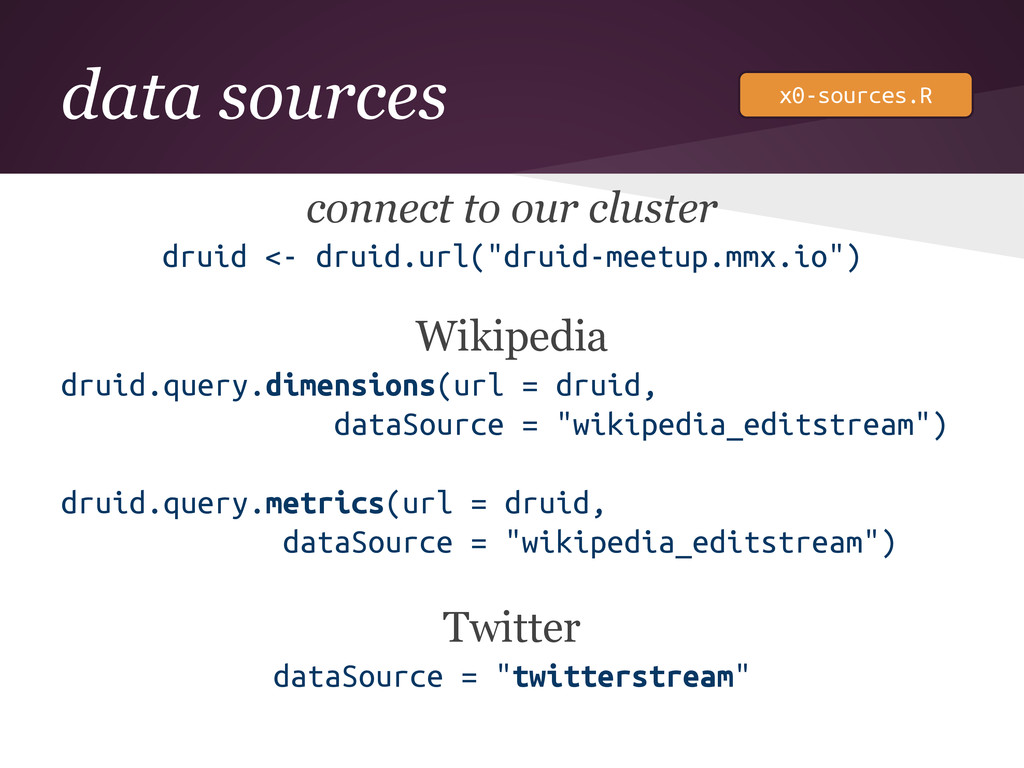
data sources connect to our cluster druid <- druid.url("druid-meetup.mmx.io") Wikipedia
druid.query.dimensions(url = druid, dataSource = "wikipedia_editstream") druid.query.metrics(url = druid, dataSource = "wikipedia_editstream") Twitter dataSource = "twitterstream" x0-sources.R
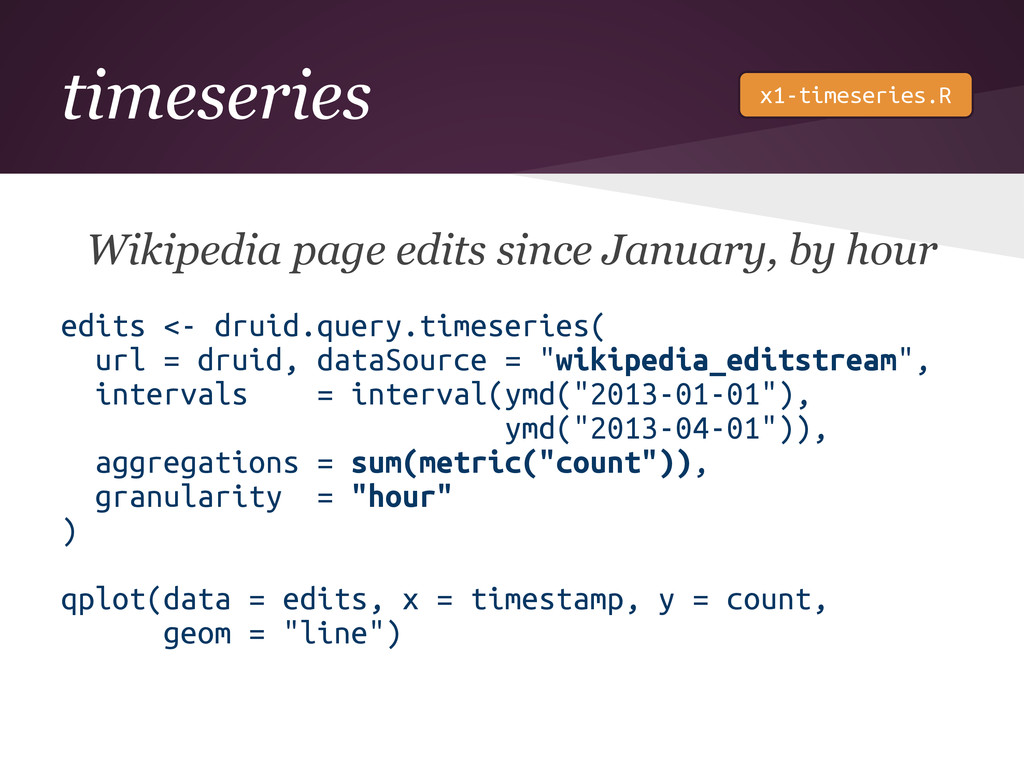
timeseries Wikipedia page edits since January, by hour edits <-
druid.query.timeseries( url = druid, dataSource = "wikipedia_editstream", intervals = interval(ymd("2013-01-01"), ymd("2013-04-01")), aggregations = sum(metric("count")), granularity = "hour" ) qplot(data = edits, x = timestamp, y = count, geom = "line") x1-timeseries.R
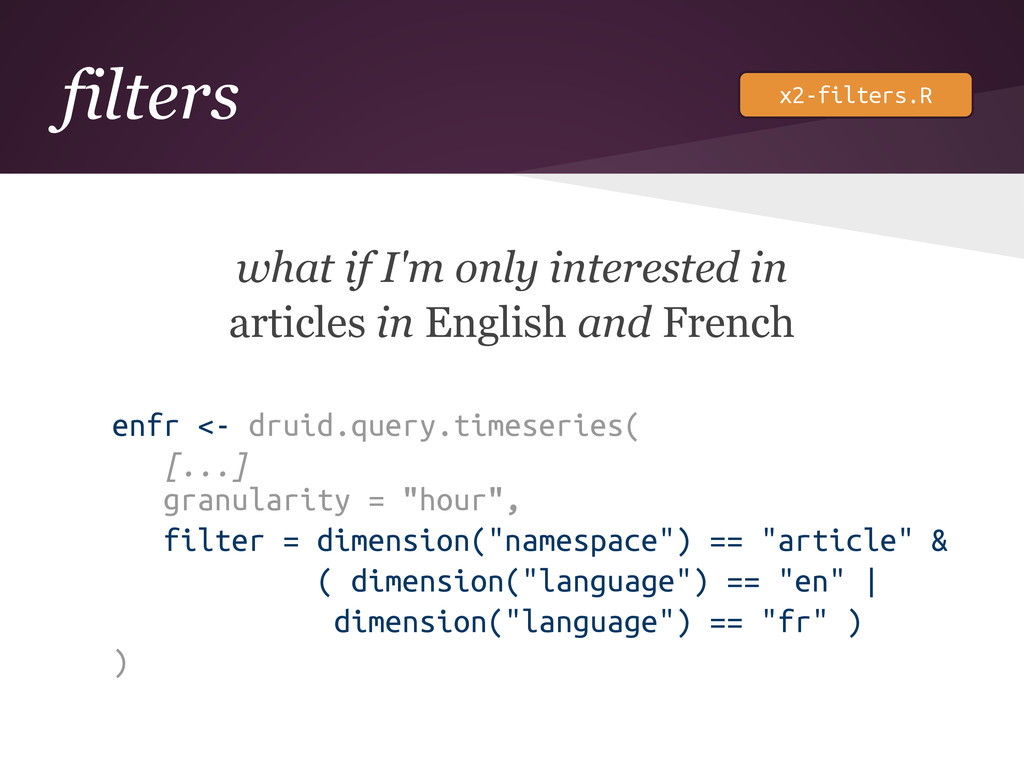
filters what if I'm only interested in articles in English
and French enfr <- druid.query.timeseries( [...] granularity = "hour", filter = dimension("namespace") == "article" & ( dimension("language") == "en" | dimension("language") == "fr" ) ) x2-filters.R
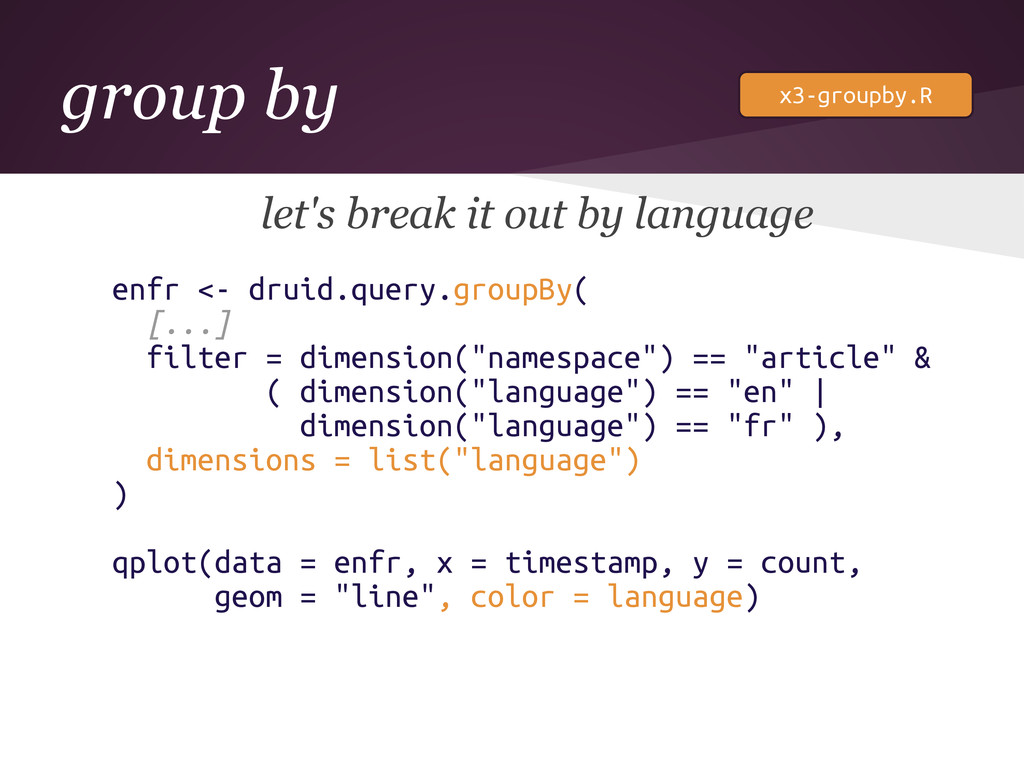
group by let's break it out by language enfr <-
druid.query.groupBy( [...] filter = dimension("namespace") == "article" & ( dimension("language") == "en" | dimension("language") == "fr" ), dimensions = list("language") ) qplot(data = enfr, x = timestamp, y = count, geom = "line", color = language) x3-groupby.R
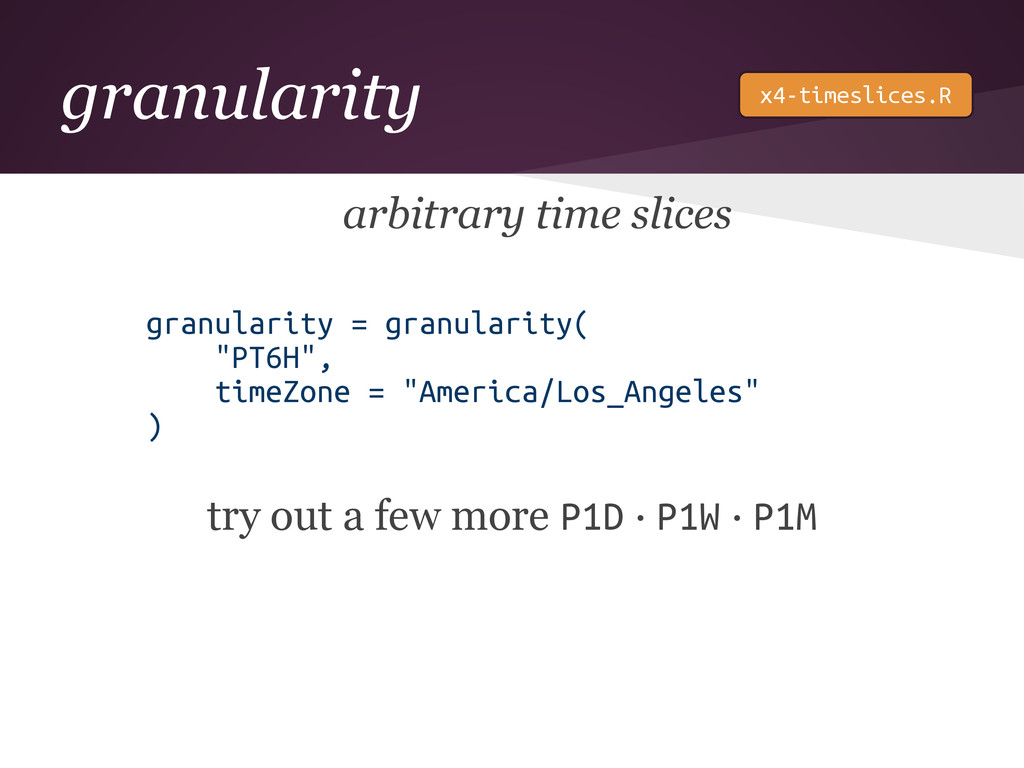
granularity arbitrary time slices granularity = granularity( "PT6H", timeZone =
"America/Los_Angeles" ) try out a few more P1D · P1W · P1M x4-timeslices.R
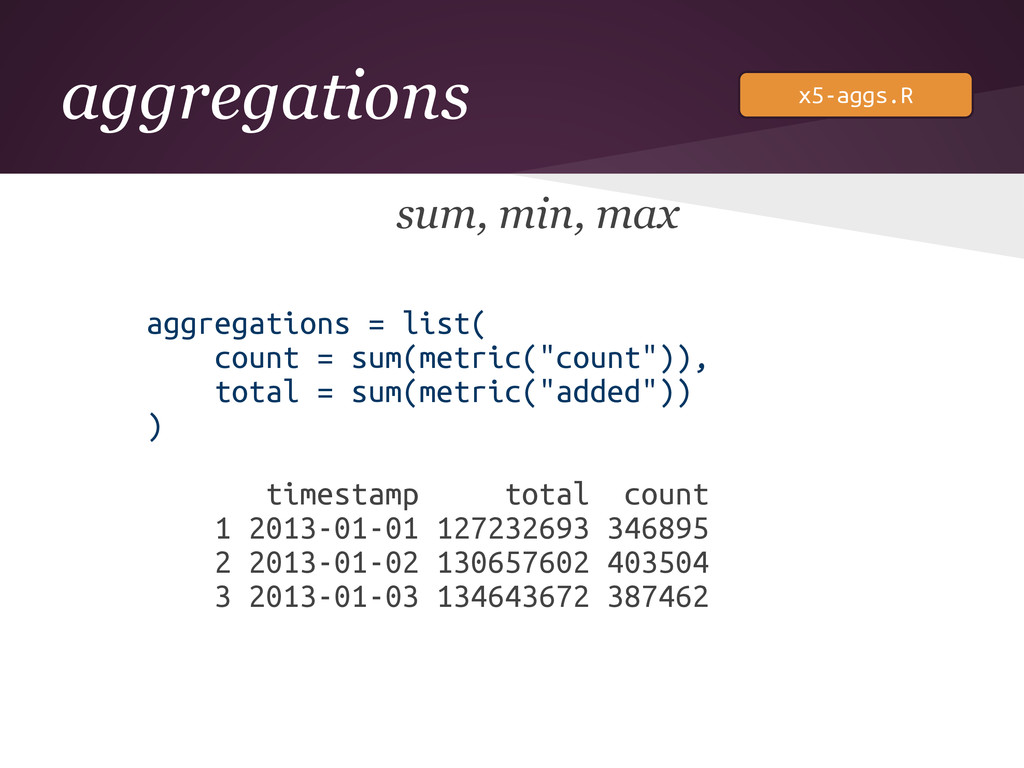
aggregations sum, min, max aggregations = list( count = sum(metric("count")),
total = sum(metric("added")) ) timestamp total count 1 2013-01-01 127232693 346895 2 2013-01-02 130657602 403504 3 2013-01-03 134643672 387462 x5-aggs.R
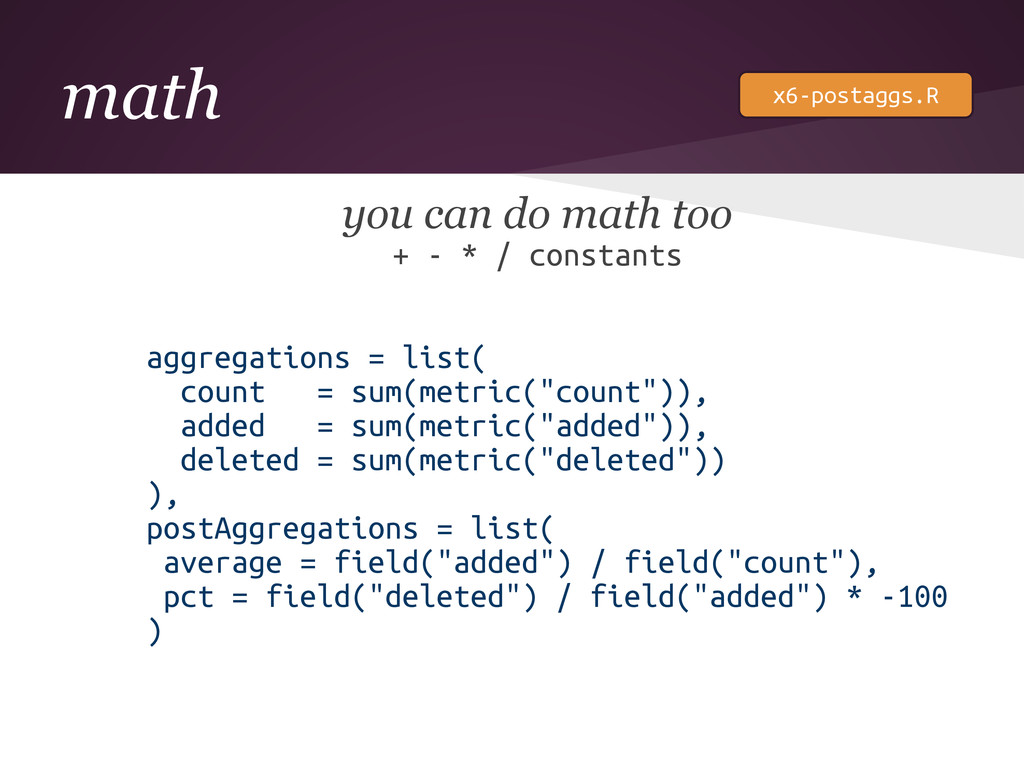
math you can do math too + - * /
constants aggregations = list( count = sum(metric("count")), added = sum(metric("added")), deleted = sum(metric("deleted")) ), postAggregations = list( average = field("added") / field("count"), pct = field("deleted") / field("added") * -100 ) x6-postaggs.R
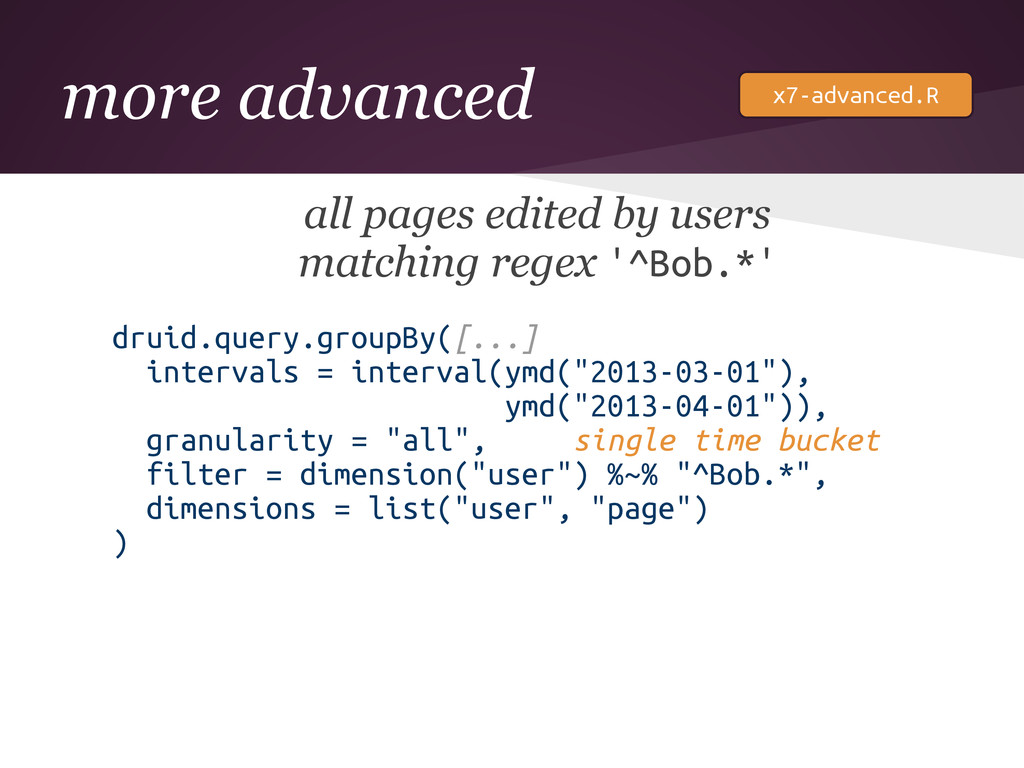
more advanced all pages edited by users matching regex '^Bob.*'
druid.query.groupBy([...] intervals = interval(ymd("2013-03-01"), ymd("2013-04-01")), granularity = "all", single time bucket filter = dimension("user") %~% "^Bob.*", dimensions = list("user", "page") ) x7-advanced.R
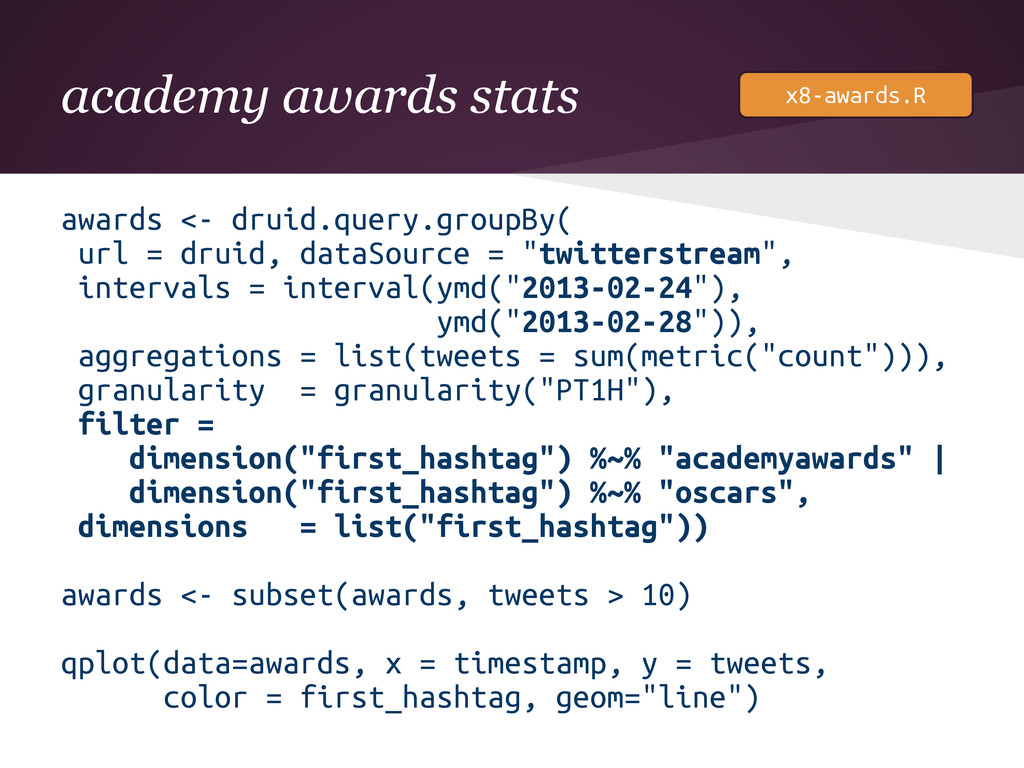
academy awards stats awards <- druid.query.groupBy( url = druid, dataSource
= "twitterstream", intervals = interval(ymd("2013-02-24"), ymd("2013-02-28")), aggregations = list(tweets = sum(metric("count"))), granularity = granularity("PT1H"), filter = dimension("first_hashtag") %~% "academyawards" | dimension("first_hashtag") %~% "oscars", dimensions = list("first_hashtag")) awards <- subset(awards, tweets > 10) qplot(data=awards, x = timestamp, y = tweets, color = first_hashtag, geom="line") x8-awards.R
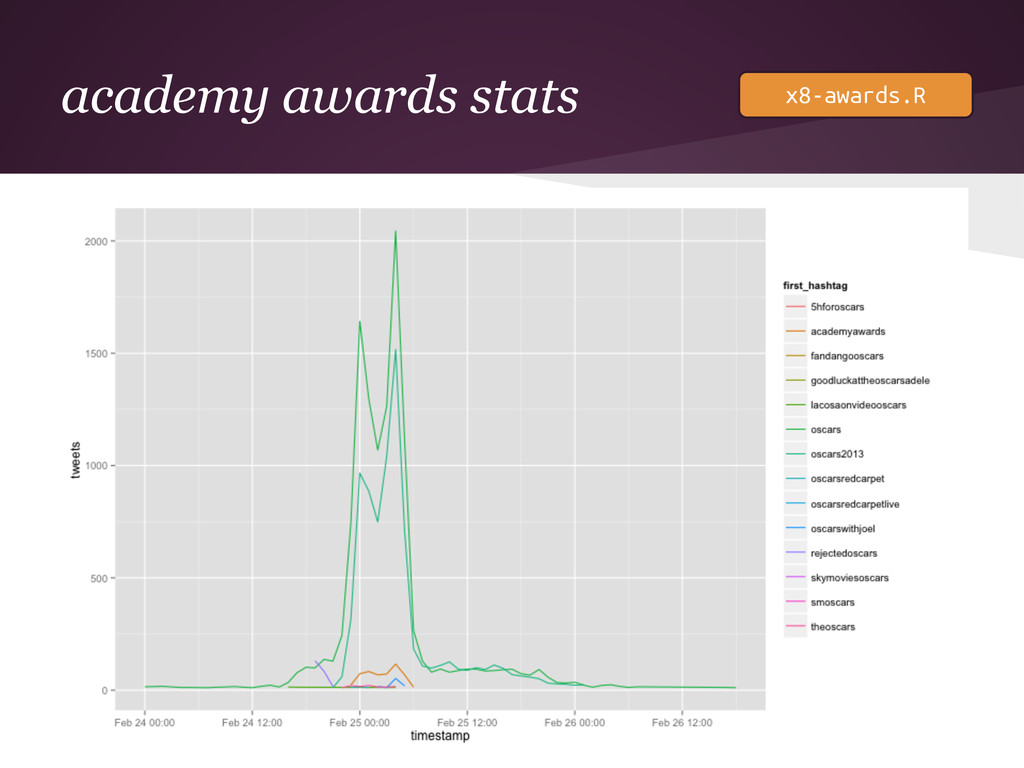
academy awards stats x8-awards.R
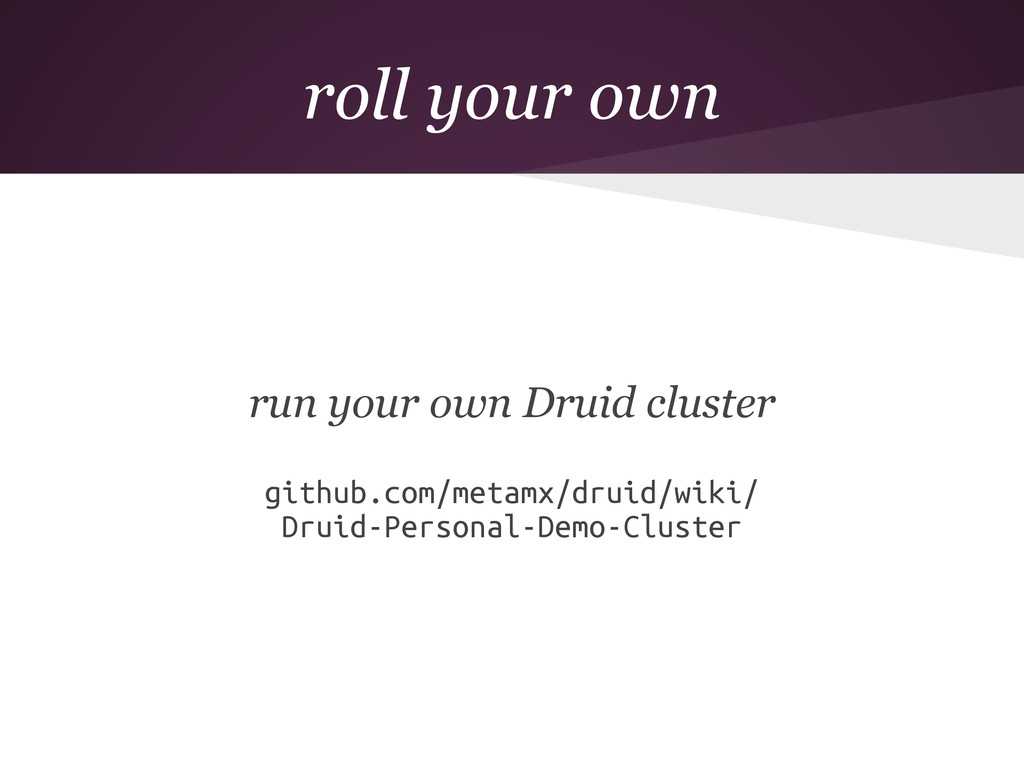
roll your own run your own Druid cluster github.com/metamx/druid/wiki/ Druid-Personal-Demo-Cluster
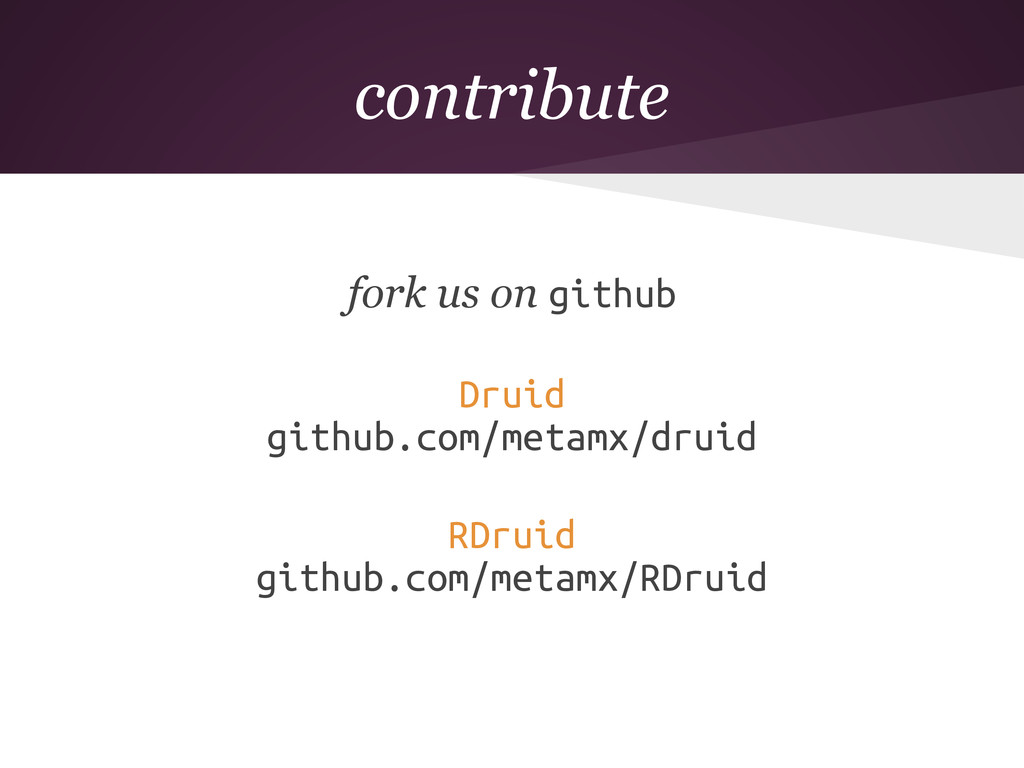
contribute fork us on github Druid github.com/metamx/druid RDruid github.com/metamx/RDruid
thank you