$30 off During Our Annual Pro Sale. View Details »

Python Profiling and Performance - Elementary to Enterprise

Python Profiling and Performance - Elementary to Enterprise

Delivered at PyBay 2016 (http://pybay.com/) on August 21, 2016 in UCSF Mission Bay's Convention Center.

If you enjoyed this, you will likely enjoy my course on Enterprise Software with Python, published by O'Reilly:

http://shop.oreilly.com/product/0636920047346.do

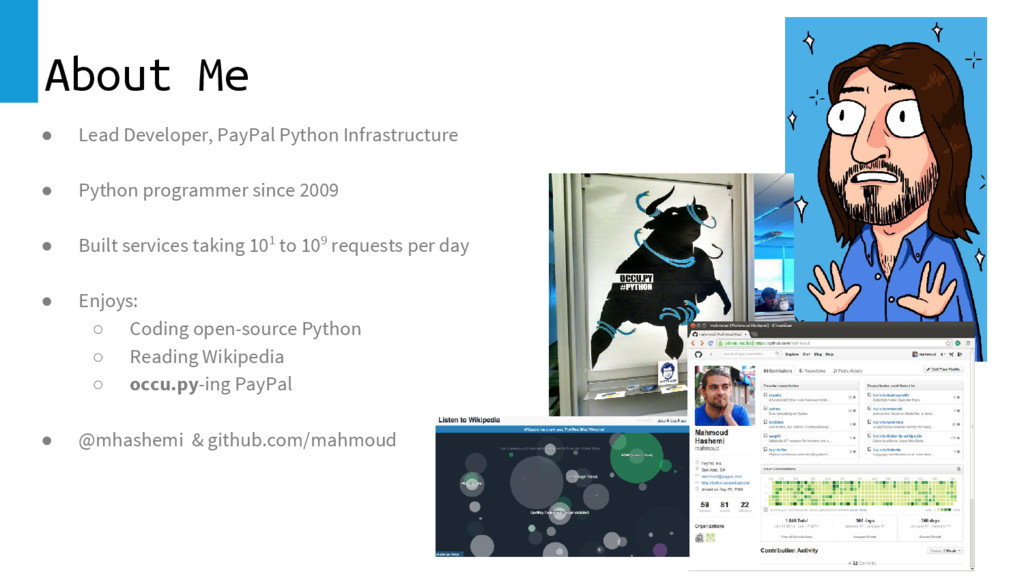
Shortform on Twitter: @mhashemi
Longform on my blog: http://sedimental.org
Code on GitHub: https://github.com/mahmoud

See you next year!

Mahmoud Hashemi

August 21, 2016
Tweet

More Decks by Mahmoud Hashemi

Other Decks in Programming

Transcript

  1. Python Profiling and Performance
    Python
    Profiling
    & Performance
    Elementary to Enterprise

    View Slide

  2. About Me
    ● Lead Developer, PayPal Python Infrastructure
    ● Python programmer since 2009
    ● Built services taking 101 to 109 requests per day
    ● Enjoys:
    ○ Coding open-source Python
    ○ Reading Wikipedia
    ○ occu.py-ing PayPal
    ● @mhashemi & github.com/mahmoud

    View Slide

  3. Python Profiling and Performance - Mahmoud Hashemi
    Profiling and performance
    The engineer’s delight and/or doom.
    ● Types of performance
    ● Ground rules
    ● Profiling tools
    ● Scaling strategies
    GOTTA GO FAST

    View Slide

  4. Python Profiling and Performance - Mahmoud Hashemi
    Performance types
    What is fast?
    1. Latency - Response time
    “200 millisecond client roundtrip”
    2. Throughput - Successful traffic flow
    “200 requests per second”
    3. Efficiency - Utilization and return on investment
    “2000 users per 4-core VM at 50% CPU”
    X. Scalability - Not a type of performance
    Complex, and often more about scaling people than software

    View Slide

  5. Python Profiling and Performance - Mahmoud Hashemi
    Safety first!
    Always wear your seatbelt, helmet, and check your mirrors:
    1. Predictability is power
    2. Good work takes cycles
    3. Abide by Amdahl’s Law
    Performance ground rules

    View Slide

  6. Python Profiling and Performance - Mahmoud Hashemi
    Predictability is power
    ● Automated tests first, then benchmarks
    ● Test after every optimization
    ● Remember, optimized code is:
    ○ Harder to write and read
    ○ Less maintainable
    ○ Buggier, more brittle
    ● See CPython’s consistency:
    ○ Fast startup
    ○ No JIT, no warmup
    ○ No complex GC
    Performance ground rule #1

    View Slide

  7. Python Profiling and Performance - Mahmoud Hashemi
    Good work takes cycles
    ● Healthy enterprise applications have big bones
    ● Gather requirements
    ○ Security
    ○ Instrumentation
    ○ Compatibility
    ● Establish percentile SLAs: 50, 95, 99, max
    ● Stick to the budget and put down the ping pong paddles
    ● Good enough is good enough!
    Performance ground rule #2

    View Slide

  8. Python Profiling and Performance - Mahmoud Hashemi
    Abide by Amdahl’s Law
    ● Speedups are relative to task significance
    ● Keep perspective, maximize impact
    ● Focus on one part at a time
    ● Recheck proportions after every optimization
    Performance ground rule #3
    https://commons.wikimedia.org/wiki/File:Optimizing-different-parts.svg

    View Slide

  9. Python Profiling and Performance - Mahmoud Hashemi
    Performance ground rules
    Always wear your seatbelt, helmet, and check your mirrors:
    1. Predictability is power
    2. Good work takes cycles
    3. Abide by Amdahl’s Law
    Recap

    View Slide

  10. Python Profiling and Performance - Mahmoud Hashemi
    Python profiling tools
    1. Casual profiling
    ○ time.time()
    ○ timeit module
    2. Offline profiling
    ○ cProfile
    ○ Other advanced options
    3. Online profiling

    View Slide

  11. Python Profiling and Performance - Mahmoud Hashemi
    time.time()
    Trusty, print-based debugging will never die:
    import time
    start = time.time()
    do_work()
    print time.time() - start, 'seconds'
    Casual Python profiling
    Easy to use and explain. But:
    ● Single measurement might misrepresent
    ● Measurement expense could exceed operation
    ● Must switch to time.clock() on Windows for better resolution
    ● Gets tedious

    View Slide

  12. Python Profiling and Performance - Mahmoud Hashemi
    The timeit module
    Built-in, and fixes the main problems of time.time()-based profiling:
    ● Does multiple runs to offset system variability
    ● Each run does thousands or millions of repetitions,
    compensating for very fast operations
    ● Automatically uses the platform’s best timing function
    ● Multiple easy usage patterns
    Command line
    $ python -m timeit -s "import json" "json.dumps({})"
    1000000 loops, best of 3: 1.73 usec per loop
    Python
    import timeit
    print timeit.repeat('json.dumps({})', setup='import json', number=1000000, repeat=3)
    Casual Python profiling
    Other timeit facts:
    ● It disables garbage collection for
    even more consistency
    ● It represents one of the few valid
    uses of Python code generation
    ● Jupyter notebook has built-in
    support (%%timeit)
    ● Less than 300 lines of code
    Notable successor: perf
    ● Runs separate processes
    ● Somewhat more statistical
    ● Still easy to use

    View Slide

  13. Python Profiling and Performance - Mahmoud Hashemi
    The cProfile module
    Simpler tools assume you know which code you want to measure,
    whereas the built-in cProfile module:
    ● Measures a whole thread of execution
    ● Identifies time-consuming functions
    ● Command-line and programmatic interfaces
    Command line
    $ python -m cProfile target_code.py
    Python
    import cProfile, pstats
    pr = cProfile.Profile()
    pr.enable()
    # call the code you want to measure
    pr.disable()
    pstats.Stats(pr).sort_stats('time').print_stats()
    Offline Python profiling
    624865 function calls (517453 primitive calls) in 0.289 seconds
    Ordered by: internal time
    List reduced from 44 to 10 due to restriction <10>
    ncalls tottime percall cumtime percall filename:lineno(function)
    2989/7 0.054 0.000 0.186 0.027 serdes.py:365(vo_tree)
    12618/45 0.040 0.000 0.106 0.002 serdes_bin.py:78(append_field)
    16393 0.037 0.000 0.044 0.000 serdes.py:315(_uniq_field)
    84450/48 0.028 0.000 0.186 0.004 serdes.py:348(field_tree)
    84450 0.023 0.000 0.037 0.000 {getattr}
    68389 0.014 0.000 0.014 0.000 field.py:116(__get__)
    26182 0.012 0.000 0.017 0.000 serdes_bin.py:128(append_int)
    2757 0.009 0.000 0.010 0.000 serdes.py:336(_uniq_vo)
    2489/43 0.008 0.000 0.105 0.002 serdes_bin.py:205(append_vo)
    5103/94 0.007 0.000 0.103 0.001 serdes_bin.py:192(append_list)
    The cProfile + pstats text output is utilitarian, but interesting
    visualizations can be created with RunSnakeRun, SnakeViz,
    Gprof2dot, pyprof2calltree, and pyinstrument.

    View Slide

  14. Python Profiling and Performance - Mahmoud Hashemi
    Advanced tooling
    Offline Python profiling
    ● line_profiler
    ○ Line-by-line profiling inside of functions
    ● yep
    ○ Function-oriented profiler that crosses the Python-C boundary
    ● GreenletProfiler
    ○ A concurrency-friendly profiler for applications using greenlet
    ● memory_profiler
    ○ Process and line-by-line memory consumption measurement
    A variety of measurement and tuning tools
    can be built out of the following modules:
    ● sys.setprofile()
    ● sys.settrace()
    ● sys._getframe()
    ● gc
    ● resource
    ● psutil (not built-in)
    Just run a search for “python ”
    and check out the docs.
    Also, the built-in dis module works well for
    getting the most out of line_profiler

    View Slide

  15. Python Profiling and Performance - Mahmoud Hashemi
    Online profiling
    Offline profiling involves hypothetical scenarios,
    historical data, and performance sacrifice.
    Online profiling offers:
    ● Imperceptible performance impact
    ● Live data collection, in real time
    Online profiling requires more time to be accurate.
    Still, ending speculation is worth the work.
    At PayPal we use sampro for its lightweight
    online collection process. We also use
    lithoxyl for semantic instrumentation,
    including performance measurements.
    github.com/doublereedkurt/sampro
    github.com/mahmoud/lithoxyl

    View Slide

  16. Python Profiling and Performance - Mahmoud Hashemi
    Scaling strategies
    There are eight ways to scale Python projects.
    1. Add more hardware
    2. Rearchitect to divide work
    3. Adopt the asynchronous approach
    4. Use a smarter algorithm
    5. Write faster Python
    6. Build native Python extensions
    7. Use a library with a faster implementation
    8. Use a different Python runtime
    At PayPal we’ve used all 8 of these, and
    most multi-engineer projects will use at
    least four or five.

    View Slide

  17. Python Profiling and Performance - Mahmoud Hashemi
    Add more hardware
    Python scaling strategy #1
    Adding more hardware is something enterprises often do best. It’s the obvious
    choice, and is either a “happy path” solution or a last-ditch desperation move.
    The Good
    ● Solves certain problems
    ● Easy to explain
    ● The essence of scalability
    The Bad
    ● Only solves certain problems
    ● Provisioning & deployment must scale
    ● Budget limits
    If adding more machines solves all your problems in a reliable and cost-effective
    manner, congratulations on achieving scalability!

    View Slide

  18. Python Profiling and Performance - Mahmoud Hashemi
    Rearchitect to divide work
    Python scaling strategy #2
    Whether split across machines or CPUs, reworking your application to redistribute
    the work can make sense technically and organizationally.
    The Good
    ● Easy-to-explain principle
    ● Many SOA technologies
    The Bad
    ● Easy to mess up
    ○ Short-term correctness
    ○ Long-term extensibility
    ● “Now you have n2 problems”
    Scaling through abstractions like services and queues is such a common enterprise
    practice that there are bound to be replicable success stories within your organization.

    View Slide

  19. Python Profiling and Performance - Mahmoud Hashemi
    Adopt the asynchronous approach
    Python scaling strategy #3
    In IO-bound scenarios, this is the go-to method for getting more done.
    The Good
    ● Many libraries exist
    ● Great way to learn about
    operating systems and Python
    The Bad
    ● Drastically changes application
    ● Complicates code, especially debugging
    ● Limits “off-the-shelf” library usage
    Make sure you need it. Ask: What are the utilization requirements? How many
    requests per process are being handled now?
    Applications of substance are rarely only IO-bound, and the limitations brought
    by async can complicate feature development.

    View Slide

  20. Python Profiling and Performance - Mahmoud Hashemi
    Use a smarter algorithm
    Python scaling strategy #4
    The ideal way to reduce work and speed up projects in CPU-bound scenarios.
    The Good
    ● Python is runnable pseudocode!
    ● Many books and Wikipedia articles
    ● Good for those interview questions
    The Bad
    ● Might be hard to find
    ● Often takes time to understand
    ● Language-specific algorithms
    Python has many built-in examples of this approach. bisect and heapq for list
    operations, itertools for iterators, re for string operations, among others.
    Even naive implementations can be made smarter through careful caching.
    Always make sure your queues and caches are bounded!

    View Slide

  21. Python Profiling and Performance - Mahmoud Hashemi
    Write faster Python
    Python scaling strategy #5
    Python has obvious ways of doing things, but they aren't always the fastest.
    The Good
    ● Packaging & deployment stay the same
    ● Easy to measure and iterate
    ● Same debugging and profiling tools
    ● Python builtins are fast!
    The Bad
    ● Gains can be small
    ● Minimal parallelization
    ● Code can be less clear
    Relatively low-risk, high-reward, and easy to get started using aforementioned
    profiling techniques. Becomes second nature pretty readily.

    View Slide

  22. Python Profiling and Performance - Mahmoud Hashemi
    Build a native Python extension
    Python scaling strategy #6
    Python’s close relationship with C is one of its greatest strengths.
    The Good
    ● C has 2-10x less overhead
    ● Integrate with C open-source ecosystem
    ● CPython is clean, idiomatic C
    ● Cython is mature and greatly helpful
    The Bad
    ● C has riskier bugs
    ● Takes longer to get right
    ● Complicates build and deployment
    Not for the faint of heart, but the partnership of Python and C is a key to
    performance and scale found in almost every Python enterprise.

    View Slide

  23. Python Profiling and Performance - Mahmoud Hashemi
    Use a faster implementation
    Python scaling strategy #7
    Python has a huge community, so let’s leverage those open-source libraries.
    The Good
    ● Python standards
    ● Often “just works”
    ● Many libraries are drop-in
    The Bad
    ● Availability and maturity
    ● Architectural compatibility
    ● Build and deployment constraints
    There are so many success stories here. Built-in, ElementTree vs cElementTree,
    and external, json vs ujson. Not to mention all the libraries based on NumPy for
    fast math. See the “Choosing Dependencies” segment for more specific guidance.

    View Slide

  24. Python Profiling and Performance - Mahmoud Hashemi
    Use a different runtime
    Python scaling strategy #8
    While CPython reigns supreme, Python does have alternate implementations, like
    PyPy and Jython, which can offer some scalability benefits in specific cases.
    The Good
    ● 2-10x speedups depending
    ● Easy to test for simple projects
    ● Work with cool new features
    ● Great for a blog posts
    The Bad
    ● Drastically changes deployment
    ● Architecture and environment limits
    ● Libraries are often incompatible
    ● All large projects will need code rework
    While some experimentation is fine, this type of change almost never happens,
    making it a very risky scaling strategy for substantial projects.

    View Slide

  25. Python Profiling and Performance - Mahmoud Hashemi
    Quick recap
    Remember and reference:
    ● How to define “performant”
    ● How to stay safe when optimizing
    ● How to measure
    ● How to scale 8 ways from Sunday
    Profiling and performance
    GOTTA GO FAST

    View Slide

  26. Python Profiling and Performance
    No silver bullets.
    Measure, optimize, and perform.

    View Slide

  27. Python Profiling and Performance - Mahmoud Hashemi
    Thanks!
    @mhashemi
    github.com/mahmoud
    sedimental.org
    paypal-engineering.com/tag/python
    O’Reilly’s Enterprise Software with Python

    View Slide

  28. Python Profiling and Performance - Mahmoud Hashemi

    View Slide