Upgrade to Pro — share decks privately, control downloads, hide ads and more …

Navigation Control of Agent Automobiles Using Wireless Sensor Network

Navigation Control of Agent Automobiles Using Wireless Sensor Network

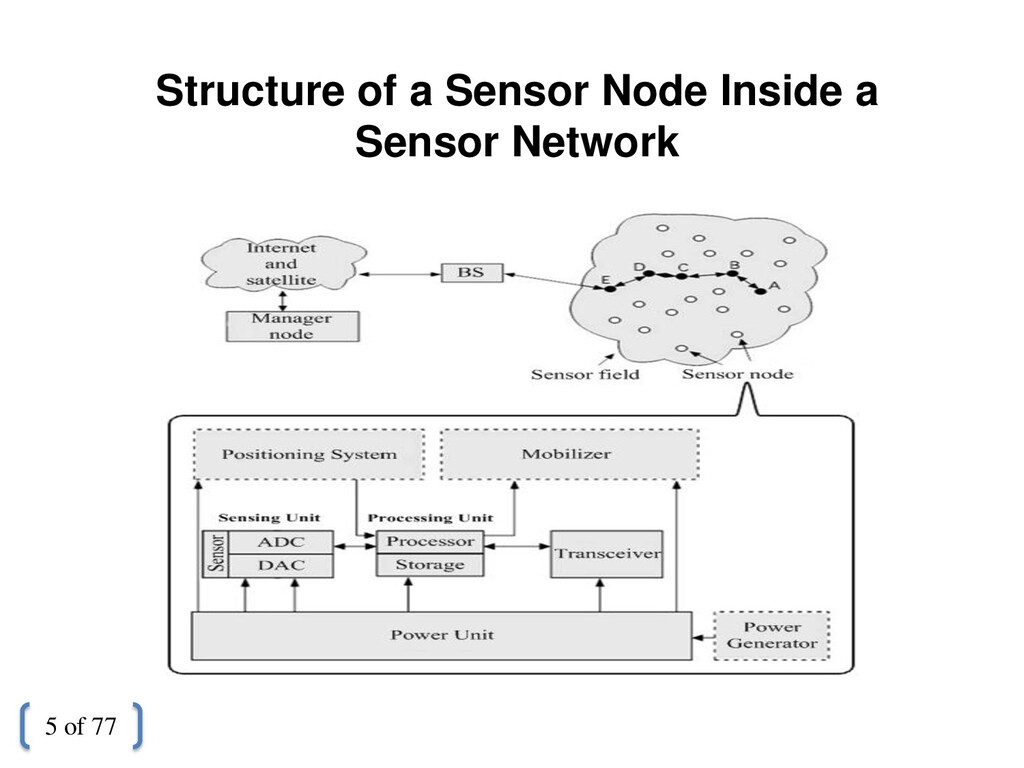
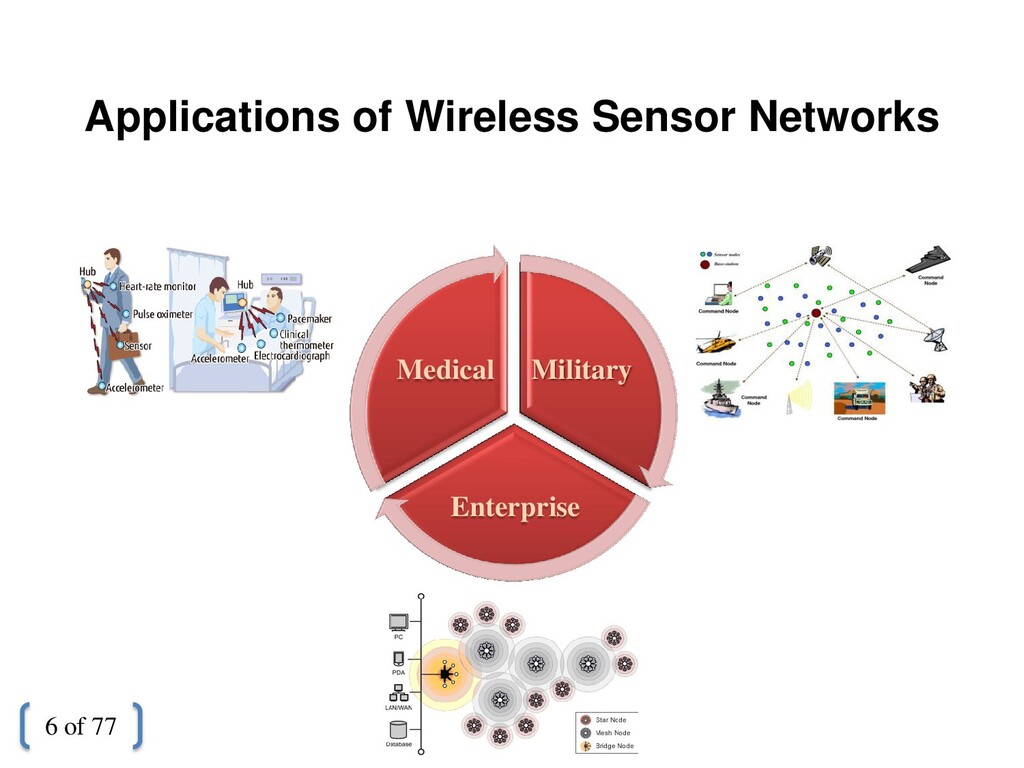
Wireless sensor network is an interesting research area that has been extensively discussed because of its importance in the most applications such as environmental monitoring, healthcare purposes, traffic control, and military systems. Sensor network consists of a large number of sensor nodes that are widely distributed in the environment to collect phenomena data. In this thesis, a smart fire system is proposed to predict, control, and alert fire occurrences by using multiple fuzzy-based methods. This system aids less energy to be consumed for transmitting various messages between wireless nodes, network traffic to be reduced over the network, and network lifetime to be prolonged consequently. The proposed routing protocols are, generally, categorized into two groups: static and dynamic. The static protocols are used to transmit data packets between the stationary nodes placed in different locations. The dynamic protocols direct, control, and transmit messages between vehicles and rescue team members. Besides, several fuzzy systems are offered to detect explosion possibility, determine fire probability, measure the intensity and volume of the fire, estimate fire progress, detect the burn possibility, and determine suffocation probability. In addition, the system determines the active and passive nodes as well as detects failure nodes throughout the network. Rescue teams are dispatched to events on the best path, between fire department and event place, that is selected by another fuzzy-based procedure. This procedure leads the rescue and support teams to be dispatched to events in a short time. Simulation and evaluation results show that the proposed fire system has a high performance compared to the most existing fire systems.

Mohammad Samadi Gharajeh

February 03, 2013
Tweet

More Decks by Mohammad Samadi Gharajeh

Other Decks in Science

Transcript

  1. Navigation Control of Agent Automobiles Using Wireless Sensor Network Supervisor:

    Prof. Dr. Sohrab Khanmohammadi Advisor: Dr. Majid Haghparast Presenter: Mohammad Samadi Gharajeh February 2013 Islamic Azad University Tabriz Branch Department of Computer Engineering
  2. Contents • Introduction • Wireless Sensor Networks • Classic Logic

    and Fuzzy Logic • The Proposed Smart Fire System • Conclusions • Future Works • Publications • References 1 of 77
  3. Introduction Wireless communication is one of the main fundamentals of

    wireless sensor networks that are considered by researchers in the last decades. Furthermore, fuzzy logic is a useful tool to design and control the complex and unpredicted systems. A smart fire system is proposed in this thesis to monitor, control, and report fire events. This system uses several fuzzy controllers to conduct data routing, make appropriate decision, event detection, etc. It is worth to noting that navigation control of agent automobiles is one of the main elements of this system. 2 of 77
  4. Wireless Sensor Networks Wireless sensor networks are composed of low-energy,

    low-cost, large-scale sensor nodes. The nodes can communicate with each other without any initial structure. They have some constraints such as processing power, memory storage, and energy power. These constraints cause to some of the big challenges in these networks that should be attended by researchers. 3 of 77
  5. Classic Logic In classic logic, an statement is true or

    false. True statement is indicated by T(P)=1 and false statement is indicated by T(P)=0. Membership degree of element x in set A with universe of discourse U is represented by µA (x) as the below: µA (x)= Example: U={1, 2, 3, 4, 5}, A={1, 3, 4} µA (1)=1 and µA (5)=0 1 if x∈A 0 if x∉A 7 of 77
  6. Fuzzy Logic In this logic, like classic logic, membership degree

    of elements is represented by µA (x) where x is an element of set A and µ is a membership function that determines belongingness degree of x to A. Example: U={1, 2, 3, 4, 5} A={(0.4/1), (1.0/2), (0.5/3), (0.0/4), (0.0/5)} 8 of 77
  7. Steps of Fuzzy Sets Determine membership functions Split the minimum

    and maximum values to several parts Define linguistic terms Specify the minimum and maximum values of the universe of discourse 9 of 77
  8. An Example of Linguistic Terms in Fuzzy Logic 0 1

    T0 T1 T2 T3 T4 T5 T6 T7 T8 T9 INPUT VARIABLE: TEMPERATURE Cold Cool Nice Warm Hot U={-40, -10, 5, 20, 30, 50} Warm={(0.0/-40), (0.0/-10), (0.0/5), (0.4/20), (1.0/30), (0.5/50)} 10 of 77
  9. Some of the Fuzzy Rules in a Detection System of

    Automobile Speed Output parameter Input parameters Speed (km/h) Brake line (meter) Weight (ton) Very low Very short Very light Low Short Light Medium Moderate Normal High Long Heavy Very high Too long Very heavy 11 of 77
  10. The Proposed Smart Fire System Elements of the proposed smart

    fire system to monitor, control, and report fire events based on fuzzy decision making are listed as the followings: • System architecture  The considered environments o Indoor environment o Outdoor environment o Data transmission methods in the environments  Network identifier (NI) • Packet format • 3D fuzzy routing • Determining the state of sensor nodes • Data aggregation methods • Event detection • Fire fighting operations • Determining the fault probability of sensor nodes 13 of 77
  11. Indoor Environment  This environment can be composed of multiple

    stages.  Every stage can be divided to several parts denoted by section.  Common spaces between sections at every stage (e.g., hallway) is denoted by common section.  3D static fuzzy routing is used for data transmissions into common sections.  Every section includes various boundary nodes to communicate data packets between the manager of sections and the nodes of common sections.  Every stage has a stage manager that makes relation between the manager of common sections and the environment manager.  The managers of common sections communicate with each other and also with the environment manager via the wireless or wired communications. 14 of 77
  12. Outdoor Environment  Every outdoor environment is composed of various

    parts, denoted by section. Every section has a manager.  Common paths between several sections at each level is denoted by interface way that has a unique identifier.  Data transmissions between the nodes of interface ways are conducted by 3D fuzzy routing.  Initial decision to detect various events and/or perform operations is made by the environment manager. 16 of 77
  13. Data Transmission Process in the Environments Data transmission process is

    determined based on a feature namely ‘SendDataType’. This feature is stored in sensor nodes of the section, stage, and environment managers. Nodes of every section transmit all the sensing data to the section manager without any data aggregation mechanism. In contrast, section manager can transmit all of the gathered data or only the data packets aggregated by a fuzzy process to the top-level manager. 17 of 77
  14. Network Identifier (NI) All elements of the system are identified

    by a network identifier (NI). This identifier is composed of five segments as the below: • Environment No. or fire department No. • Section No. • Stage No. in the indoor environment • Section No. or common section No. • Node No. 18 of 77
  15. 3D Fuzzy Routing • Static 3D fuzzy routing protocols o

    Static 3D fuzzy routing based on receiving probability (SFRRP) o Static 3D fuzzy routing based on traffic probability (SFRTP) o Static 3D fuzzy routing based on the receiving and traffic probabilities (SFRRTP) • Dynamic 3D fuzzy routing protocols o Dynamic 3D fuzzy routing based on receiving probability (DFRRP) o Dynamic 3D fuzzy routing based on traffic probability (DFRTP) o Dynamic 3D fuzzy routing based on the receiving and traffic probabilities (DFRRTP) 19 of 77
  16. Geographical Coordinates of the Points in 3D Fuzzy Routing •

    Geographical coordinates of the base station o BSx : axis x of the base station o BSy : axis y of the base station o BSz : axis z of the base station • Geographical coordinates of the sender node o Nodex : axis x of the sender node o Nodey : axis y of the sender node o Nodez : axis z of the sender node • Geographical coordinates of the neighbor node o Neighborx : axis x of the neighbor node o Neighbory : axis y of the neighbor node o Neighborz : axis z of the neighbor node • Geographical coordinates of the nearest point on the sender node’s signal range o Px : axis x of the nearest point o Py : axis y of the nearest point o Pz : axis z of the nearest point 21 of 77
  17. Vx = BSx – Nodex Vy = BSy – Nodey

    Vz = BSz – Nodez magV = Px = Nodex + [(Vx /magV) * R] Py = Nodey + [(Vy /magV) * R] Pz = Nodez + [(Vz /magV) * R] Distance = Distance Between Sender Node and the Base Station in 3D Fuzzy Routing 22 of 77
  18. Linguistic Terms of the 3D Fuzzy Routing The receiving, traffic,

    and success probabilities • Very low • Low • Medium • High • Very high The number of neighbors • Feeble • Few • Normal • Many • Lots Distance • Very near • Near • Moderate • Away • Far away 23 of 77
  19. Fuzzy Decision Making in the 3D Fuzzy Routing Protocol Input

    parameters Output parameter First parameter Second parameter SFRRP Distance The number of neighbors Receiving probability SFRTP Distance The number of neighbors Traffic probability SFRRTP Receiving probability Traffic probability Success probability DFRRP Distance The number of neighbors Receiving probability DFRTP Distance The number of neighbors Traffic probability DFRRTP Receiving probability Traffic probability Success probability 24 of 77
  20. Some of the Fuzzy Rules in SFRRP and SFRTP Input

    parameters Output parameters Distance The number of neighbors Receiving probability in SFRRP Traffic probability in SFRTP Away Many Low High Near Few Medium Low Very near Lots High High Far away Feeble Very low High Moderate Lots Medium High 25 of 77
  21. Some of the Values in SFRRP and SFRTP Node No.

    Input parameters Output parameters Distance The number of neighbors Receiving probability in SFRRP Traffic probability in SFRTP 1 140 5 46.225 53.153 2 120 10 41.572 58.167 3 65 3 48.311 47.668 4 90 7 45.212 52.916 5 15 1 47.962 42.043 26 of 77
  22. Some of the Fuzzy Rules in SFRRTP Input parameters Output

    parameter Receiving probability Traffic probability Success probability Very low Medium Very low Low Medium Low Medium Medium Low High Low Medium Very high Low Very high 27 of 77
  23. Membership Functions in SFRRTP 0 20 40 60 80 100

    0 50 100 0 0.2 0.4 0.6 0.8 1 Success Probability (%) Rule R Based on the Success Probability and Traffic Probability Traffic Probability (%) Rule R 0 20 40 60 80 100 0 50 100 0 0.2 0.4 0.6 0.8 1 Success Probability (%) Rule R Based on the Success Probability and Receive Probability Receive Probability (%) Rule R 28 of 77
  24. Some of the Values in SFRRTP Node No. Input parameters

    Output parameter Receiving probability Traffic probability Success probability 1 46.225 53.153 42.571 2 41.572 58.167 46.207 3 48.311 47.668 41.895 4 45.212 52.916 42.549 5 47.962 42.043 42.453 29 of 77
  25. Simulation Parameters in Static 3D Fuzzy Routing Protocols Parameter Default

    value Topographical area (m3) 300 × 300 × 300 The number of nodes 50 Radio range of nodes (m) 75 Initial energy of nodes (J) 5 Data packet size (bit) 104 Geographical coordinates of the base station (m) ( 0 , 150 , 150 ) 31 of 77
  26. Total Energy Consumption in Static 3D Fuzzy Routing Protocols 0

    5 10 15 20 25 1 2 3 4 5 6 7 8 9 10 11 12 Total Energy Consumption (J) Cycle Number Flooding SFRRP SFRTP SFRRTP 32 of 77
  27. The Number of Live nodes in Static 3D Fuzzy Routing

    Protocols 0 10 20 30 40 50 60 1 2 3 4 5 6 7 8 9 10 11 12 The Number of Live Nodes Cycle Number Flooding SFRRP SFRTP SFRRTP 33 of 77
  28. The Number of Delivered Data in Static 3D Fuzzy Routing

    Protocols 0 20 40 60 80 100 120 140 1 2 3 4 5 6 7 8 9 10 11 12 Number of Delivered Data Cycle Number Flooding SFRRP SFRTP SFRRTP 34 of 77
  29. The Effect of Data Generation Rate on the Static 3D

    Fuzzy Routing Protocols Data generation rate Packet delivery ratio Packet delivery time Flooding SFRRP SFRTP SFRRTP Flooding SFRRP SFRTP SFRRTP 1000 0.37931 0.9913793 0.982759 0.9913793 7.2273 3.2348 2.9035 3.2522 900 0.34483 0.977612 0.9925373 0.977612 7.95 2.8168 2.9248 2.8321 800 0.33083 0.986667 1 0.986667 7.2273 3.2297 3.5 3.2838 700 0.27957 0.985782 0.976303 0.985782 6.1154 3.3894 3.2233 3.4135 600 0.32353 1 0.9933333 1 7.2273 2.7133 2.7047 2.76 500 0.26818 0.9918367 0.9918367 0.9918367 5.3898 3.3128 3.1893 3.3169 400 0.24055 0.987879 0.984848 0.987879 4.5429 3.3681 3.3015 3.3742 300 0.27244 0.982558 0.997093 0.982558 279 2.8018 2.8921 2.8373 200 0.23282 0.9918301 0.996732 0.9918301 150.69 3.2751 3.1344 3.29 100 0.22068 0.988067 0.9968178 0.988067 211.75 3.2987 3.3081 3.3132 35 of 77
  30. Simulation Parameters in Dynamic 3D Fuzzy Routing Protocols 37 of

    77 Parameter Default value Topographical area (m3) 200 × 200 × 200 The number of nodes 25 Radio range of nodes (m) 80 Initial energy of nodes (J) 5 Data packet size (bit) 104 Geographical coordinates of the base station (m) ( 0 , 200 , 200 )
  31. Total Energy Consumption in Dynamic 3D Fuzzy Routing Protocols 0

    2 4 6 8 10 12 14 16 18 1 2 3 4 5 6 7 8 9 10 11 12 Total Energy Consumption (J) Cycle Number DSR DPG A-star and Fuzzy DFRRP DFRTP DFRRTP 38 of 77
  32. The Number of Live nodes in Dynamic 3D Fuzzy Routing

    Protocols 0 5 10 15 20 25 30 1 2 3 4 5 6 7 8 9 10 11 12 The Number of Live Nodes Cycle Number DSR DPG A-star and Fuzzy DFRRP DFRTP DFRRTP 39 of 77
  33. The Number of Delivered Data in Dynamic 3D Fuzzy Routing

    Protocols 0 5 10 15 20 25 1 2 3 4 5 6 7 8 9 10 11 12 Number of Delivered Data Cycle Number DSR DPG A-star and Fuzzy DFRRP DFRTP DFRRTP 40 of 77
  34. The Effect of Data Generation Rate on the Dynamic 3D

    Fuzzy Routing Protocols Data generation rate Packet delivery ratio Packet delivery time DSR DFRRP DFRTP DFRRTP DSR DFRRP DFRTP DFRRTP 1000 0.125 1 0.875 1 163.5 1.6875 1.0714 1.5 900 0.07692 0.28571 0.42857 0.14286 163.5 0.875 2.0833 0.75 800 0.08 0.52 0.52 0.48 163.5 1.0769 1 1.0833 700 0.08 0.74074 0.7037 0.62963 163.5 1.6 1.7368 1.7059 600 0.07407 0.51852 0.55556 0.51852 163.5 1.0714 2.0667 1.0714 500 0.05556 0.55556 0.61111 0.41667 163.5 1.7 2.1364 1.8 400 0.04651 0.62222 0.64444 0.6 163.5 0.92857 1.3103 0.92593 300 0.0339 0.5 0.54839 0.40323 163.5 1.0968 1.8529 1.04 200 0.02667 0.58974 0.61538 0.5641 163.5 1.4783 1.8125 1.4318 100 0.02 0.52597 0.55195 0.44805 109 1.4321 1.6 1.4493 41 of 77
  35. Determining the State of Sensor Nodes by Fuzzy Decision Making

    (FAS) • Very low • Low • Medium • High • Very high Selection priority • Feeble • Few • Medium • Many • Lots The number of previous active states • Very low • Low • Medium • High • Very high Remaining energy of nodes 42 of 77
  36. Some of the Fuzzy Rules in FAS Rule # Input

    parameters Output parameter Remaining energy of nodes The number of previous active states Selection priority 1 Very low Feeble Very low 2 High Few High 3 Medium Medium Medium 4 Very high Lots Low 5 High Many Low Node No. Input parameters Output parameter Remaining energy of nodes The number of previous active states Selection priority 1 2 11 44.913 2 1.2 15 42.027 3 0.3 5 50.843 4 0.8 2 54.757 5 1.6 8 48.058 43 of 77
  37. Simulation Parameters in FAS Parameter Default value Topographical area (m2)

    200 × 200 The number of nodes 40 Initial energy of nodes (J) 2 Buffer size of the sink 104 Data generation rate 5 Period of time to transmit data from sink to base station 20 Geographical coordinates of the sink (m) (100 , 100) Geographical coordinates of the base station (m) ( 500 , 500 ) 44 of 77
  38. The Effect of Initial Energy in FAS 0 500 1000

    1500 2000 2500 3000 3500 4000 4500 0.1 0.3 1 1.1 1.2 1.3 1.4 2.2 Network Life (Rounds) Initial Energy (J) All Active RAS FAS Initial energy All Active RAS FAS 0.1 20 195 195 0.3 60 580 590 1 195 1800 1950 1.1 215 2150 2260 1.2 235 2130 2375 1.3 255 2275 2425 1.4 270 2470 2665 2.2 425 4000 4000 45 of 77
  39. The Effect of Data Generation Rate in FAS Data generation

    rate All Active RAS FAS 10 780 4000 4000 9 702 4000 4000 8 624 4000 4000 7 546 4000 4000 6 468 4000 4000 5 390 3420 3510 4 312 3008 3032 3 234 2136 2397 2 156 1540 1628 1 78 778 811 0 500 1000 1500 2000 2500 3000 3500 4000 4500 10 9 8 7 6 5 4 3 2 1 Network Life (Rounds) Data Generation Rate All Active RAS FAS 46 of 77
  40. Data Aggregation Methods  Individual data aggregation based on fuzzy

    logic: selecting data packets of the linguistic term which has the most data packets  Improved, individual data aggregation based on fuzzy logic: transmitting only the minimum, average, and maximum values of the selected data in previous method  Fuzzy data aggregation: transmitting the identifier number or name of the selected linguistic term Linguistic terms Very low Low Medium High Very high 47 of 77
  41. Event Detection Managers of the sections and common sections are

    the first nodes to detect various events including fire, suffocation, and burning. Period of time to discover the events is stored in the storage memory of these nodes. This process is conducted by using the individual or fuzzy methods of data aggregation. It uses sensing data of the temperature, photocell, and smoke sensors. 48 of 77
  42. Some of the Fuzzy Rules Used in Event Detection Output

    parameters Input parameters Burning probability Suffocation probability Fire probability Smoke Light intensity Temperature Very low Very low Very low Very light Very dark Very cold Very high Medium High Normal Very bright Warm Very low Low Low Heavy Very dark Cold Very low Low Very low Light Ordinary Cool Medium Medium Medium Normal Very bright Nice High High High Heavy Dark Hot Output parameters Input parameters Burning probability Suffocation probability Fire probability Smoke Light intensity Temperature 40.625 40.625 40.625 2 700 35 75 62.5 75 10 200 20 81.25 76.22 76.786 7 1450 150 49 of 77
  43. Membership Functions of the Variables in Event Detection -40 -15

    5 15 200 Ti VC CD CL N H μ 1 0 50 200 900 1500 Li VL L M H VH μ 1 0 2 5 8 10 Si VL L M U VU μ 1 0 25 50 75 100 FPi SPi BPi VL L M H VH μ 1 50 W 100 150 50 of 77
  44. Simulation Parameters to Determine the Fire, Suffocation, and Burning Probabilities

    Default value Parameter 200 × 200 Topographical area (m2) 40 The number of nodes 10 Initial energy of nodes (J) 5 Data generation rate 50 Threshold value of the temperature sensor (°C) 8 Threshold value of the smoke sensor (mg/m3) 900 Threshold value of the photocell sensor (lx) (100 , 100) Geographical coordinates of the base station (m) 51 of 77
  45. The Effect of Data Generation Rate in Fire Probability 0

    1000 2000 3000 4000 5000 6000 10 9 8 7 6 5 4 3 2 1 Network Life (Rounds) Data Generation Rate Threshold FPFL 0 100 200 300 400 500 600 700 10 9 8 7 6 5 4 3 2 1 Number of Wrong Alerts Data Generation Rate Threshold FPFL 52 of 77
  46. The Effect of Data Generation Rate in Suffocation Probability 0

    1000 2000 3000 4000 5000 6000 10 9 8 7 6 5 4 3 2 1 Network Life (Rounds) Data Generation Rate Threshold SPFL 0 50 100 150 200 250 300 10 9 8 7 6 5 4 3 2 1 Number of Wrong Alerts Data Generation Rate Threshold SPFL 53 of 77
  47. The Effect of Data Generation Rate in Burning Probability 0

    1000 2000 3000 4000 5000 6000 10 9 8 7 6 5 4 3 2 1 Network Life (Rounds) Data Generation Rate Threshold BPFL 0 50 100 150 200 250 300 350 10 9 8 7 6 5 4 3 2 1 Number of Wrong Alerts Data Generation Rate Threshold BPFL 54 of 77
  48. Fire Fighting Operations •Indoor navigation based on fuzzy logic •Categorizes

    of the operations oTo determine the fire volume oTo determine the fire progress oTo select the rescue members oTo determine the number of rescue teams oTo dispatch the rescue and support teams (agent automobiles) 55 of 77
  49. Indoor Navigation Based on Fuzzy Logic (INFL) Indoor navigation is

    one of the main requirements in fire operations. All sections and common sections should be controlled into the environment in order to select the best path to guide all people and appliances to the exit direction. Every path can be composed of several common sections. A fuzzy system is applied to select an appropriate path for this purpose. The ‘passing rate’, ‘distance to event place’ and ‘the number of people’ are the inputs and ‘safe probability’ is the output of this fuzzy system. 56 of 77
  50. Some of Fuzzy Rules in INFL Output parameter Input parameters

    Safe probability The number of people Distance to event place Passing rate Very low Lots Far away Very limited Medium Many Away Normal High Few Near Heavy Low Feeble Very near Very heavy Low Feeble Very near Limited 57 of 77
  51. How to Select the Best Path by INFL P1 =

    {C1, C3, C4} P2 = {C1, C4, C5} P3 = {C2, C3, C4, C5} Safe probability of each path can be measured by calculating the average of safe probabilities of all the common sections existing into the path. Therefore, safe probability of Path 1 is 54.32, safe probability of Path 2 is 57.117, and safe probability of Path 3 is 52.99975. Finally, Path 2 will be selected as the best path due to have the highest safe probability. Common sections Parameter C5 C4 C3 C2 C1 60 110 10 190 60 Passing rate 100 90 50 10 30 Distance to event place 50 140 35 13 165 The number of people 57.065 56.25 48.684 50 58.036 Safe probability 58 of 77
  52. To Determine the Fire Volume Based on Fuzzy Logic (FVFL)

    Output parameter Input parameters Fire volume Smoke Light intensity Temperature Medium Heavy Bright Cold High Heavy Ordinary Hot Low Normal Very dark Warm Low Normal Ordinary Very cold High Normal Very bright Nice Low Very heavy Very dark Cool Output parameter Input parameters Fire volume Smoke Light intensity Temperature 50 3 700 10 - 74.286 5 900 25 81.429 7 1400 140 59 of 77
  53. To Determine the Fire Progress Based on Fuzzy Logic (FPFL)

    Output parameter Input parameters Fire progress Interval time The difference of fire volume Decreasing Very low Decreasing Very high Low Normal Increasing Medium Partial Very high High Considerable Stable High No change Output parameter Input parameters Fire progress Interval time The difference of fire volume 164.73 55 5 - 227.16 5 20 268.52 10 40 60 of 77
  54. To Select Members of the Rescue Team Based on Fuzzy

    Logic (SRTFL) Output parameter Input parameters Success probability Fire volume Experience Age Very high Very low Beginner Young High Low Low experience Young High Very high Normal Middle-aged Very high High High experience Middle-aged Very high Medium Expert Old Output parameter Input parameters Member No. Success probability Fire volume Experience Age 40 60 8 30 1 55.435 45 15 40 2 52.335 25 25 50 3 20 35 60 AGj Y M A μ 1 0 5 15 20 30 EXj N L M EI ET μ 1 1 20 40 60 100 EDj VL L M H VH μ 1 0 25 50 75 100 SPj VL L M H VH μ 1 30 50 40 25 80 61 of 77
  55. To Determine the Number of Rescue Teams Based on Fuzzy

    Logic (DNRTFL) Output parameter Input parameters The number of teams Fire progress Fire volume Normal Decreasing Very low Emergency Stable Low Critical Increasing Medium Many Very high High Lots Decreasing Very high Output parameter Input parameters The number of teams Fire progress Fire volume 10 164 50 10 227 74 7 268 25 62 of 77
  56. Dispatching Method of the Rescue Teams Based on Fuzzy Logic

    (DMRTFL) There are various paths from local fire department or main fire department to event place. Hence, an appropriate path should be selected to dispatch the rescue agent automobiles. This method can also be used to dispatch rescue teams of the other fire departments toward the event place. It uses ‘path length’, ‘path traffic’, ‘passage probability’ and ‘arrival time’ to select the best path from among a list of all possible paths. 63 of 77
  57. Dispatching Method of the Rescue Teams Based on Fuzzy Logic

    (DMRTFL) Linguistic terms for ‘path length’ and ‘arrival time’ are ‘feeble’, ‘few’, ‘normal’, ‘many’ and ‘lots’. Moreover, linguistic terms for ‘path traffic’ and ‘passage probability’ are ‘very low’, ‘low’, ‘medium’, ‘high’ and ‘very high’. Output parameter Input parameters Arrival time Passage probability Path traffic Path length Normal High High Normal Feeble Low Medium Feeble Many Medium Low Lots Normal Medium Medium Few Feeble Very low High Many 0 50 100 150 300 PLi VL L M H VH μ 1 0 25 50 75 100 PTi VL L M H VH μ 1 0 25 50 75 100 PPi VL L M H VH μ 1 0 15 30 45 60 ATi VL L M H VH μ 1 64 of 77
  58. Simulation and Evaluation of the Dispatching Methods 1 5 2

    6 4 7 3 8 9 10 11 12 13 14 15 Output parameter Input parameters Destination Source Arrival time (min) Passage probability (%) Path traffic (%) Path length (m) 30 3 95 1 2 1 30 5 85 6 5 1 32.404 27 63 59 9 5 34.682 35 55 74 10 6 33.032 63 29 164 11 10 32.404 65 27 170 13 10 34.469 45 47 89 3 8 37.5 100 1 295 14 15 30 19 71 38 3 4 30 75 19 195 9 12 65 of 77
  59. Simulation and Evaluation of the Dispatching Methods Output parameter Input

    parameters Destination Source Arrival time (min) Passage probability (min) Path traffic (min) Path length (min) 64.682 64.682 64.682 64.682 10 2 95.268 95.268 100.53 95.268 15 4 95.32 97.801 95.32 97.801 5 13 99.591 156.87 170.27 156.87 9 8 103.36 124.47 205.59 124.47 5 8 93.032 98.169 98.497 98.169 11 12 64.778 127.21 138.4 127.21 8 10 98.371 161.56 110.27 161.56 13 8 107.24 131.97 139.18 131.97 6 15 136.09 156.33 165.58 156.33 15 5 124.78 186.38 136 186.38 8 12 30 30 30 30 30 30 30 30 30 30.3582 31.0623 31.746 32.4044 33.0324 33.6247 34.1763 34.6821 34.8489 35.2678 34.9039 34.4693 34.4693 34.9039 35.2678 35.3203 35.137 34.6821 34.1763 33.6247 33.0324 32.4044 31.746 31.0623 30.3582 30 30 30 30 30.9969 37.5 37.5 37.5 37.5 37.5 Node 1 Node 2 Node 3 Node 4 Node 5 Node 6 Node 7 Node 8 Node 9 Node 10 Node 11 Node 12 Node 13 Node 14 Node 15 66 of 77
  60. Determining the Fault Probability of Nodes Based on Fuzzy Logic

    (FPNFL) Output parameter Input parameters Fault probability Remaining energy of nodes Maximum volume of the events The number of events Medium High Noticeable Ordinary High Low Normal Feeble Low Medium Normal Few High Low Slight Many Very high Very low Partial Lots Output parameter Input parameters Node No. Fault probability Remaining energy of nodes Maximum volume of the events The number of events 43.878 28 55 15 1 50 34 15 25 2 37.918 48 65 50 3 37.5 23 45 45 4 46.934 4 60 27 5 67 of 77
  61. Financial and Human Losses in Dispatching Not Enough Agent Automobiles

    to the Event Place 69 of 77 Event # Fire volume (m2) Fire progress The number of required teams Financial losses (per minute) Total financial losses Human losses (per hour) Total human losses Random method The proposed DNRTFL The number of dead humans The number of injured humans The number of dead humans The number of injured humans 1 50 164 6 10 $4,000 $480, 000 1 2 2 4 2 25 268 4 7 $3,000 $360, 000 5 6 10 12 3 55 360 8 9 $6,000 $720, 000 4 3 8 6 4 70 700 12 16 $4,000 $480, 000 2 8 4 16 5 80 560 10 14 $5,000 $600, 000 3 4 6 8
  62. Selecting an Appropriate Fire Department to Dispatch Support Agent Automobiles

    to the Event Place 70 of 77 Fire department Dispatching methods Path length Path traffic Passage probability The proposed DMRTFL Arrival time (min) Path Arrival time (min) Path Arrival time (min) Path Arrival time (min) Path Main Fire Department 94.682 10 - 6 - 2 - 1 97.541 10 - 9 - 5 - 1 94.682 10 - 6 - 2 - 1 94.682 10 - 6 - 2 - 1 Fire Department 1 129.15 10 - 6 - 2 - 3 - 8 140.27 10 - 13 - 14 - 15 - 8 129.15 10 - 6 - 2 - 3 - 8 65.966 10 - 11 - 8 Fire Department 2 124.68 10 - 6 - 2 - 3 - 4 100.31 10 - 6 - 7 - 4 124.68 10 - 6 - 2 - 3 - 4 100.31 10 - 6 - 7 - 4
  63. Conclusions In this thesis, a smart fire system was proposed

    that can monitor, control, report, and perform the required operations in the indoor and outdoor environments. Static 3D fuzzy routing protocols were used to transmit data packets between stationary sensor nodes placed in the environment. Data transmissions between agent automobiles and rescue members were done by dynamic 3D fuzzy routing protocols. Moreover, agent automobiles can dispatch from fire departments to event places through appropriate paths by using the proposed fuzzy system. Members of the agent automobiles and rescue teams could also be selected by fuzzy system. Determining the fire probability, suffocation probability, burning probability, and fault probability of nodes are other features of this system. 71 of 77
  64. Future Works To enhance fault tolerance of sensor nodes Data

    transmission between mobile nodes via the base station Data transmission from sensor nodes to the base station via multiple paths based on fuzzy logic 72 of 77
  65. Publications • M.S. Gharajeh, S. Khanmohammadi. Static Three-Dimensional Fuzzy Routing

    Based on the Receiving Probability in Wireless Sensor Networks. Computers, 2013, Vol. 2, No. 4, pp. 152-175. • M.S. Gharajeh. Determining the State of the Sensor Nodes Based on Fuzzy Theory in WSNs. International Journal of Computers Communications & Control (Impact Factor: 0.694), 2014, Vol. 9, No. 4, pp. 419-429. • M.S. Gharajeh. SFRRP: 3D Fuzzy Routing for Wireless Sensor Networks, in: Advances in Control and Mechatronic Systems, Volume: I. United Scholars Publications, January 18, 2016, pp. 87-108. • M.S. Gharajeh, S. Khanmohammadi. Dispatching Rescue and Support Teams to Events Using Ad Hoc Networks and Fuzzy Decision Making in Rescue Applications. Journal of Control and Systems Engineering, 2015, Vol. 3, No. 1, pp. 35-50. • M.S. Gharajeh, S. Khanmohammadi. DFRTP: Dynamic 3D Fuzzy Routing Based on Traffic Probability in Wireless Sensor Networks. IET Wireless Sensor Systems, 2016, Vol. 6, No. 6, pp. 211-219. • M.S. Gharajeh. FSB-System: A Detection System for Fire, Suffocation, and Burn Based on Fuzzy Decision Making, MCDM, and RGB Model in Wireless Sensor Networks. International Journal of Sensor Networks, 2017 (under review). 73 of 77
  66. References Akingbehin, K., Patel, N., Richardson, P., Yoon, D., Chen,

    J., & Abdu, H. (2003). Proposal for a hybrid wireless harness for automotive applications. Michigan: Institute for advanced Vehicle Studies, University of Michigan- Dearborn. Akyildiz, I. F., & Kasimoglu, I. H. (2004). Wireless Sensor and Actor Networks: Research Challenges, Ad Hoc Networks Journal (Elsevier), volume. 2 (4), pp. 351-367. Akyildiz, I. F., Pompili, D., & Melodia, T. (2005). Underwater acoustic sensor networks: research challenges, Ad Hoc Networks, volume. 3 (3), 257-279 Akyildiz, I. F., Su, W., Sankarasubramaniam, Y., & Cayirci, E. (2002). Wireless sensor networks: a survey, jornul of computer network, volume 38, pp. 393-422. Albert, H., Kravets R., & Gupta, I. (2007). Building Trees Based On Aggregation Efficiency in Sensor Networks, Ad Hoc Networks, volume. 5 (8), pp. 1317-1328. ALERT, Retrieved 14 August 2009, Available from: http://www.alertsystems.org/. Bashyal, S., Venayagamoorthy, G. K., & Paudel, B. (2008). Embedded Neural Network for Fire Classification Using an Array of Gas Sensors, SAS 2008 – IEEE Sensors Applications Symposium, Atlanta, GA, pp. 12-14. Berkeley CA, Aug 2003. Available from http://chess.eecs.berkeley.edu/projects/ITR/2003/BaldwinPaper.pdf. Bertelle, C., Dutot, A., Lerebourg, S., & Olivier, D. (2003). Road traffic management based on ant system and regulation model, MAS conference. Available from http://www.liophant.org/mas2003/index.html. Cao, Q., He, T., Fang, L., Abdelzaher, T., Stankovic, J., & Son, S. (2006). Efficiency Centric Communication Model for Wireless Sensor Networks, in Proceedings of IEEE INFOCOM, pp. 1-12. 74 of 77
  67. References GTA/UFRJ Grupo de Teleinformática e Automação (2004, June). Retrieved

    July 2006, Redes de Sensores Sem Fio, Características. Available from http://www.gta.ufrj.br/ ~rezende/cursos/eel879/trabalhos/rssf1/caracteristicas.htm Hassard, G., Ghanem, M., Guo, Y., Hassard, J., Osmond, M., & Richards, M. (2004). Sensor Grids For Air Pollution Monitoring, in the Proceedings of 3rd UK e-Science All Hands Meeting. Heidemann et al., J. (2005). Underwater Sensor Networking: Research Challenges and Potential Applications, USC/ISI tech. rep. ISI-TR-2005-603. Intanagonwiwat, C., Govindan, R., & Estrin, D. (2000). Directed diffusion: a scalable and robust communication paradigm for sensor networks, Proceedings of the ACM Mobi-Com’00, Boston, MA, pp. 56–67. JiST/SWANS, Java in Simulation Time / Scalable Wireless Ad hoc Network Simulator, Available from: http://jist.ece.cornell.edu/index.html, Cornell University. Johnson, D., Maltz, D., & Broch, J. (2001). DSR: The Dynamic Source Routing Protocol for Multi-Hop Wireless Ad Hoc Networks, In Ad Hoc Networking, volume. 5, pp. 139-172, Addison-Wesley. K Khedo, K., Perseedoss, R., & Mungur, A. (2010). A Wireless Sensor Network Air Pollution Monitoring System, International Journal of Wireless & Mobile Networks (IJWMN), volume. 2 (2). Kahn, J. M., Katz, R. H., & Pister, K. S. J. (1999). Next century challenges: mobile networking for smart dust, Proceedings of the ACM MobiCom’99, Washington, USA, pp. 271–278. Karl, H., & Willig, A. (2005). Protocols and Architectures for Wireless Sensor Networks, England, Wiley; 1 edition. Kasabov, N. K. (1998). Foundations of Neural Networks, Fuzzy Systems, and Knowledge Engineering, The MIT Press, ISBN 0-262-11212-4. Keitt, T. H., Urban, D. L., & Milne, B. T. (1997). Detecting critical scales in fragmented landscapes, Conservation Ecology (online), volume. 1. 75 of 77