Upgrade to Pro
— share decks privately, control downloads, hide ads and more …
Speaker Deck
Features
Speaker Deck
PRO
Sign in
Sign up for free
Search
Search
HOW DO YOU KNOW iT'S WORKiNG
Search
Mike Fiedler
May 20, 2016
Technology
120
0
Share
Embed
Copy iframe code
Copy JS code
Copy link
Start on current slide
HOW DO YOU KNOW iT'S WORKiNG
Monitoring NGiNX.Presented during
https://ngenious.website/
Mike Fiedler
May 20, 2016
More Decks by Mike Fiedler
See All by Mike Fiedler
Fixing AWS with AWS
miketheman
1
140
Instrumenting Application Stack in Dynamically Scaling Environment
miketheman
0
72
Giving (and Taking) Back
miketheman
0
66
Where Do We Go From Here?
miketheman
0
170
What's In This Cookbook?
miketheman
0
60
Treating Your Infrastructure Like Garbage
miketheman
2
1.7k
MongoDB - Operations Best Practices
miketheman
1
130
MongoDB in the Cloud - Amazon Web Services
miketheman
3
120
Other Decks in Technology
See All in Technology
2026年のソフトウェア開発を考える(2026/07版) / Agentic Software Engineering 2026-07 Findy Edition
twada
PRO
31
20k
AIがAPIを書く時代に、私たちは何を設計すべきか
nagix
0
140
Claude Mythos、Fable...フロンティアAIの最新動向と企業のセキュリティ対策
flatt_security
0
170
Amazon Bedrock Managed Knowledge Base Dive Deep
ren8k
0
210
Power Automateアップデート情報
miyakemito
0
280
論語・武士道・産業革命から見る かわるもの、かわらないもの
ichimichi
8
1.5k
新たなDBアーキテクチャ「LTAP」にDeep Dive!!
inoutk
0
150
BigQuery を検索ソースとした AI Agent の作り方って 〇〇 通りあんねん
satohjohn
0
140
全社でのソフトウェアサプライチェーン攻撃対策をやってみた with Takumi Guard
z63d
0
320
ここは地獄!つらい朝会を体験することで、チームとしてのより良い振る舞いに気づくワークショップ / The stand-up meeting from hell in the game industry
scrummasudar
0
430
13年運用タイトルのサーバーサイドが辿り着いた現在地 ― モンスターストライクにおける技術・組織・AI活用から得た知見
mixi_engineers
PRO
1
290
変更し続けられるシステムをどう保つか — AI時代のSSoTという設計原則
kawauso
1
1.5k
Featured
See All Featured
Git: the NoSQL Database
bkeepers
PRO
432
67k
A Tale of Four Properties
chriscoyier
163
24k
Tell your own story through comics
letsgokoyo
1
1k
Efficient Content Optimization with Google Search Console & Apps Script
katarinadahlin
PRO
1
750
A brief & incomplete history of UX Design for the World Wide Web: 1989–2019
jct
2
430
Design in an AI World
tapps
1
270
Color Theory Basics | Prateek | Gurzu
gurzu
0
400
How to make the Groovebox
asonas
2
2.3k
Designing Powerful Visuals for Engaging Learning
tmiket
1
460
For a Future-Friendly Web
brad_frost
183
10k
Balancing Empowerment & Direction
lara
6
1.2k
A better future with KSS
kneath
240
18k
Transcript
HOW DO YOU KNOW iT’S WORKiNG MONiTORiNG
MiKE FiEDLER Wrangler of the Unusual Twitter: @mikefiedler Github: @miketheman
OpsSchool.org Chef Community Roller Derby Referee © Alex Erde
WHO CARES?
DOES iT EVEN?
DOES iT EVEN? YES iT DOES!
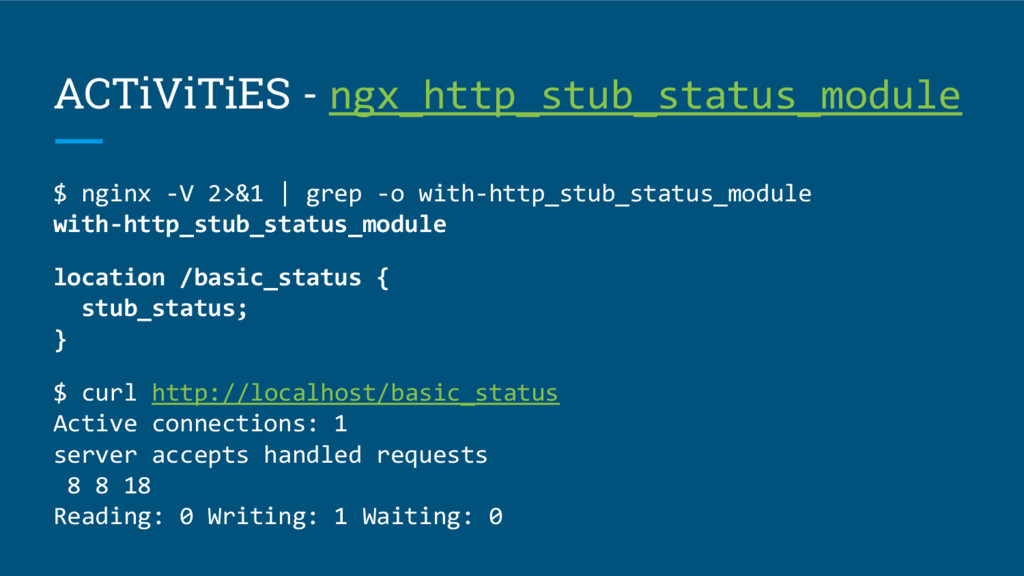
ACTiViTiES - ngx_http_stub_status_module $ nginx -V 2>&1 | grep -o
with-http_stub_status_module with-http_stub_status_module location /basic_status { stub_status; } $ curl http://localhost/basic_status Active connections: 1 server accepts handled requests 8 8 18 Reading: 0 Writing: 1 Waiting: 0
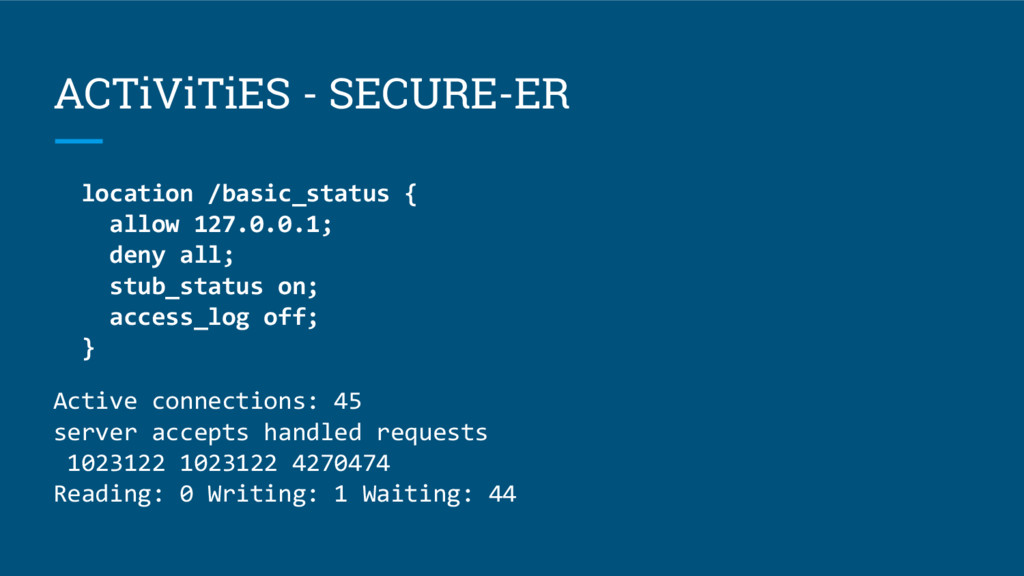
location /basic_status { allow 127.0.0.1; deny all; stub_status on; access_log
off; } Active connections: 45 server accepts handled requests 1023122 1023122 4270474 Reading: 0 Writing: 1 Waiting: 44 ACTiViTiES - SECURE-ER
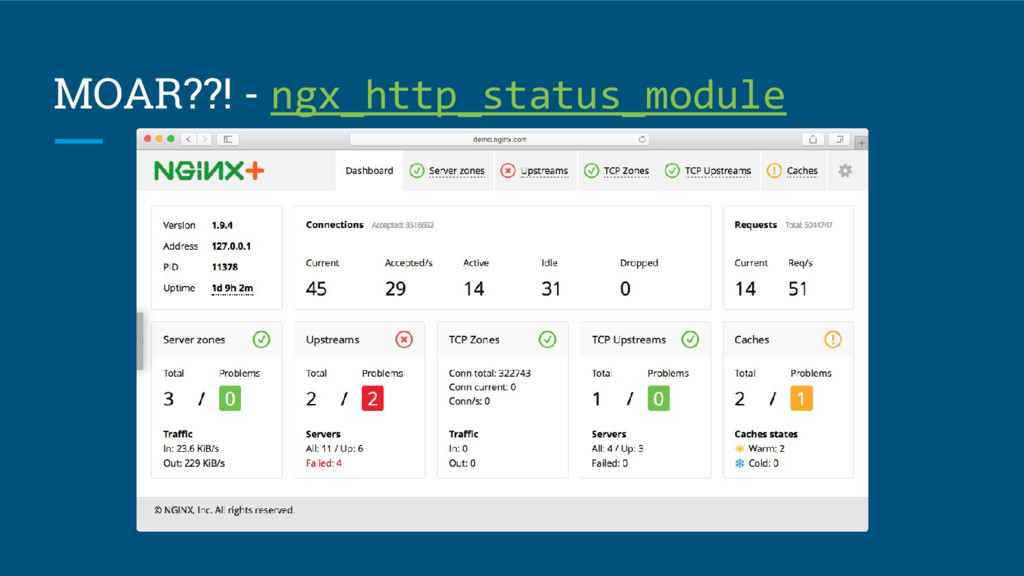
MOAR??! - ngx_http_status_module
None
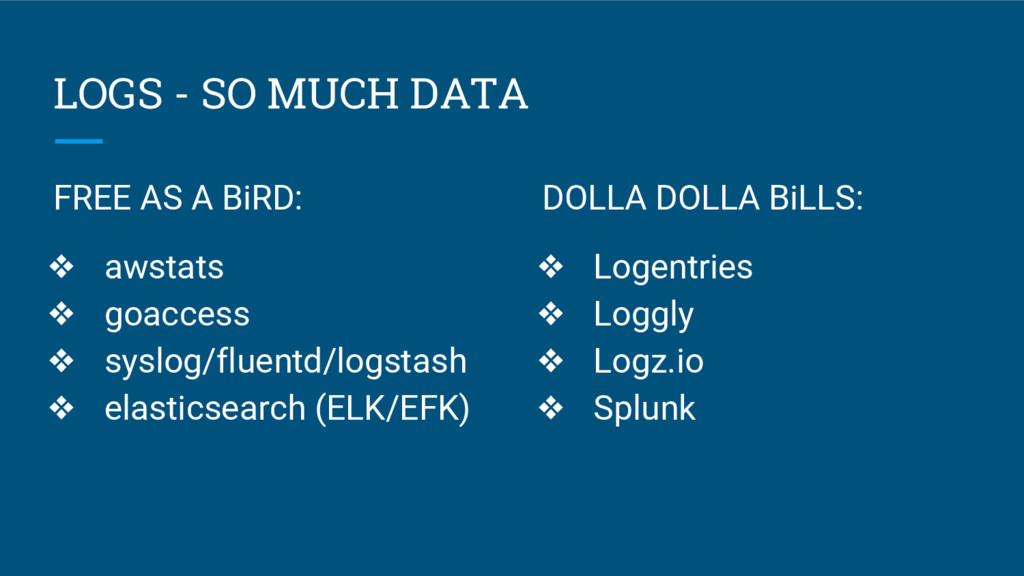
FREE AS A BiRD: ❖ awstats ❖ goaccess ❖ syslog/fluentd/logstash
❖ elasticsearch (ELK/EFK) LOGS - SO MUCH DATA DOLLA DOLLA BiLLS: ❖ Logentries ❖ Loggly ❖ Logz.io ❖ Splunk
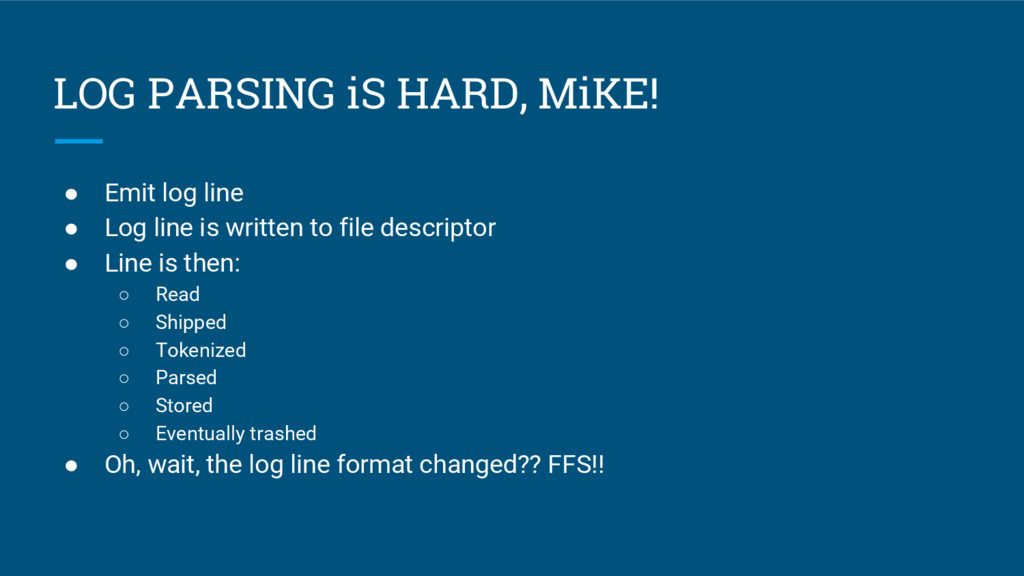
• Emit log line • Log line is written to
file descriptor • Line is then: ◦ Read ◦ Shipped ◦ Tokenized ◦ Parsed ◦ Stored ◦ Eventually trashed • Oh, wait, the log line format changed?? FFS!! LOG PARSING iS HARD, MiKE!
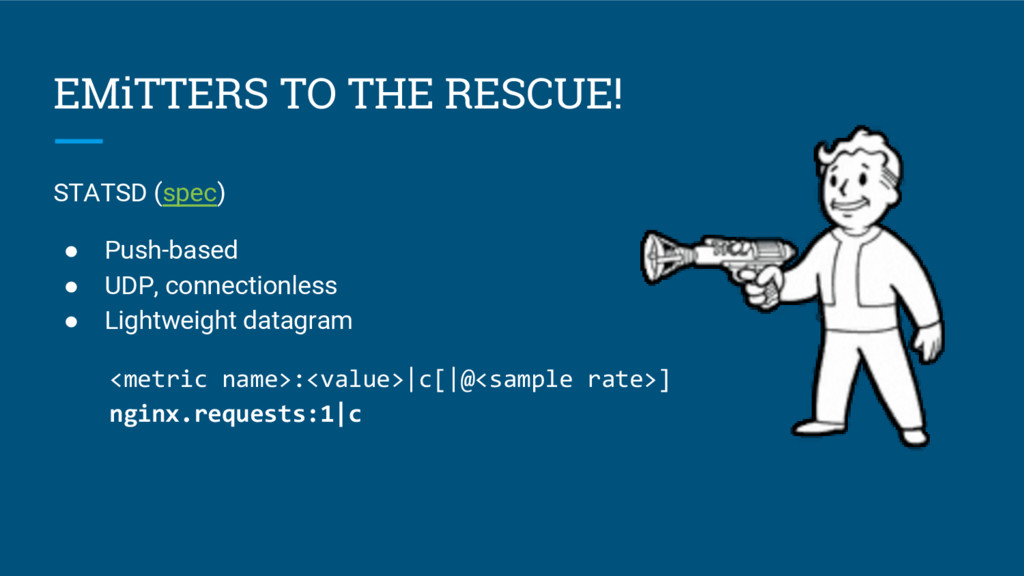
STATSD (spec) • Push-based • UDP, connectionless • Lightweight datagram
<metric name>:<value>|c[|@<sample rate>] nginx.requests:1|c EMiTTERS TO THE RESCUE!
GET ME AN EMiTTER! Lua-based: • https://github.com/musicglue/ngx_lua_statsd • https://github.com/simplifi/ngx_lua_datadog •
https://github.com/lonelyplanet/openresty-statsd • https://github.com/knyar/nginx-lua-prometheus Native C: https://github.com/zebrafishlabs/nginx-statsd
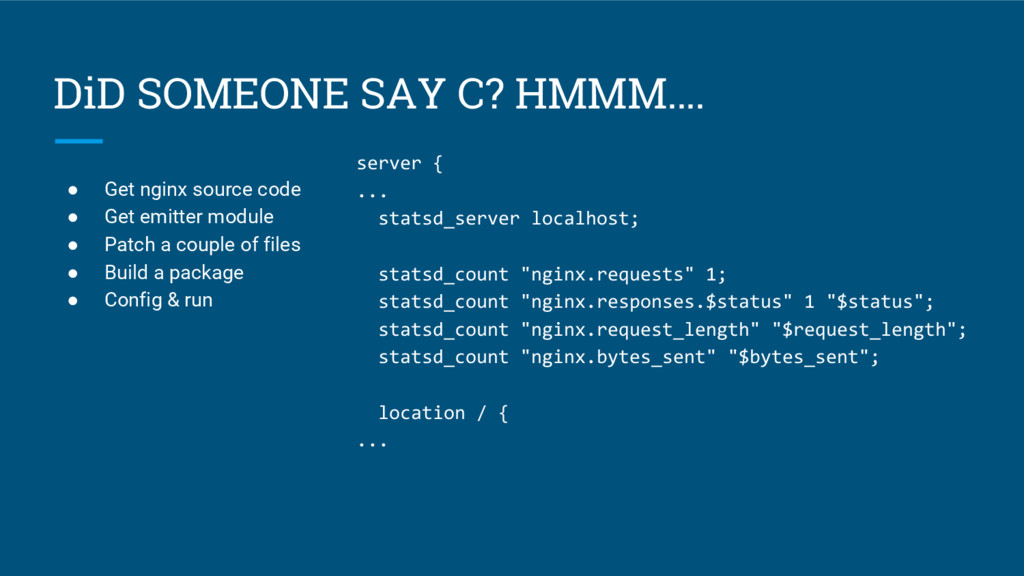
DiD SOMEONE SAY C? HMMM…. • Get nginx source code
• Get emitter module • Patch a couple of files • Build a package • Config & run server { ... statsd_server localhost; statsd_count "nginx.requests" 1; statsd_count "nginx.responses.$status" 1 "$status"; statsd_count "nginx.request_length" "$request_length"; statsd_count "nginx.bytes_sent" "$bytes_sent"; location / { ...
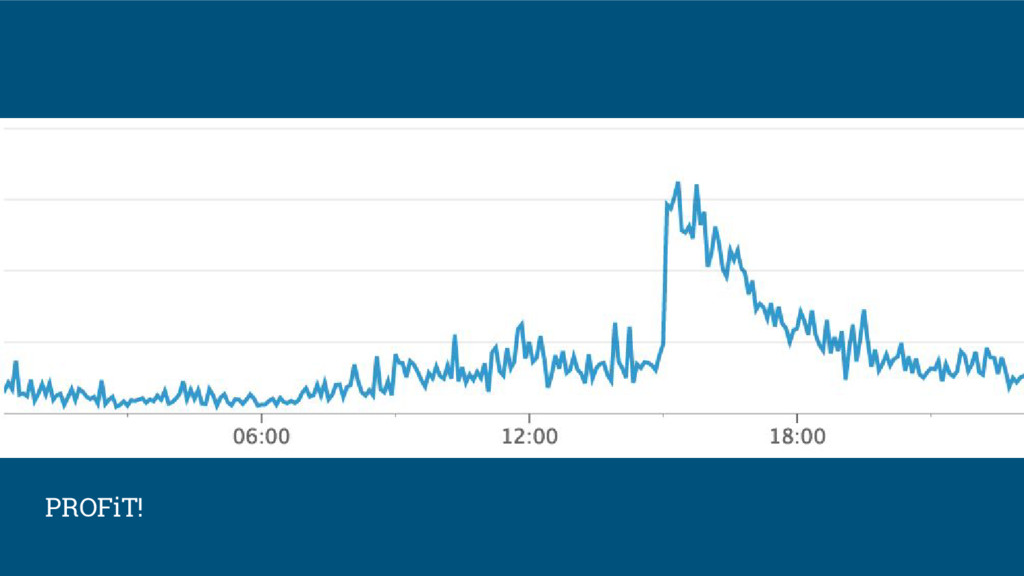
PROFiT!
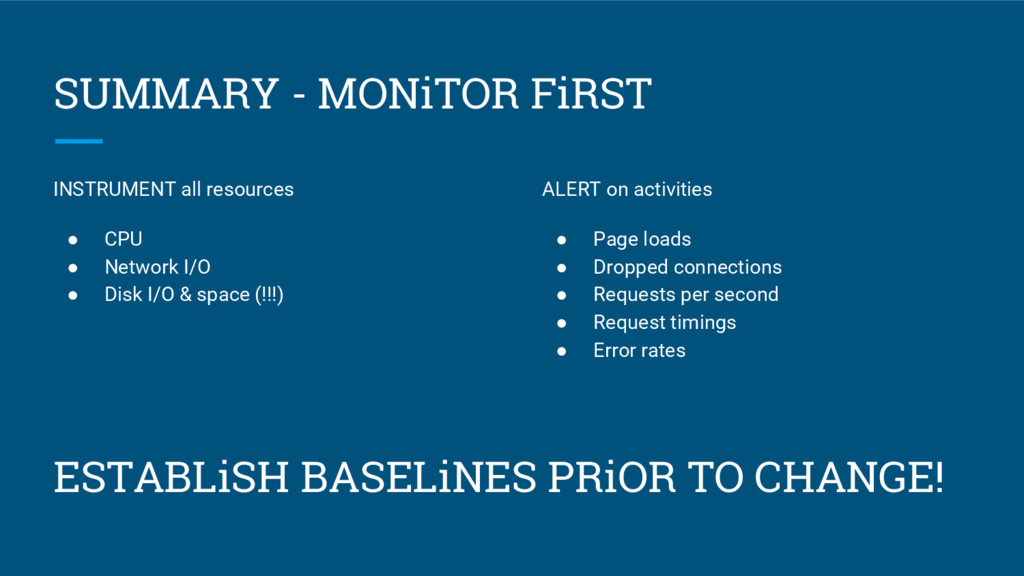
INSTRUMENT all resources • CPU • Network I/O • Disk
I/O & space (!!!) SUMMARY - MONiTOR FiRST ALERT on activities • Page loads • Dropped connections • Requests per second • Request timings • Error rates ESTABLiSH BASELiNES PRiOR TO CHANGE!
THANKS! https://github.com/miketheman/ngenious-statsd QUESTiONS?