Upgrade to Pro — share decks privately, control downloads, hide ads and more …

MongoDB - Operations Best Practices

MongoDB - Operations Best Practices

Presented at MongoDC 2012
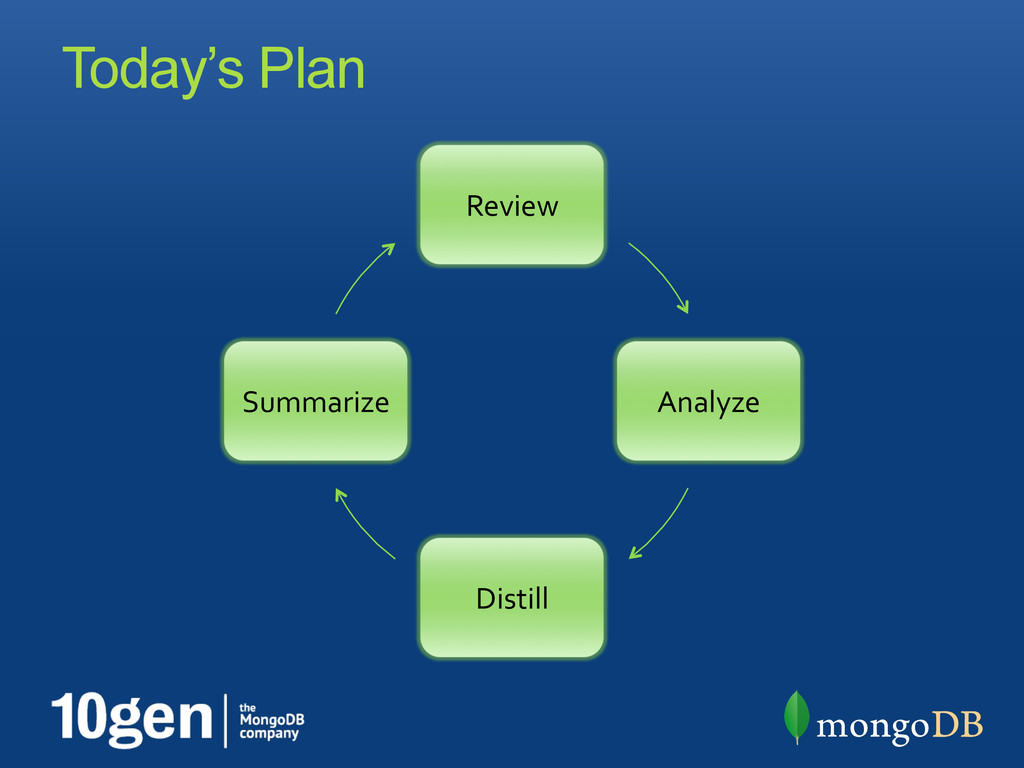
A short interactive session, working through 3 problem scenarios, and the possible diagnosis methods, and root cause analysis.

Avatar for Mike Fiedler

Mike Fiedler

June 27, 2012
Tweet

More Decks by Mike Fiedler

Other Decks in Technology

Transcript

  1. Scenario 1 •  Fire, it is on fire! •  Users

    notice response time takes 1-3 sec •  App logs show timeouts •  Server log show socket exceptions
  2. Scenario 1 - Diagnostics •  Logs •  Understanding the timeouts

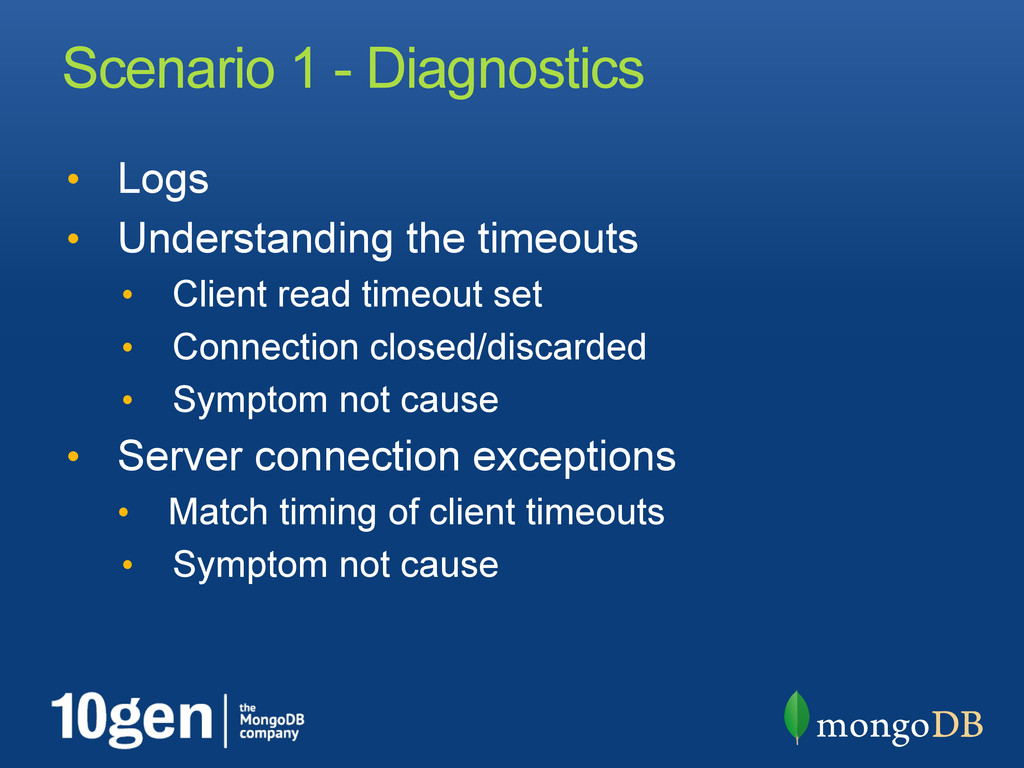
    •  Client read timeout set •  Connection closed/discarded •  Symptom not cause •  Server connection exceptions •  Match timing of client timeouts •  Symptom not cause
  3. Scenario 1 - Takeaways •  Monitor Logs •  Alert, escalate

    •  Correlate •  Disk •  Monitor •  Moved to RAID (10) •  Instrument/Monitor App •  Know your application and application (write) characteristics
  4. Scenario 2 •  Alerts warn that server is running hot

    •  Random (small) slowdowns •  Increased traffic/queries
  5. Scenario 2 - Diagnostics •  Turn on DB Profiling • 

    Look at logs •  Identify query patterns •  taking longest •  highest frequency •  Run: <query>.explain()  
  6. Scenario 2 - Explain db.s2.find({...}).sort({...}).explain()    {  "cursor"  :  "BtreeCursor

     ABC",   "nscanned"  :  160677,   "nscannedObjects"  :  12015,   "n"  :  55,   "millis"  :  99,   "scanAndOrder"  :  true,   "indexBounds"  :  {...}  }  
  7. Scenario 2 - Diagnostics •  Create a compound index • 

    Used for criteria and sort •  Reduced CPU dramatically
  8. Scenario 2 - Takeaways •  Performance test/analyze system behavior • 

    Load test before deployment •  Alert on abnormal states •  +CPU may be a sign of poorly indexed data •  Perform a rolling upgrade for indexes
  9. Scenario 3 - Diagnostics Device: rrqm/s wrqm/s r/s w/s rsec/s

    wsec/s sdp 0.00 0.00 0.50 0.00 27.86 0.00 avgrq-sz avgqu-sz await svctm %util 56.00 149.58 20320.00 2010.00 100.00 •  iostat
  10. Scenario 3 - More Diagnostics $ blockdev --report RO RA

    SSZ BSZ StartSec Size Device rw 8096 512 4048 0 1099494850560 /dev/sdp •  Huge read-ahead of 4MB
  11. Scenario 3 - Takeaways •  Pay attention to disk configurations

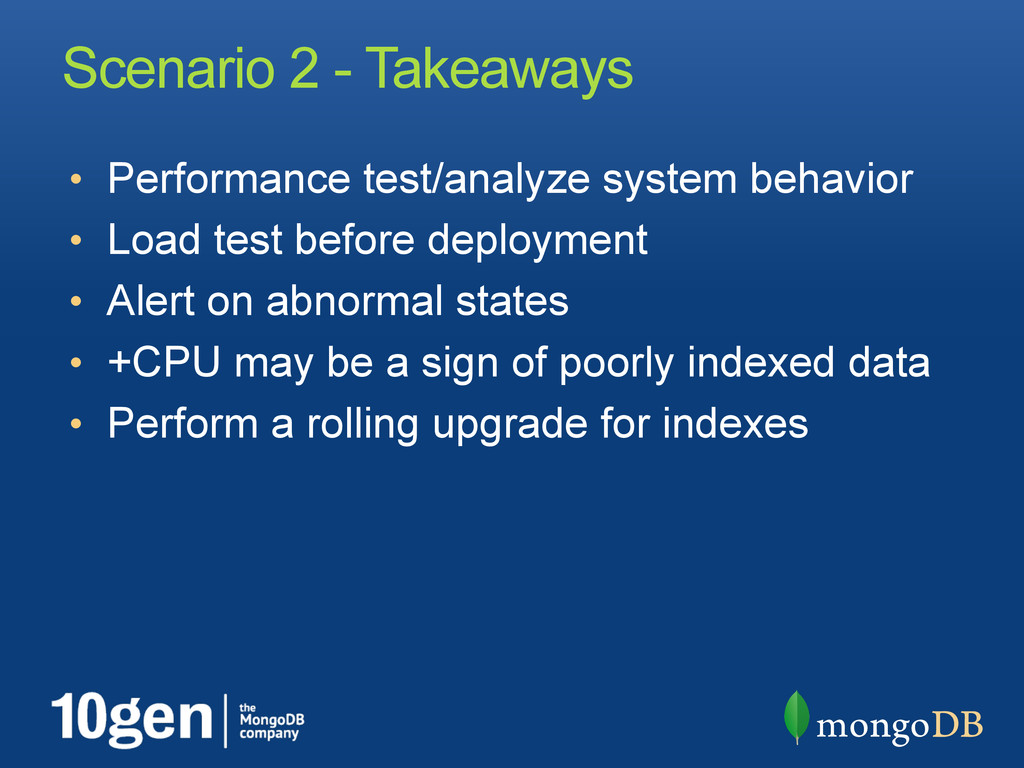
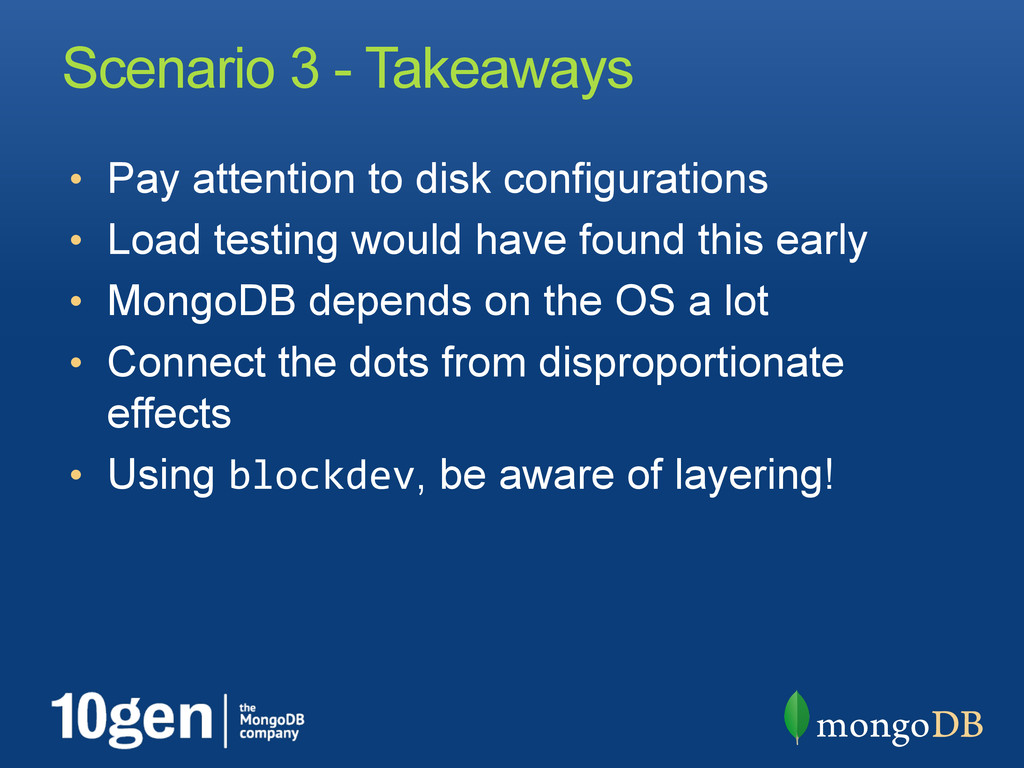
    •  Load testing would have found this early •  MongoDB depends on the OS a lot •  Connect the dots from disproportionate effects •  Using blockdev, be aware of layering!
  12. Best Practices Covered - 1 •  System provisioning •  Configuration

    •  Performance •  Capacity •  Logs •  Review •  Alert •  Rotate and collect (per cluster)
  13. Best Practices Covered - 2 •  Query/Index Analysis •  Instrument

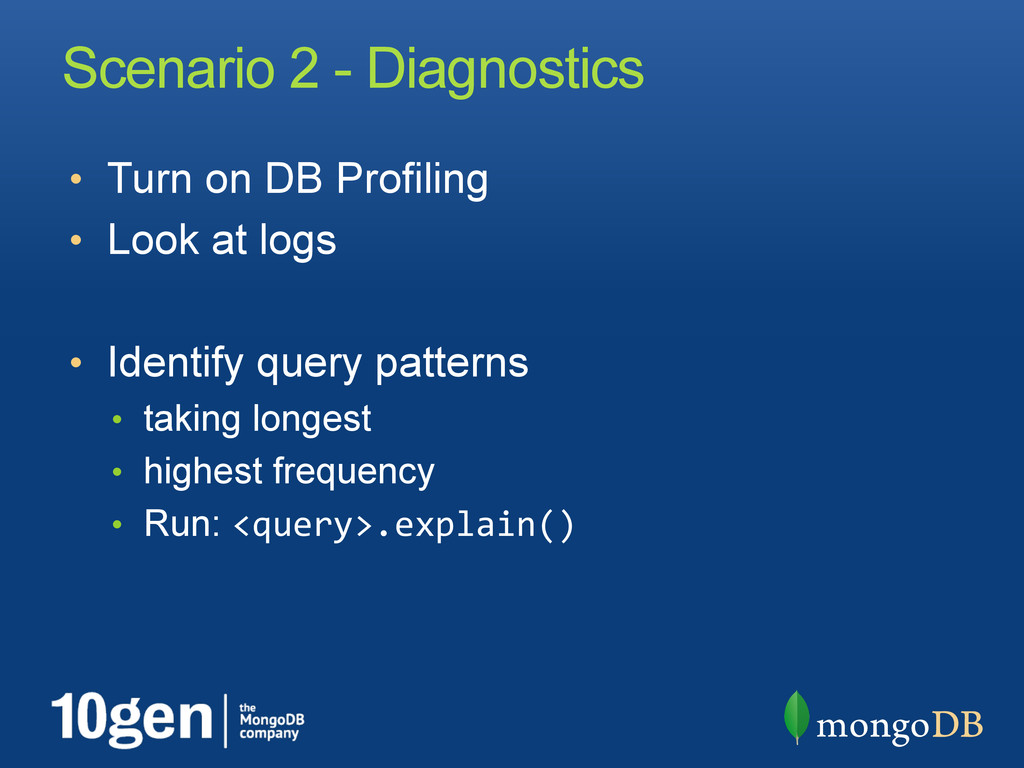
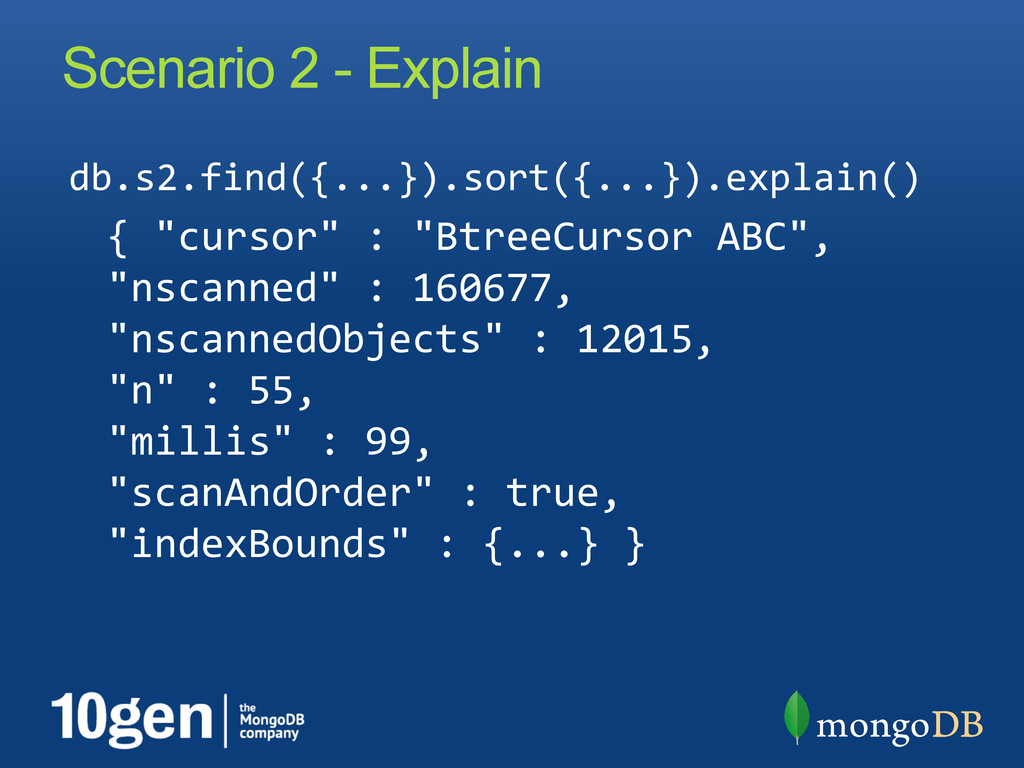
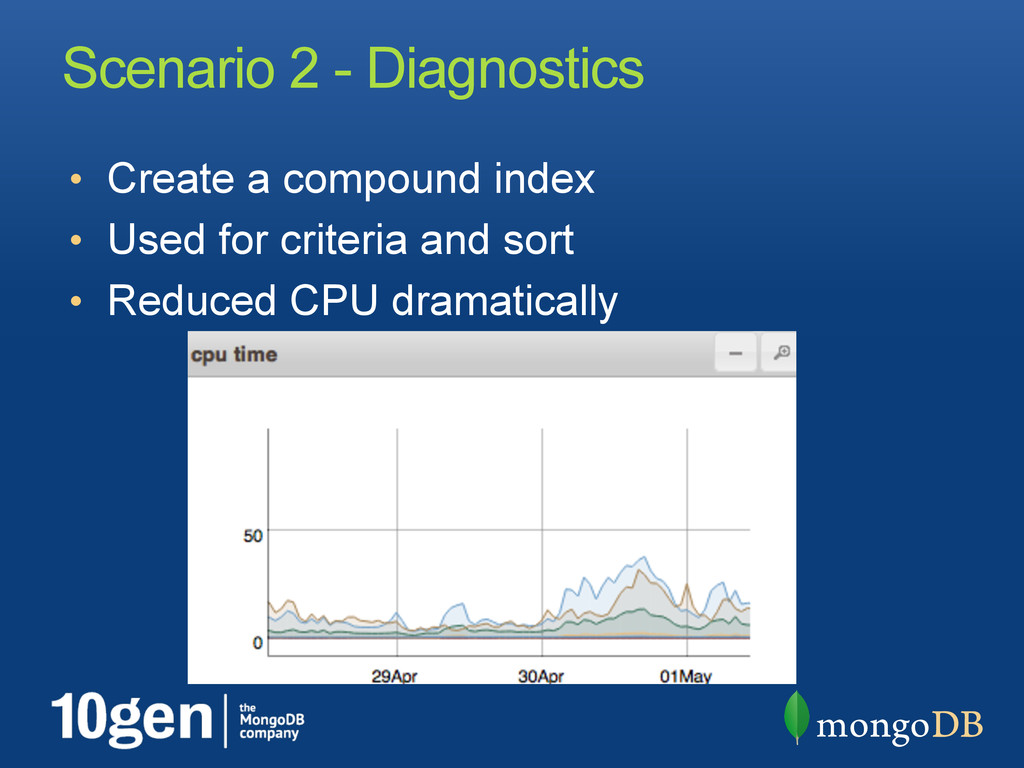
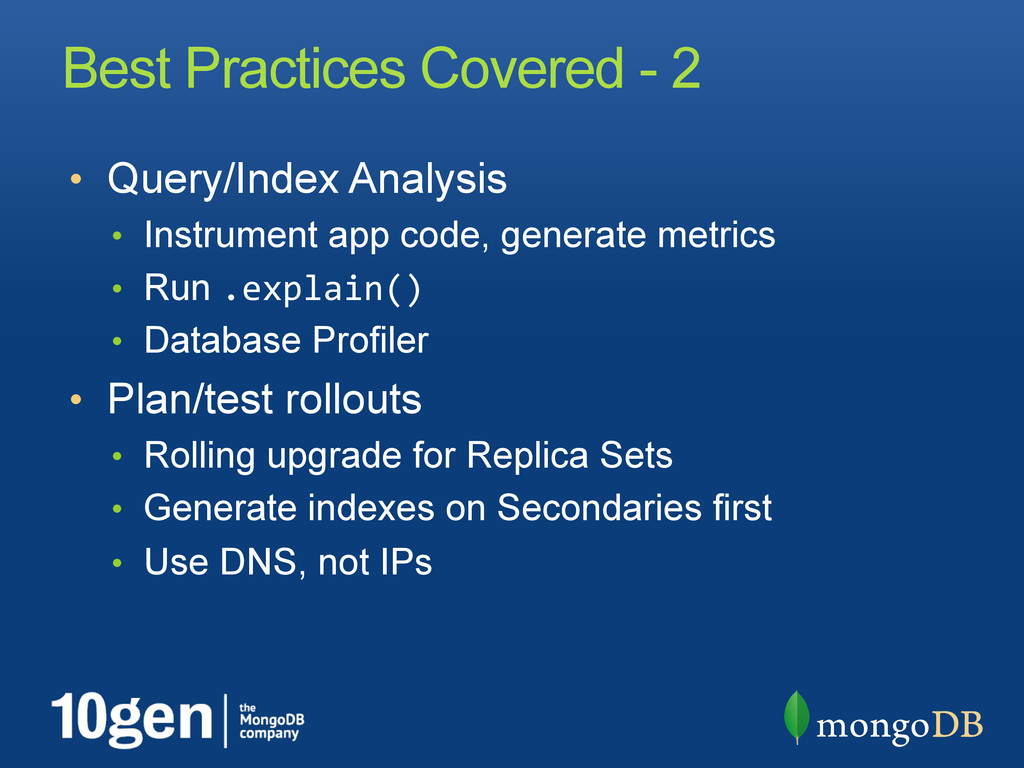
    app code, generate metrics •  Run .explain() •  Database Profiler •  Plan/test rollouts •  Rolling upgrade for Replica Sets •  Generate indexes on Secondaries first •  Use DNS, not IPs