for manipulating documents based on data . D 3 helps you bring data to life using HTML , SVG and CSS . D 3 ’ s emphasis on web standards gives you the full capabilities of modern browsers without tying yourself to a proprietary framework , combining powerful visualization components and a data - driven approach to DOM manipulation .
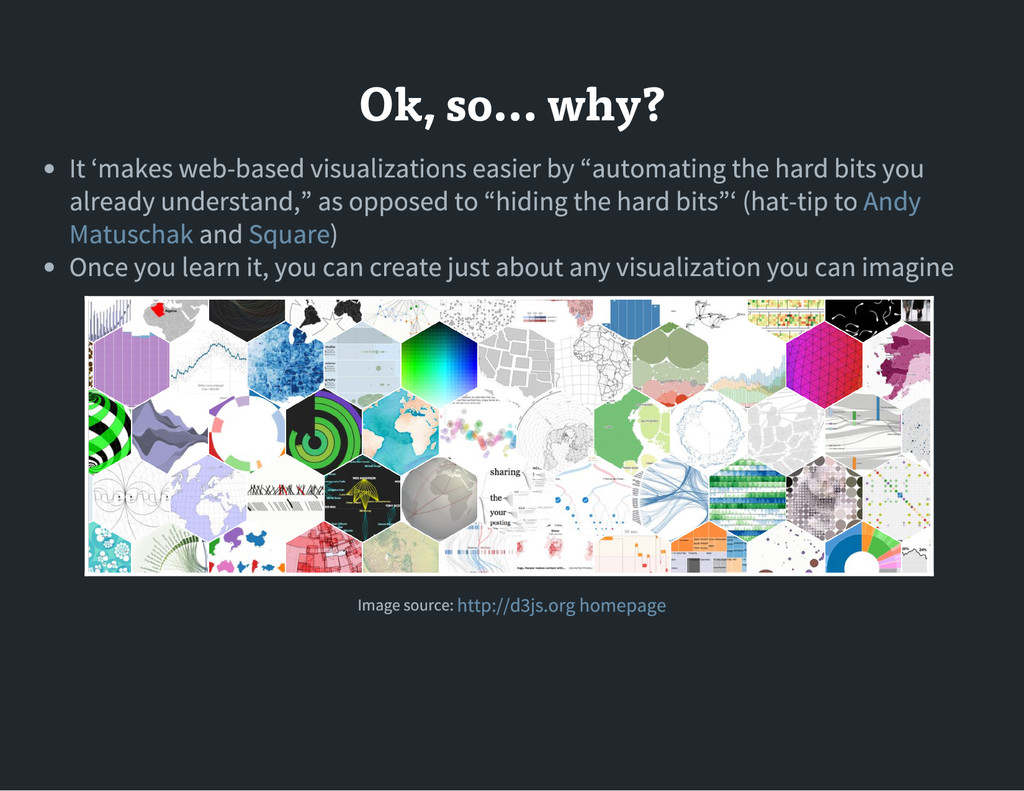
easier by “ automating the hard bits you already understand ,” as opposed to “ hiding the hard bits ”‘ ( hat - tip to and ) Once you learn it , you can create just about any visualization you can imagine Andy Matuschak Square Image source : http :// d 3js .org homepage
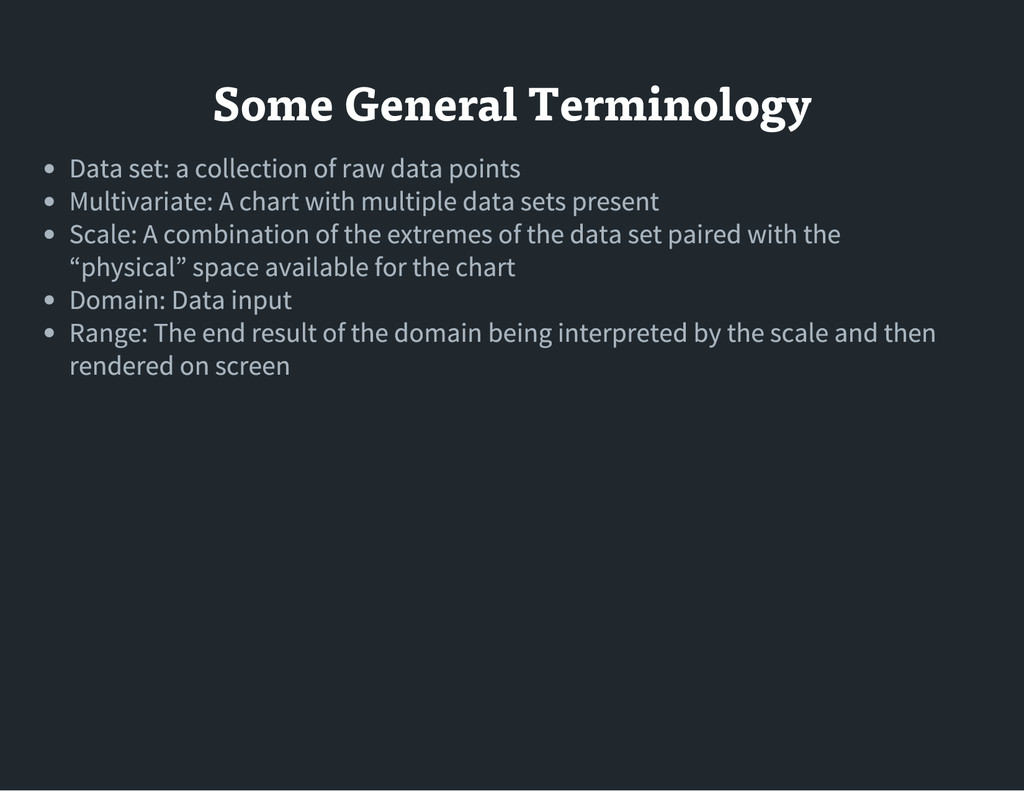
data points Multivariate : A chart with multiple data sets present Scale : A combination of the extremes of the data set paired with the “ physical ” space available for the chart Domain : Data input Range : The end result of the domain being interpreted by the scale and then rendered on screen
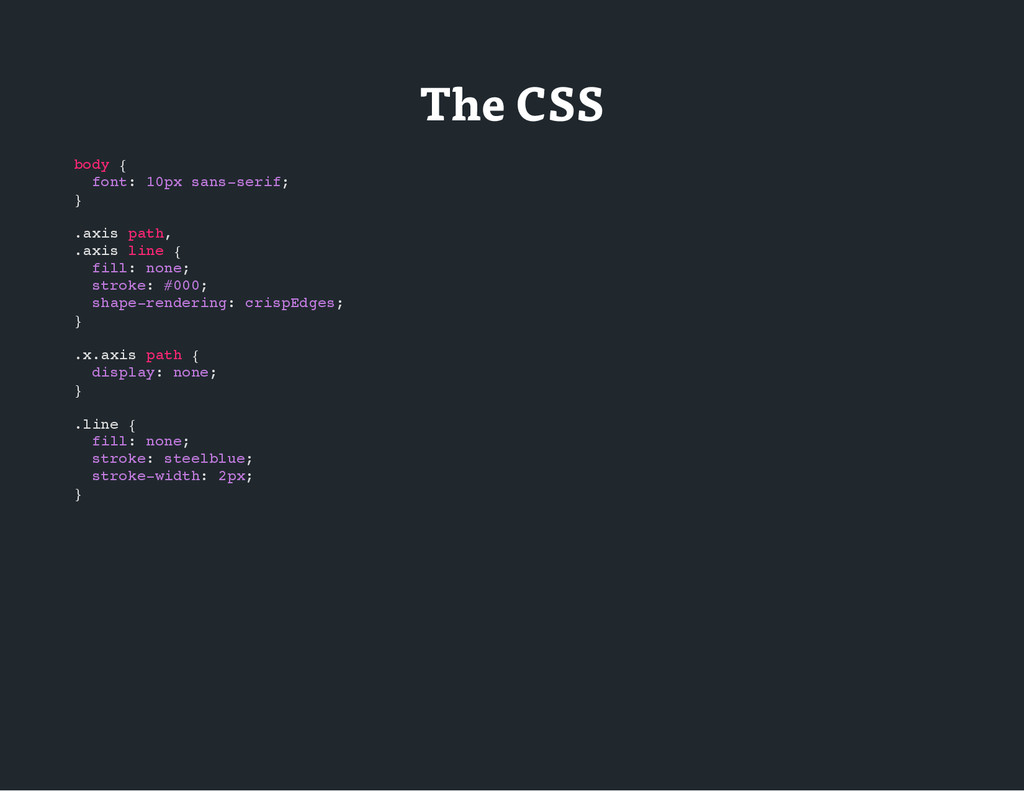
t : 1 0 p x s a n s - s e r i f ; } . a x i s p a t h , . a x i s l i n e { f i l l : n o n e ; s t r o k e : # 0 0 0 ; s h a p e - r e n d e r i n g : c r i s p E d g e s ; } . x . a x i s p a t h { d i s p l a y : n o n e ; } . l i n e { f i l l : n o n e ; s t r o k e : s t e e l b l u e ; s t r o k e - w i d t h : 2 p x ; }
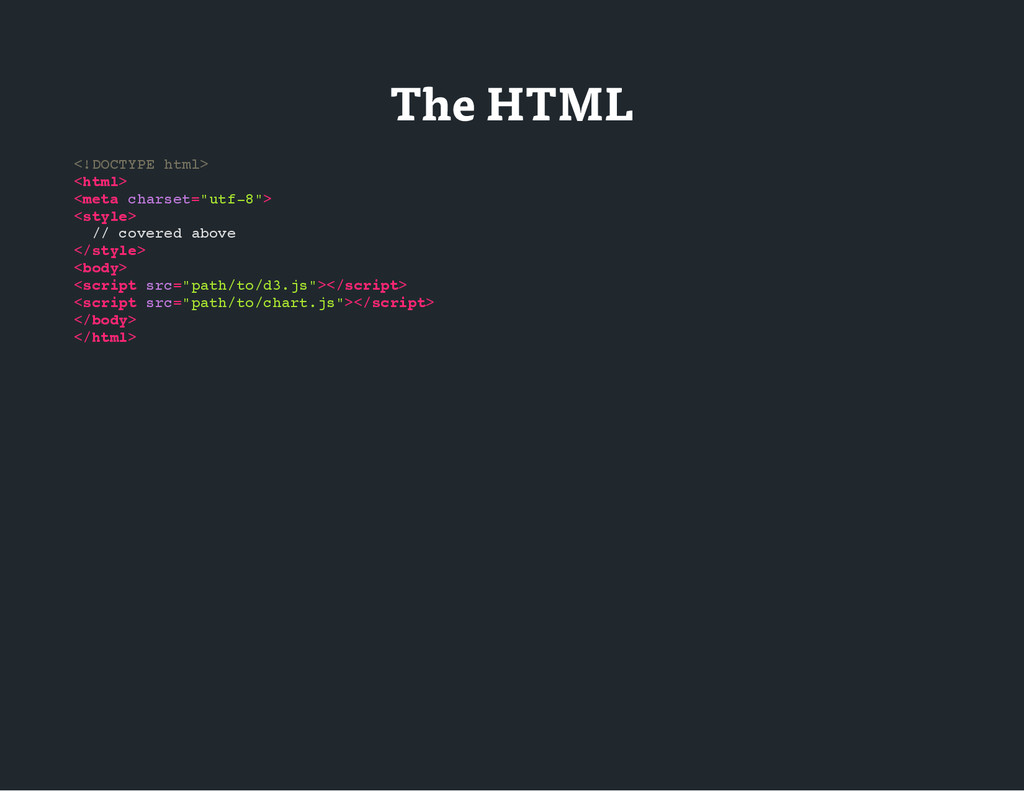
E h t m l > < h t m l > < m e t a c h a r s e t = " u t f - 8 " > < s t y l e > / / c o v e r e d a b o v e < / s t y l e > < b o d y > < s c r i p t s r c = " p a t h / t o / d 3 . j s " > < / s c r i p t > < s c r i p t s r c = " p a t h / t o / c h a r t . j s " > < / s c r i p t > < / b o d y > < / h t m l >
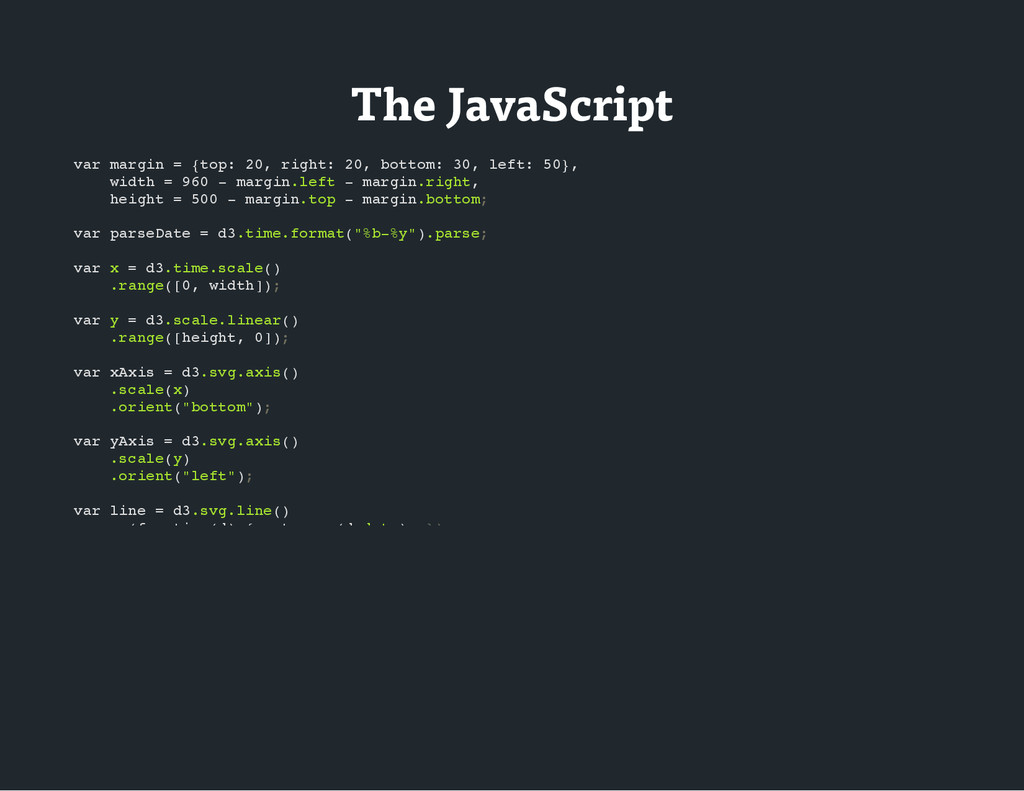
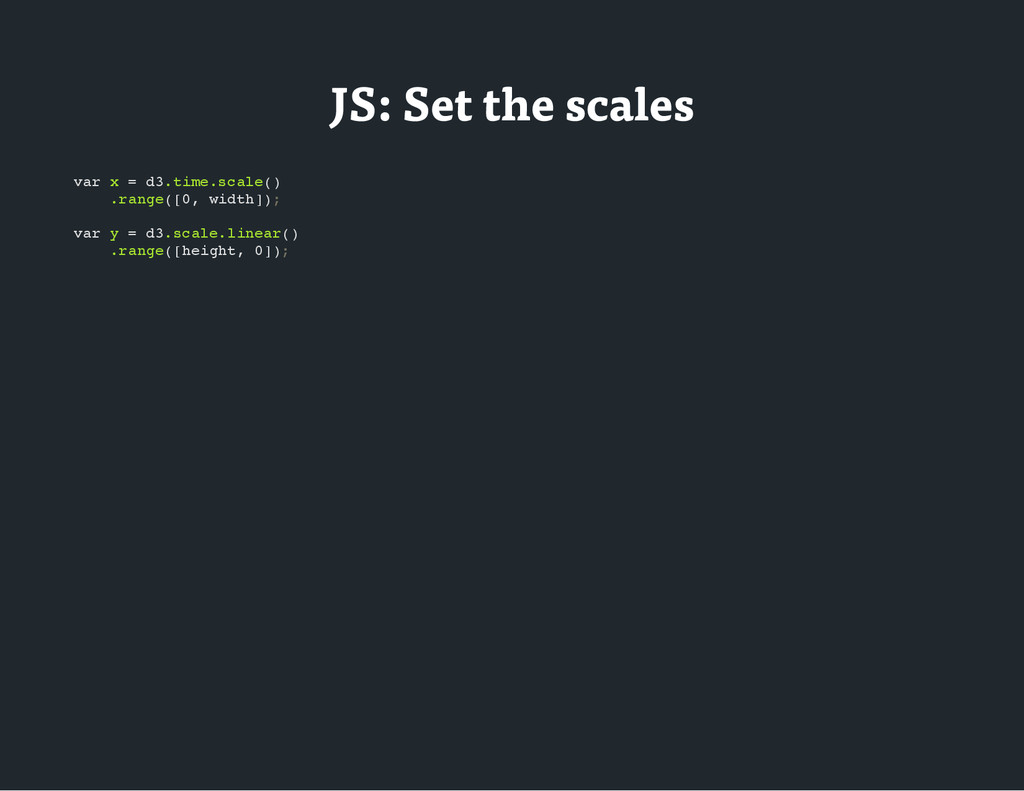
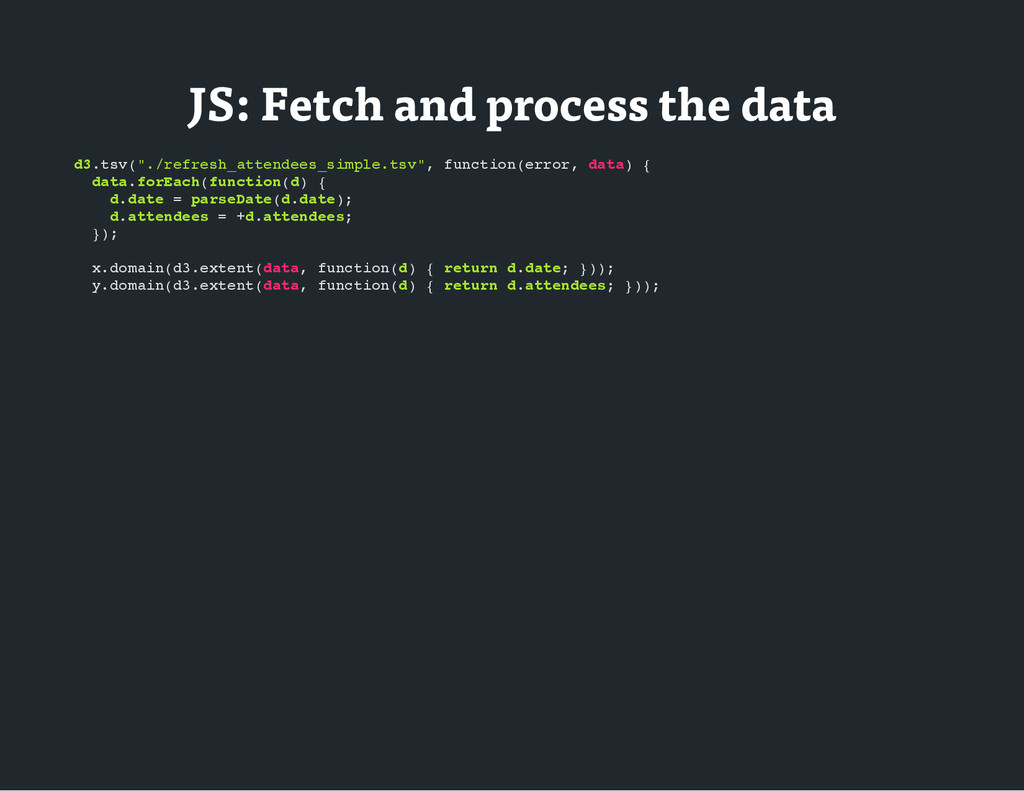
n = { t o p : 2 0 , r i g h t : 2 0 , b o t t o m : 3 0 , l e f t : 5 0 } , w i d t h = 9 6 0 - m a r g i n . l e f t - m a r g i n . r i g h t , h e i g h t = 5 0 0 - m a r g i n . t o p - m a r g i n . b o t t o m ; v a r p a r s e D a t e = d 3 . t i m e . f o r m a t ( " % b - % y " ) . p a r s e ; v a r x = d 3 . t i m e . s c a l e ( ) . r a n g e ( [ 0 , w i d t h ] ) ; v a r y = d 3 . s c a l e . l i n e a r ( ) . r a n g e ( [ h e i g h t , 0 ] ) ; v a r x A x i s = d 3 . s v g . a x i s ( ) . s c a l e ( x ) . o r i e n t ( " b o t t o m " ) ; v a r y A x i s = d 3 . s v g . a x i s ( ) . s c a l e ( y ) . o r i e n t ( " l e f t " ) ; v a r l i n e = d 3 . s v g . l i n e ( ) . x ( f u n c t i o n ( d ) { r e t u r n x ( d . d a t e ) ; } ) . y ( f u n c t i o n ( d ) { r e t u r n y ( d . a t t e n d e e s ) ; } ) ; v a r s v g = d 3 . s e l e c t ( " b o d y " ) . a p p e n d ( " s v g " ) . a t t r ( " w i d t h " , w i d t h + m a r g i n . l e f t + m a r g i n . r i g h t ) . a t t r ( " h e i g h t " , h e i g h t + m a r g i n . t o p + m a r g i n . b o t t o m ) . a p p e n d ( " g " ) . a t t r ( " t r a n s f o r m " , " t r a n s l a t e ( " + m a r g i n . l e f t + " , " + m a r g i n . t o p + " ) " ) ; d 3 . t s v ( " . / r e f r e s h _ a t t e n d e e s _ s i m p l e . t s v " , f u n c t i o n ( e r r o r , d a t a ) { d a t a . f o r E a c h ( f u n c t i o n ( d ) { d . d a t e = p a r s e D a t e ( d . d a t e ) ; d . a t t e n d e e s = + d . a t t e n d e e s ; } ) ;
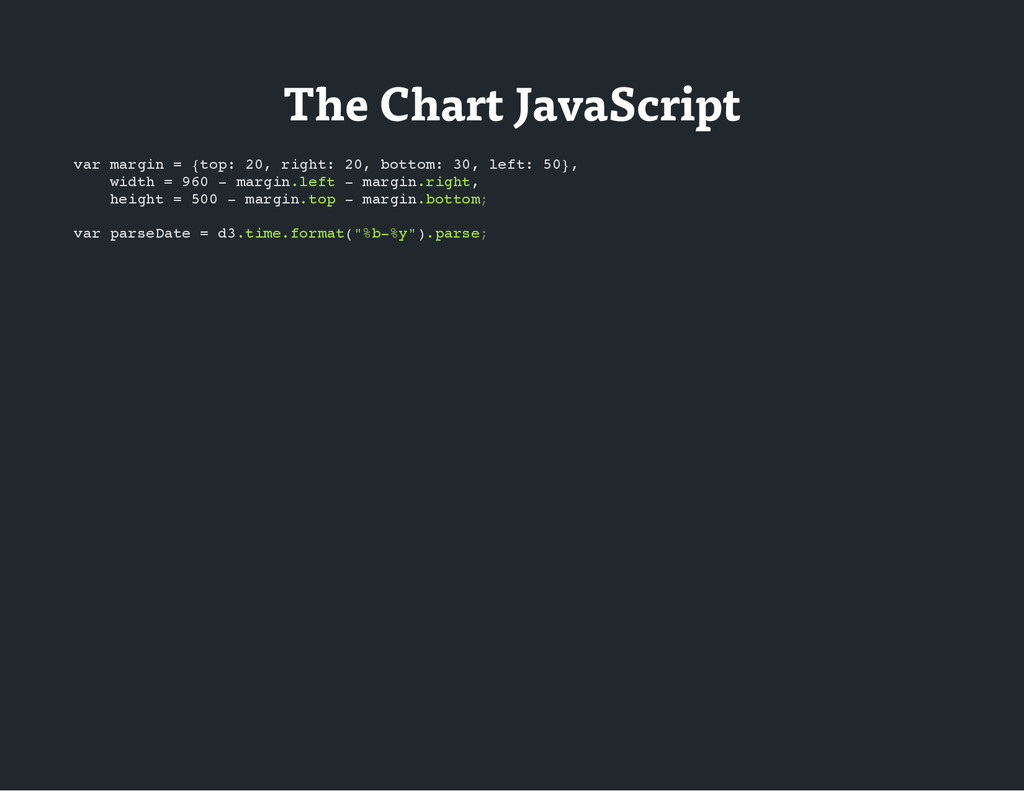
i n = { t o p : 2 0 , r i g h t : 2 0 , b o t t o m : 3 0 , l e f t : 5 0 } , w i d t h = 9 6 0 - m a r g i n . l e f t - m a r g i n . r i g h t , h e i g h t = 5 0 0 - m a r g i n . t o p - m a r g i n . b o t t o m ; v a r p a r s e D a t e = d 3 . t i m e . f o r m a t ( " % b - % y " ) . p a r s e ;
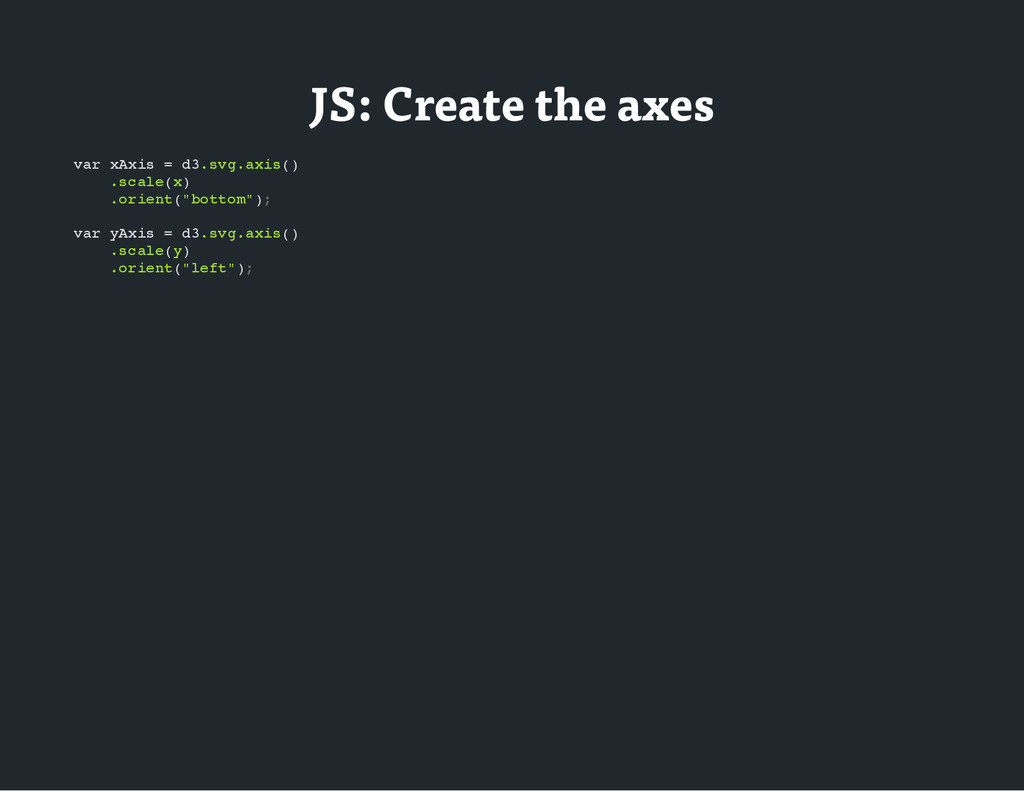
i s = d 3 . s v g . a x i s ( ) . s c a l e ( x ) . o r i e n t ( " b o t t o m " ) ; v a r y A x i s = d 3 . s v g . a x i s ( ) . s c a l e ( y ) . o r i e n t ( " l e f t " ) ;
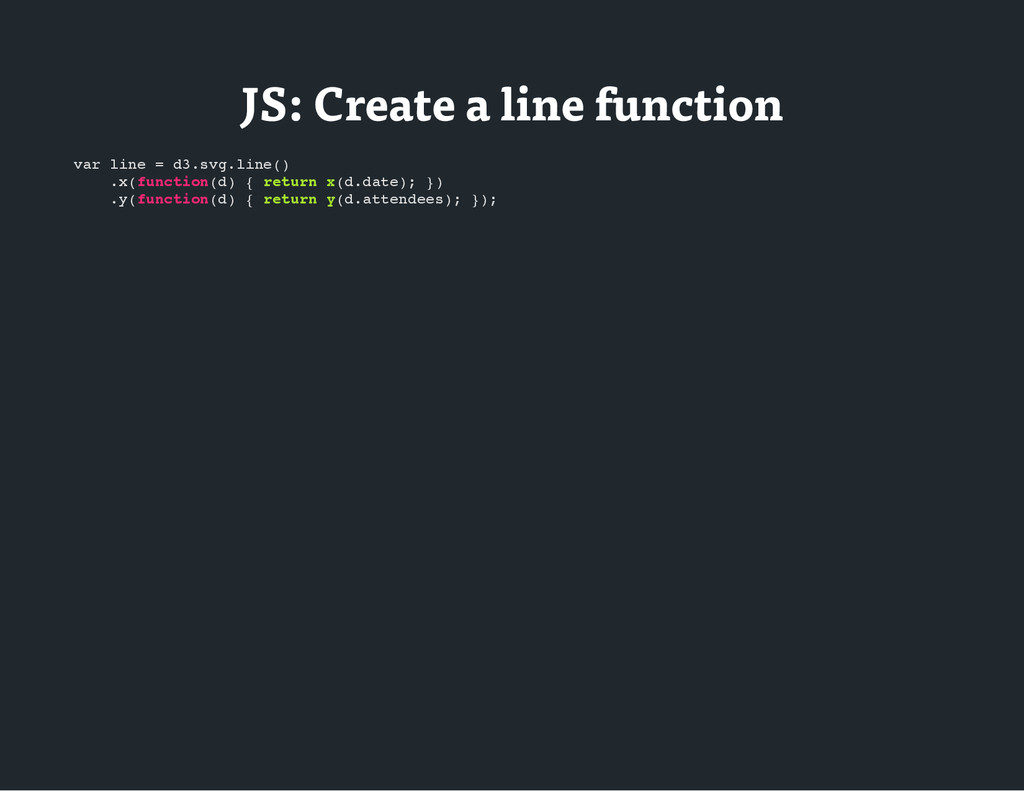
n e = d 3 . s v g . l i n e ( ) . x ( f u n c t i o n ( d ) { r e t u r n x ( d . d a t e ) ; } ) . y ( f u n c t i o n ( d ) { r e t u r n y ( d . a t t e n d e e s ) ; } ) ;
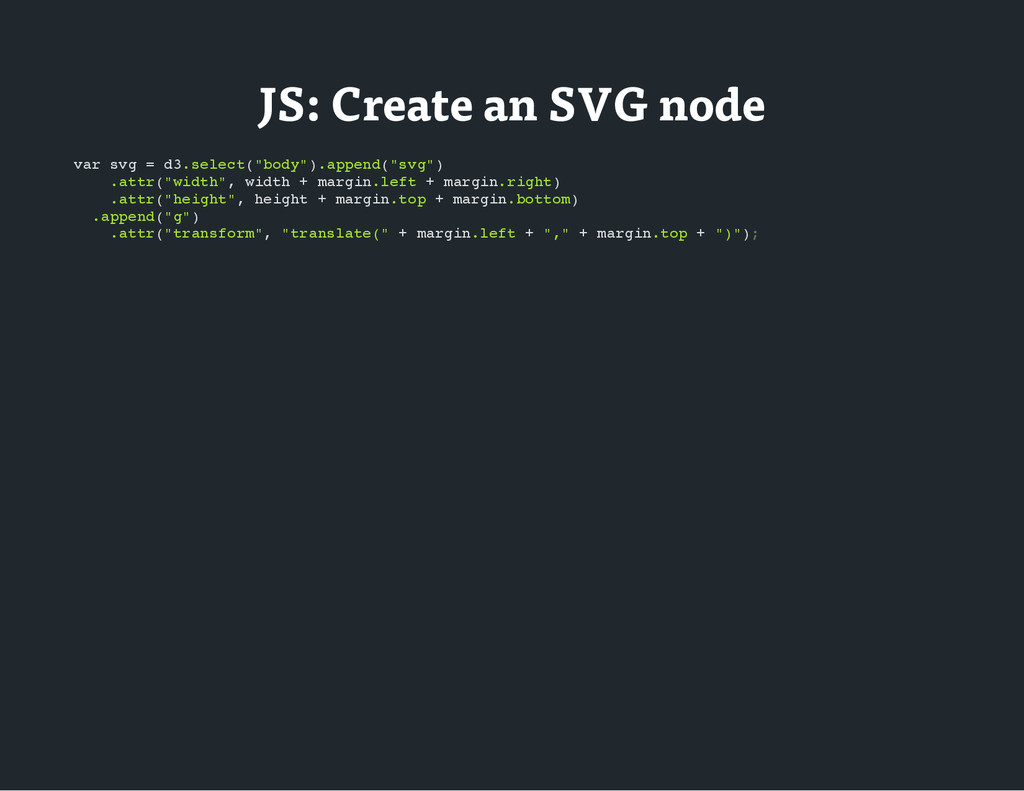
g = d 3 . s e l e c t ( " b o d y " ) . a p p e n d ( " s v g " ) . a t t r ( " w i d t h " , w i d t h + m a r g i n . l e f t + m a r g i n . r i g h t ) . a t t r ( " h e i g h t " , h e i g h t + m a r g i n . t o p + m a r g i n . b o t t o m ) . a p p e n d ( " g " ) . a t t r ( " t r a n s f o r m " , " t r a n s l a t e ( " + m a r g i n . l e f t + " , " + m a r g i n . t o p + " ) " ) ;
s v ( " . / r e f r e s h _ a t t e n d e e s _ s i m p l e . t s v " , f u n c t i o n ( e r r o r , d a t a ) { d a t a . f o r E a c h ( f u n c t i o n ( d ) { d . d a t e = p a r s e D a t e ( d . d a t e ) ; d . a t t e n d e e s = + d . a t t e n d e e s ; } ) ; x . d o m a i n ( d 3 . e x t e n t ( d a t a , f u n c t i o n ( d ) { r e t u r n d . d a t e ; } ) ) ; y . d o m a i n ( d 3 . e x t e n t ( d a t a , f u n c t i o n ( d ) { r e t u r n d . a t t e n d e e s ; } ) ) ;
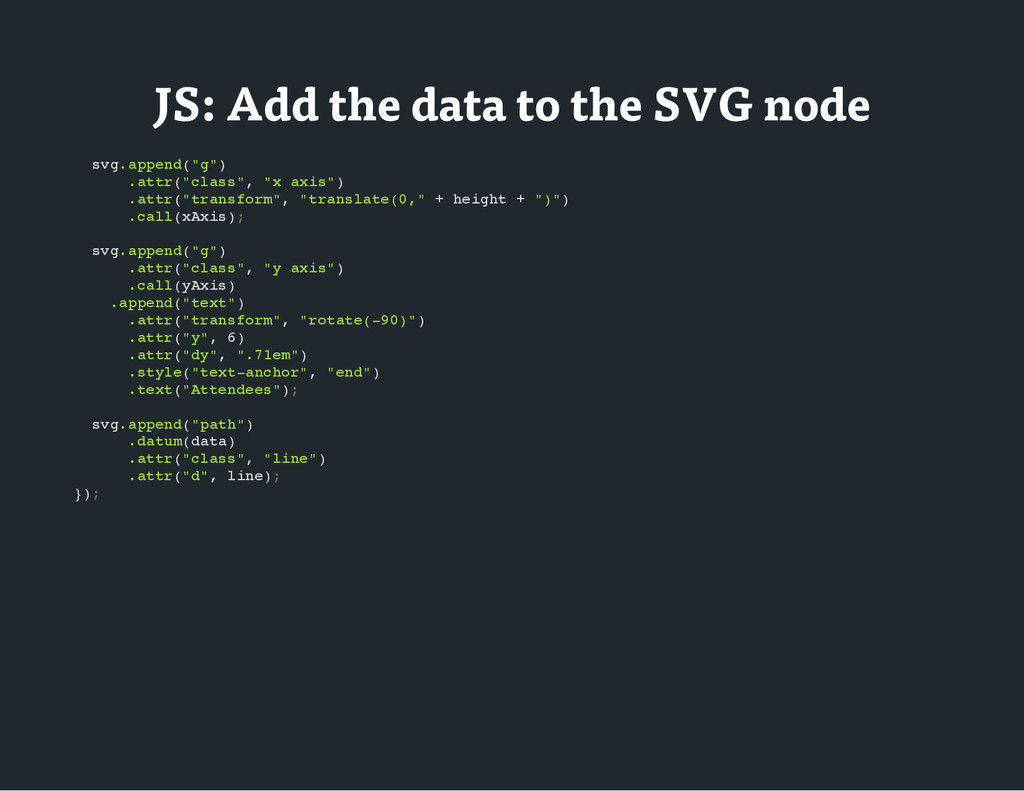
g . a p p e n d ( " g " ) . a t t r ( " c l a s s " , " x a x i s " ) . a t t r ( " t r a n s f o r m " , " t r a n s l a t e ( 0 , " + h e i g h t + " ) " ) . c a l l ( x A x i s ) ; s v g . a p p e n d ( " g " ) . a t t r ( " c l a s s " , " y a x i s " ) . c a l l ( y A x i s ) . a p p e n d ( " t e x t " ) . a t t r ( " t r a n s f o r m " , " r o t a t e ( - 9 0 ) " ) . a t t r ( " y " , 6 ) . a t t r ( " d y " , " . 7 1 e m " ) . s t y l e ( " t e x t - a n c h o r " , " e n d " ) . t e x t ( " A t t e n d e e s " ) ; s v g . a p p e n d ( " p a t h " ) . d a t u m ( d a t a ) . a t t r ( " c l a s s " , " l i n e " ) . a t t r ( " d " , l i n e ) ; } ) ;
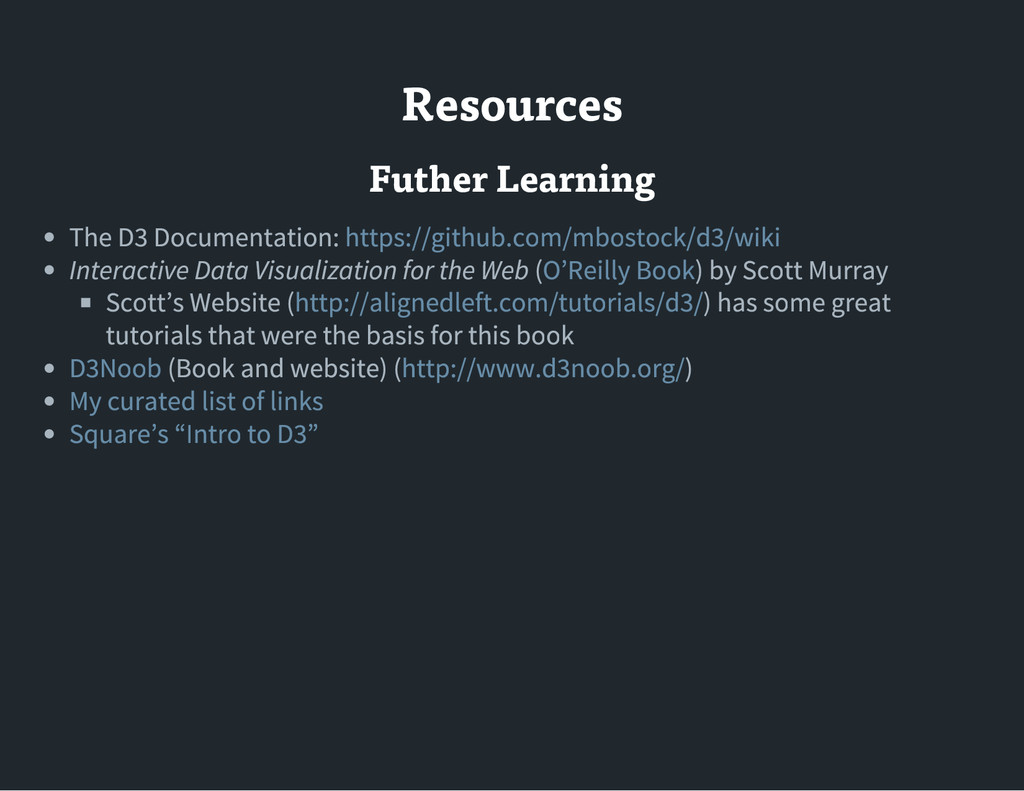
Visualization for the Web ( ) by Scott Murray Scott ’ s Website ( ) has some great tutorials that were the basis for this book ( Book and website ) ( ) https :// github .com / mbostock / d 3/ wiki O ’ Reilly Book http :// alignedleft .com / tutorials / d 3/ D 3Noob http :// www .d 3noob .org / My curated list of links Square ’ s “ Intro to D 3”