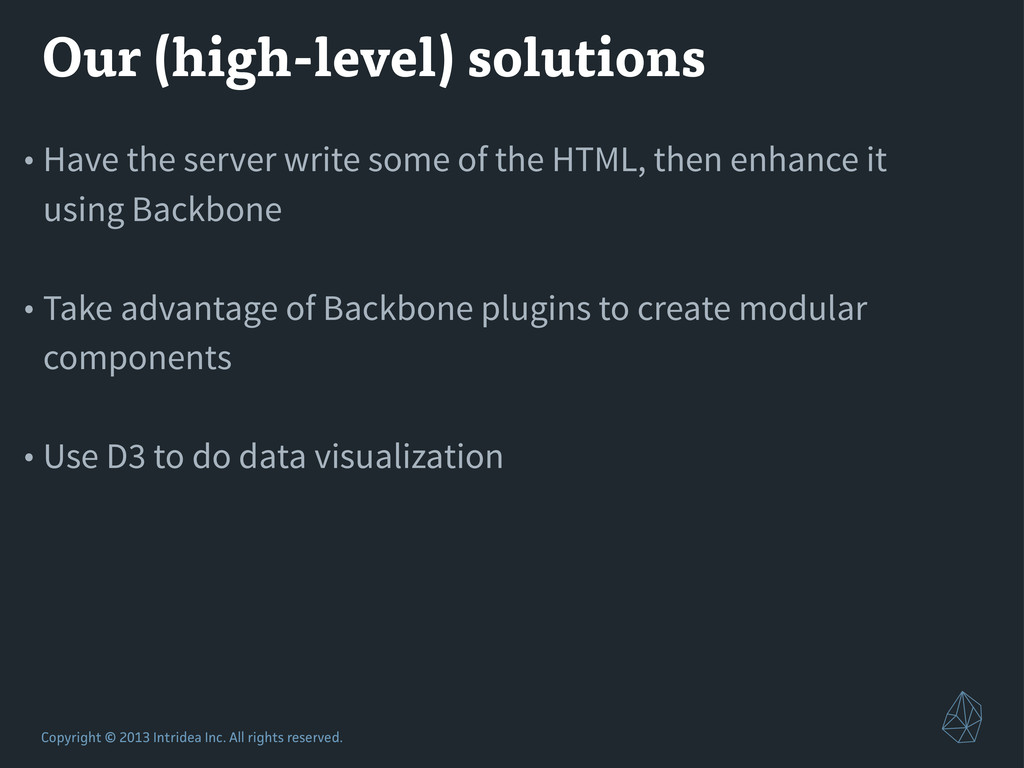
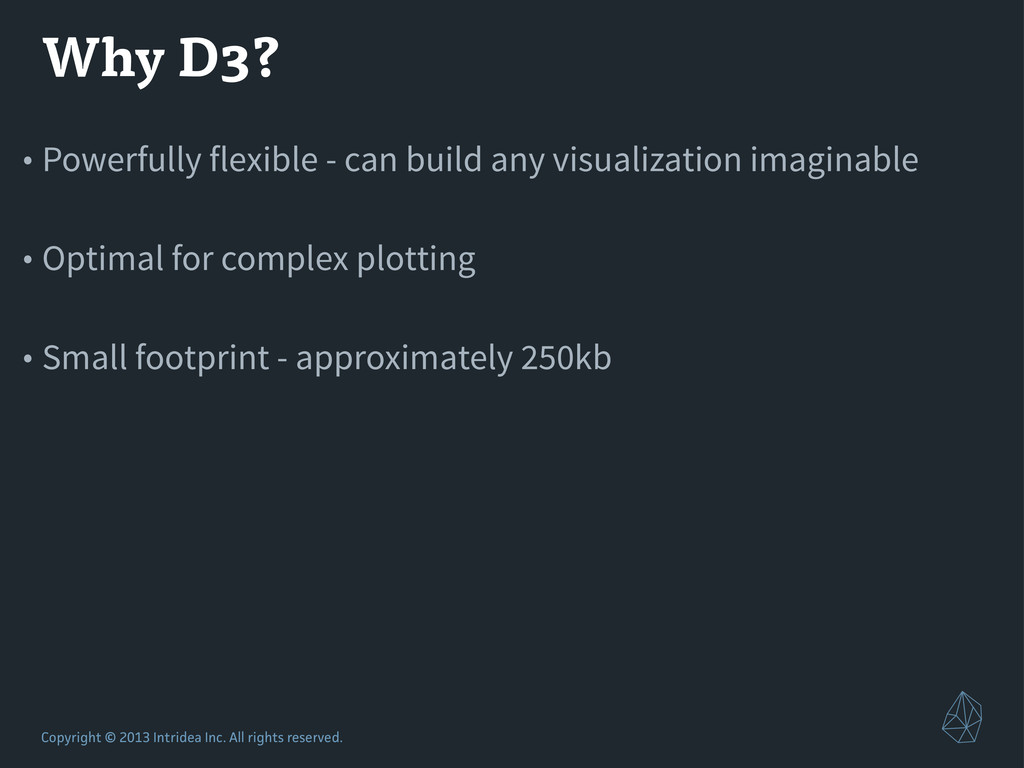
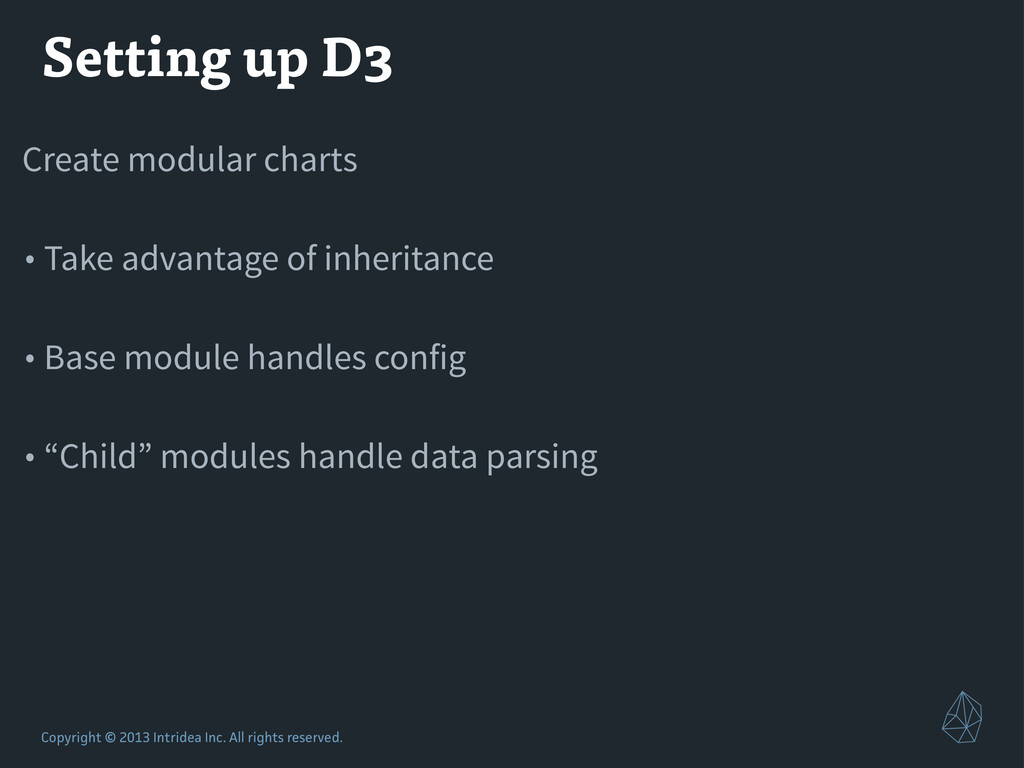
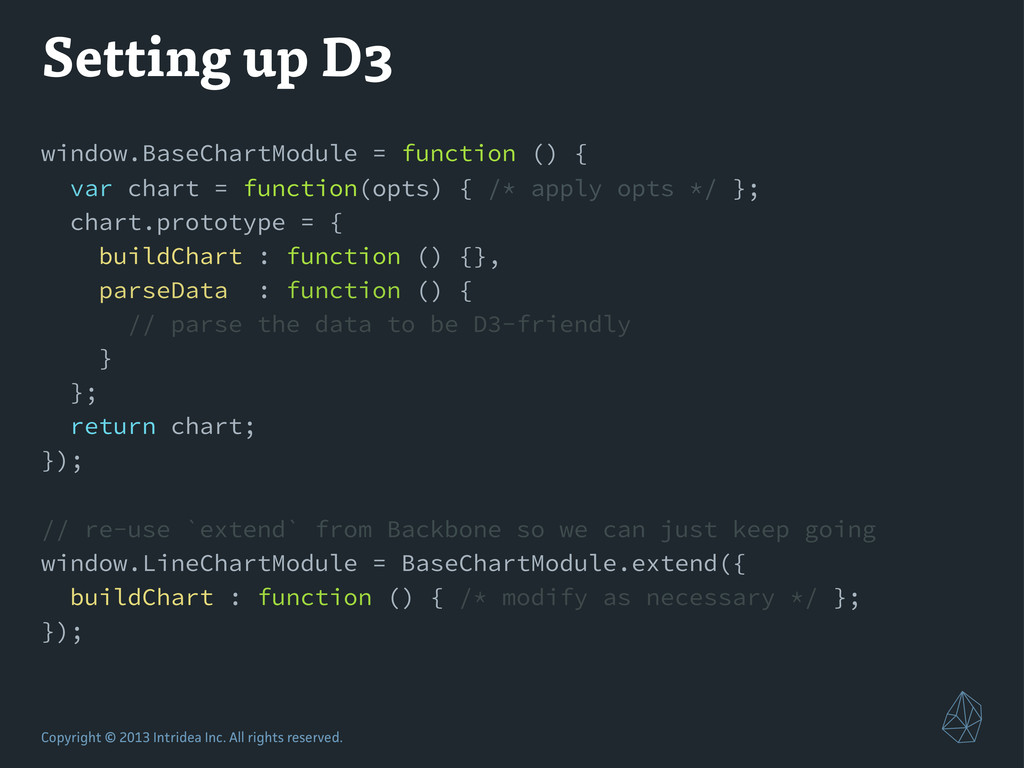
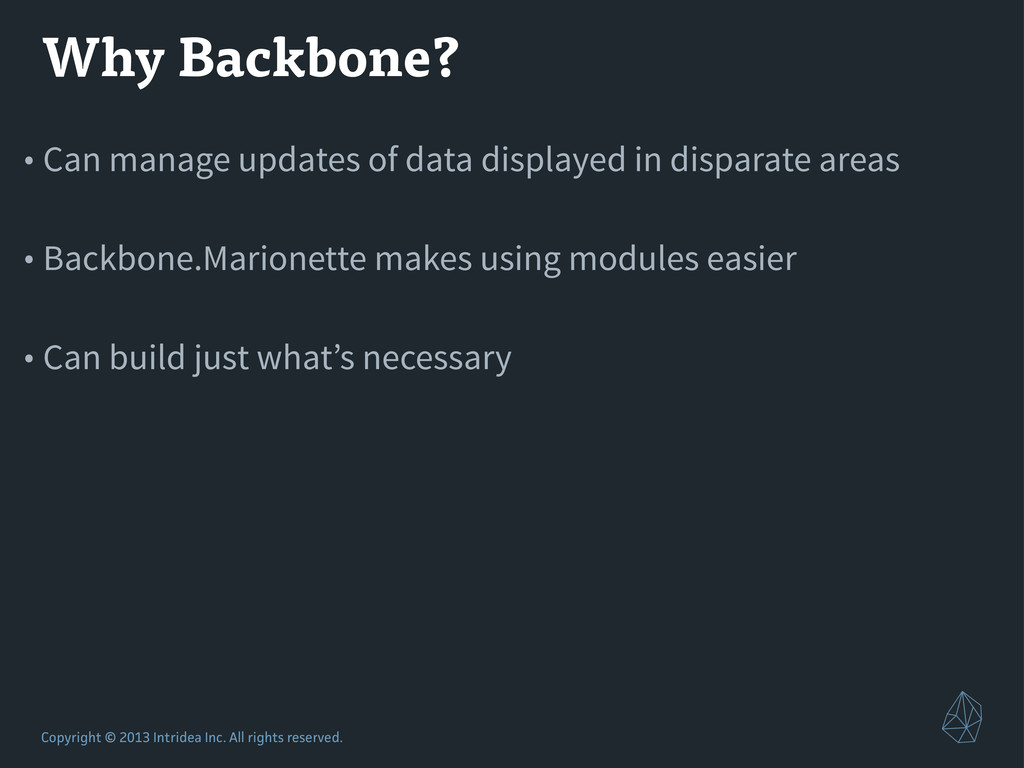
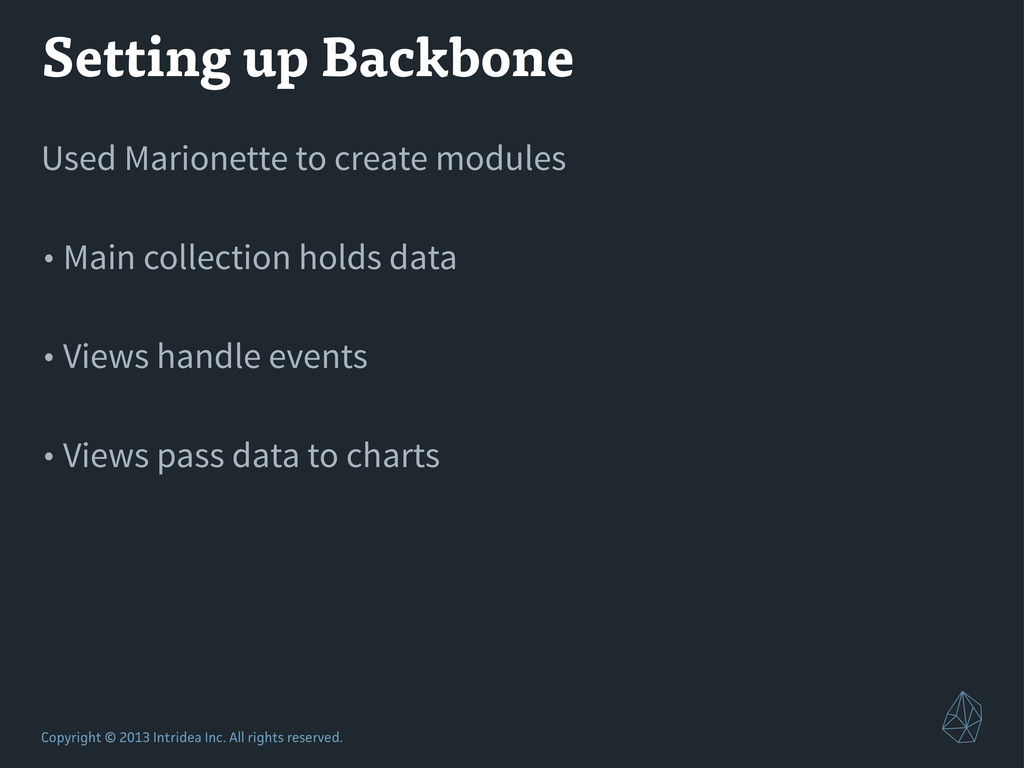
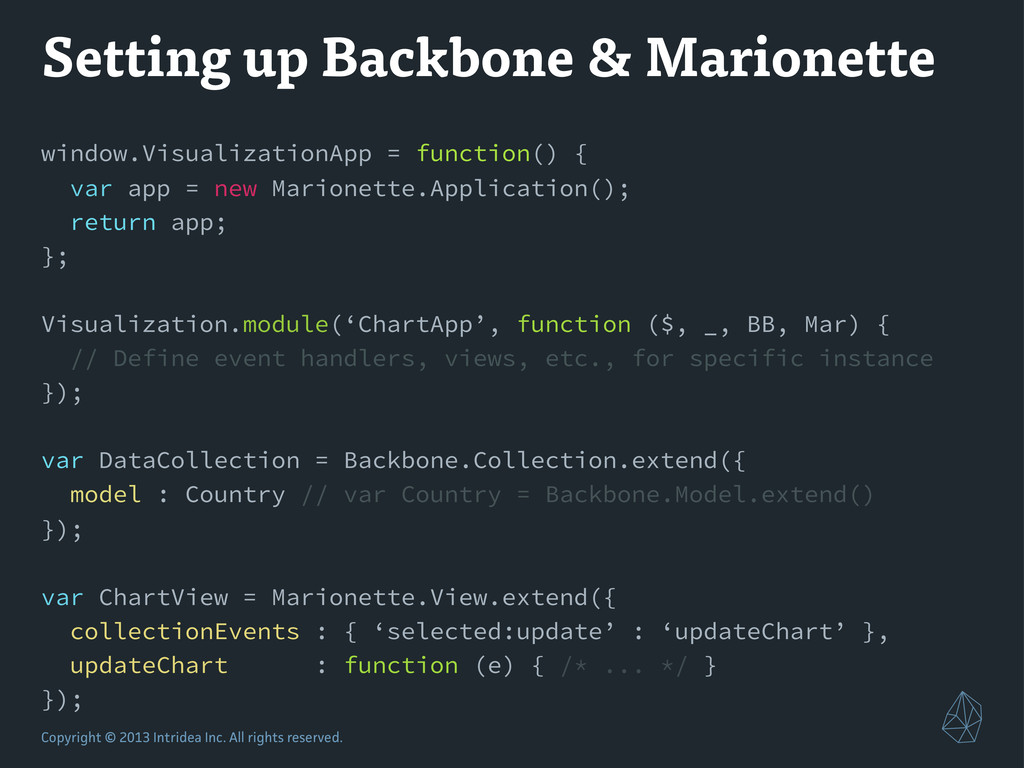
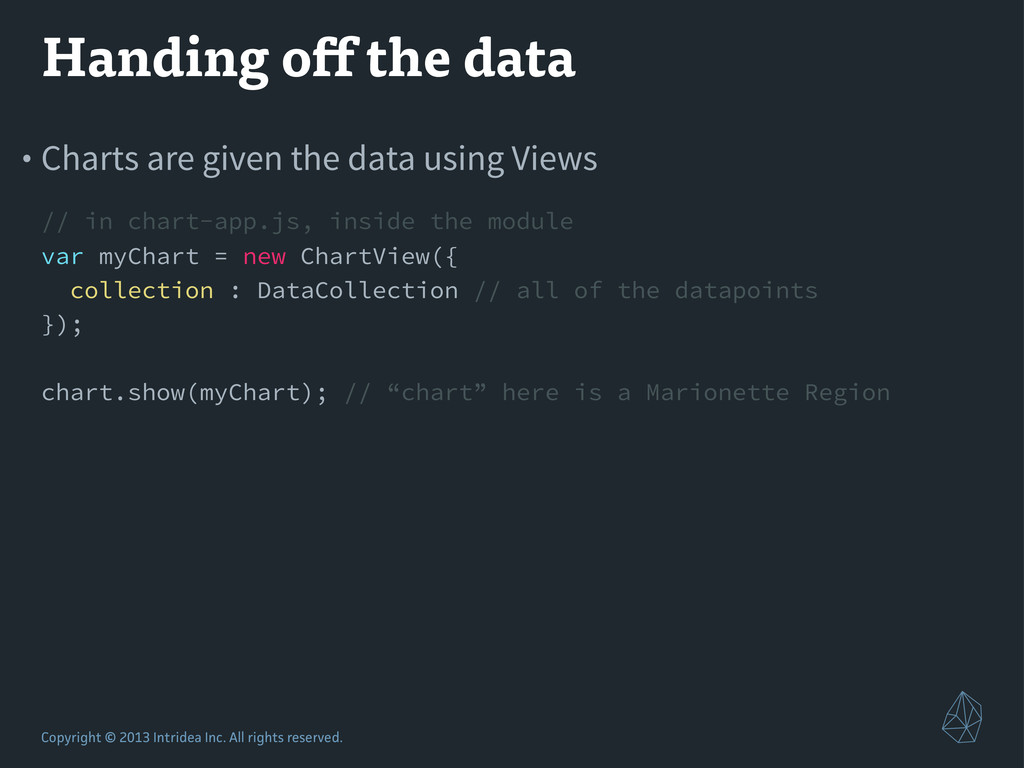
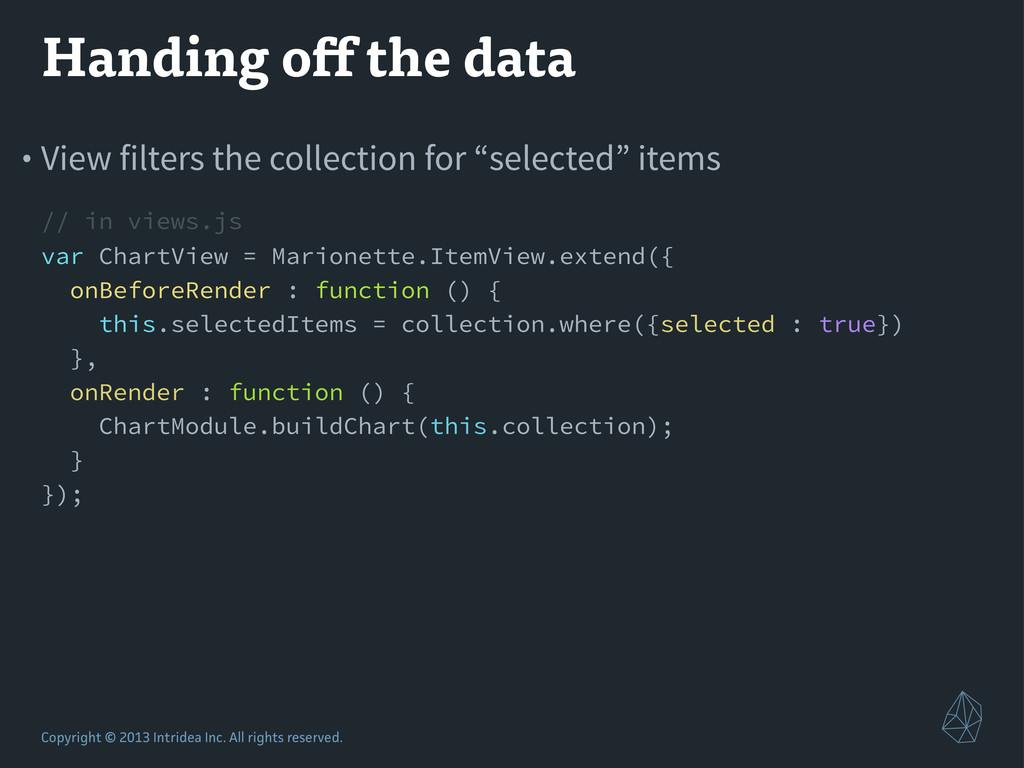
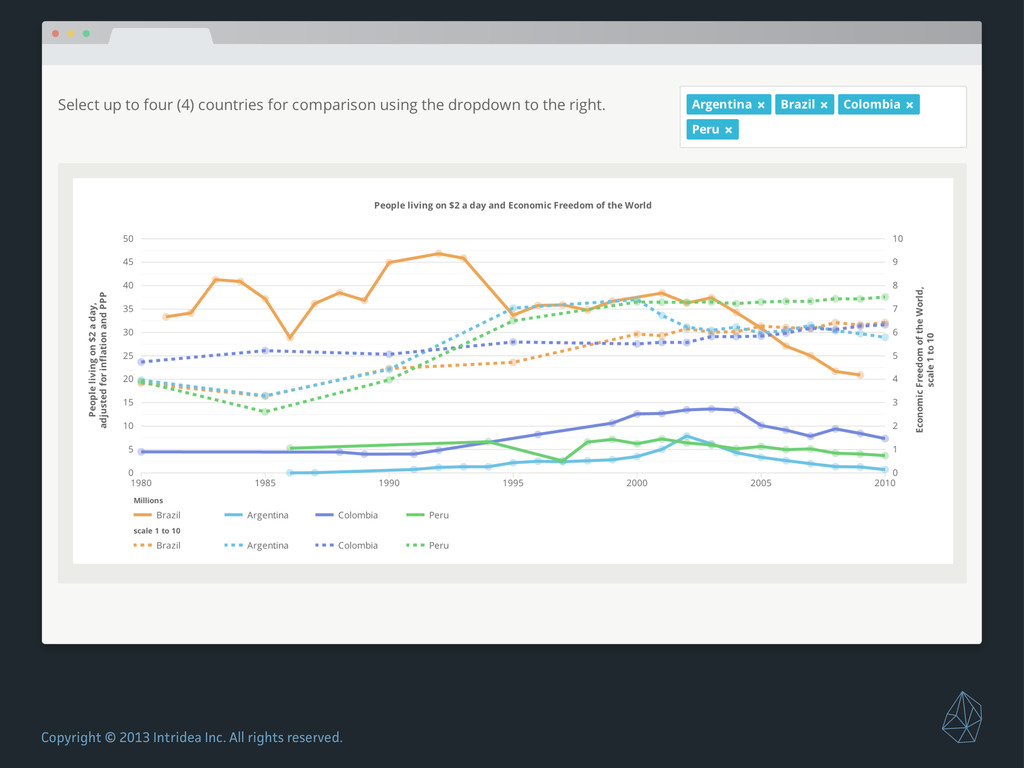
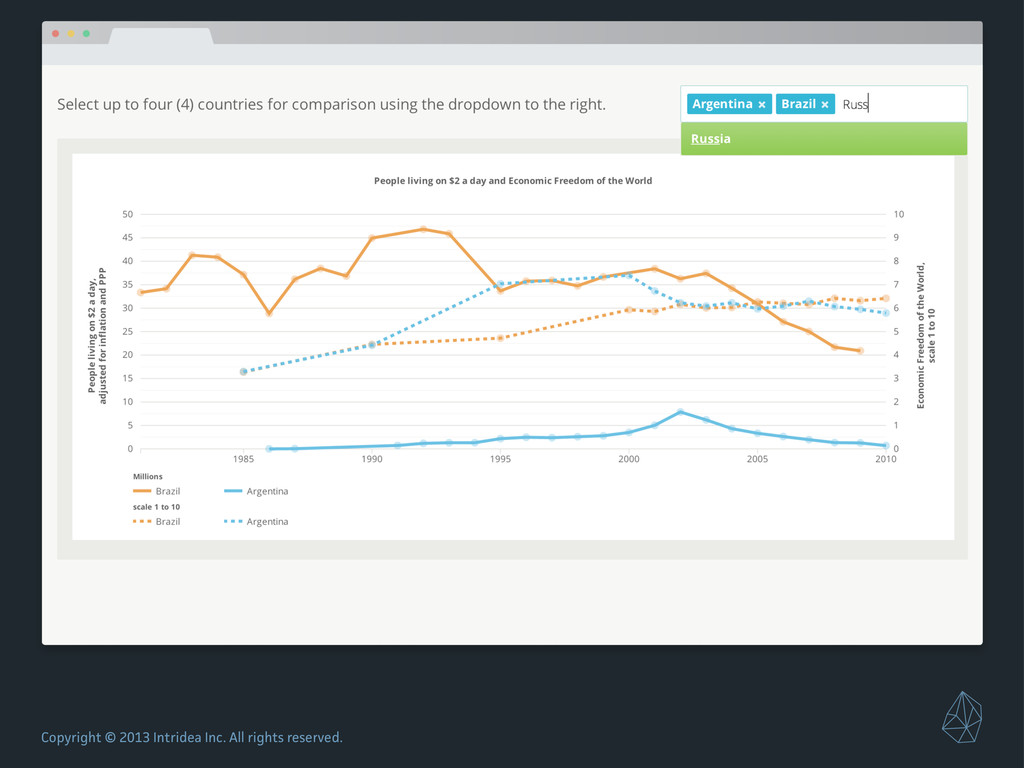
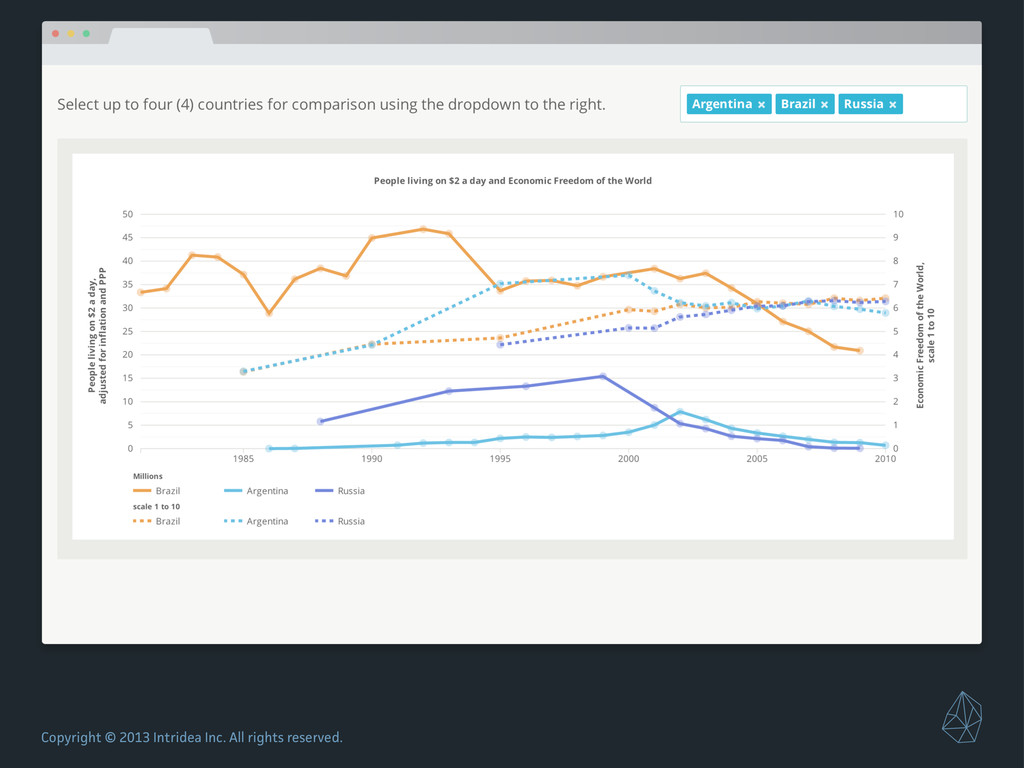
From my talk at Nation.js 2013: a look at how we built a complex data visualization web app with D3 and Backbone/Backbone.Marionette.
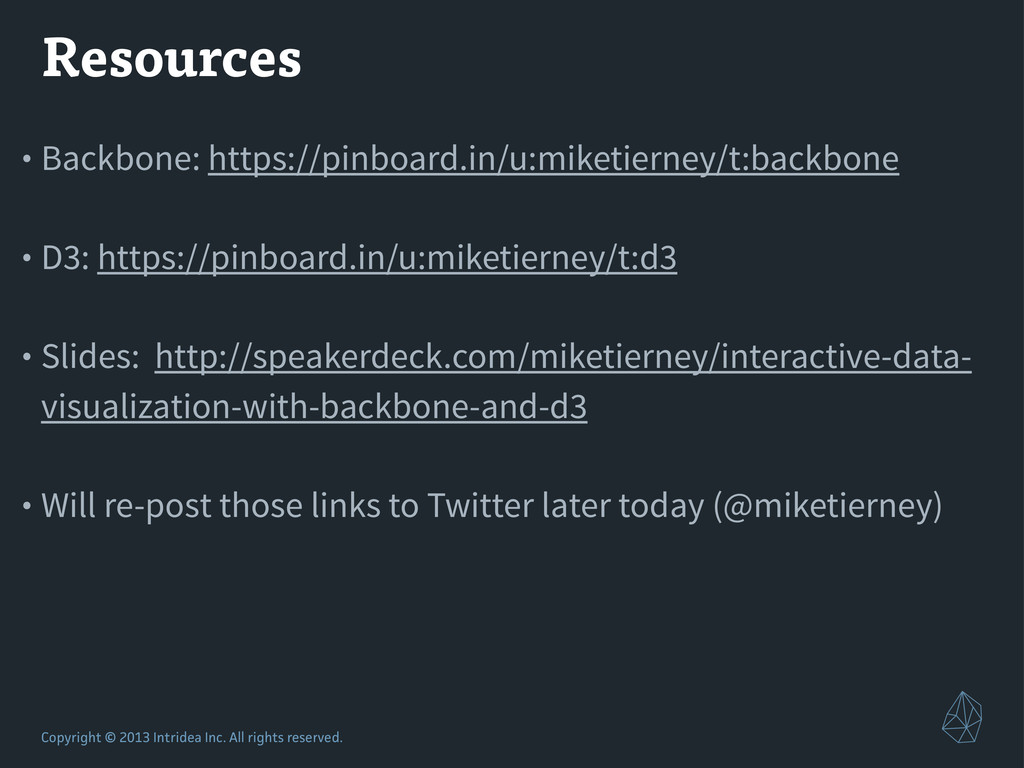
Resource links:
* https://pinboard.in/u:miketierney/t:backbone
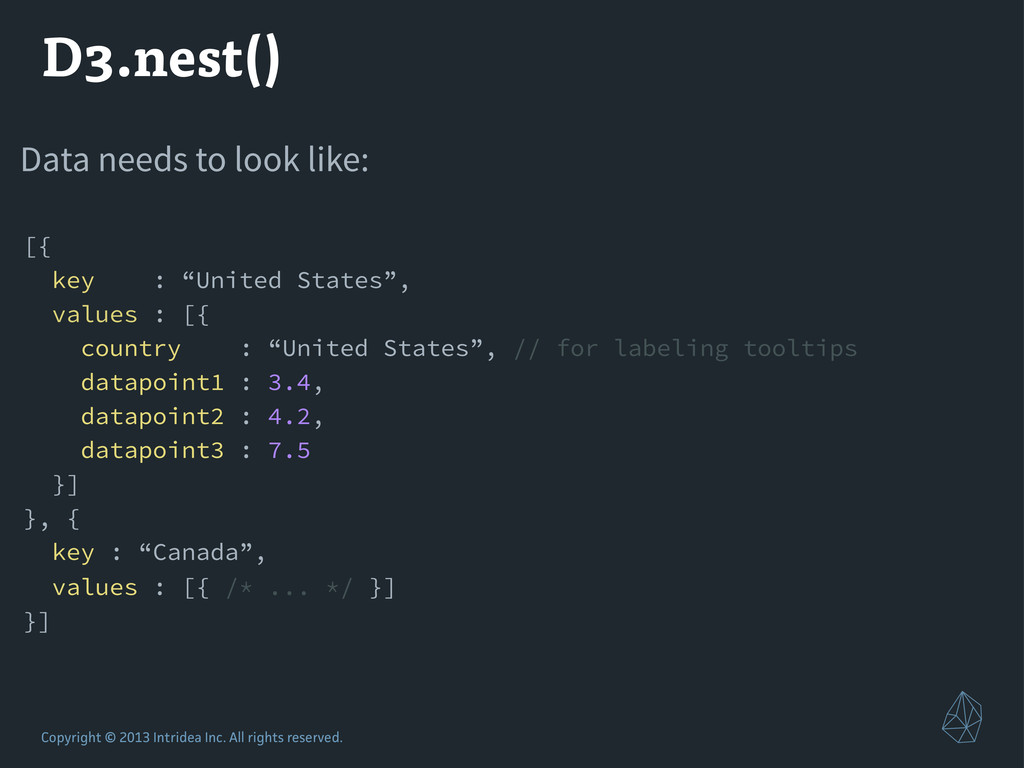
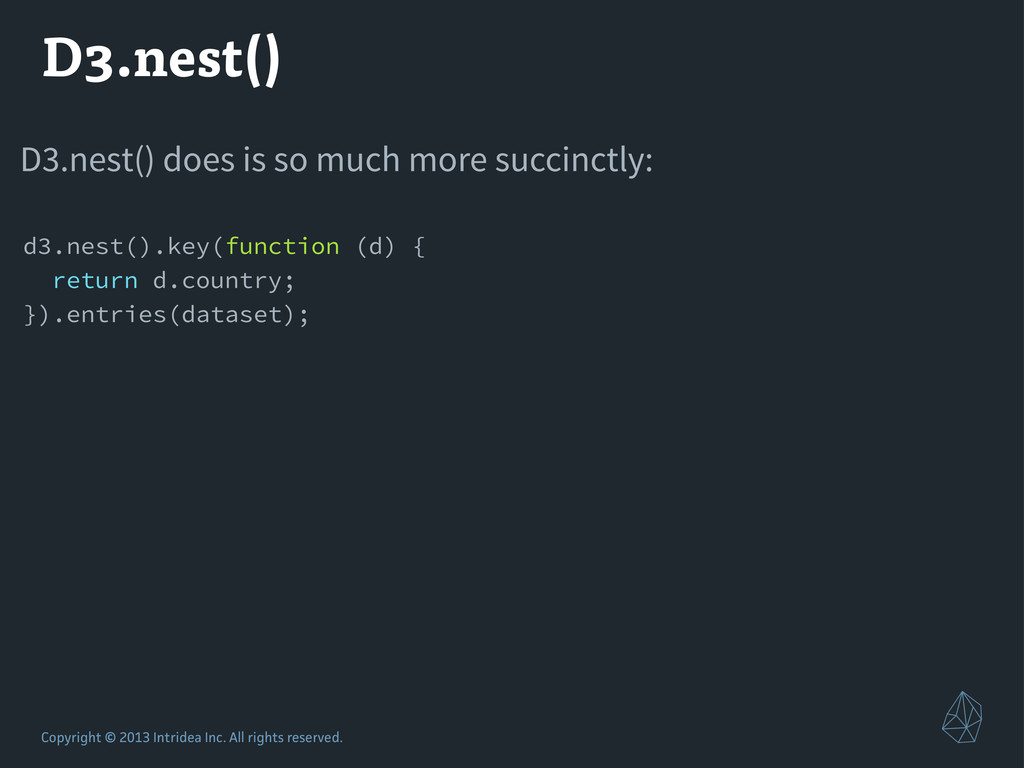
* https://pinboard.in/u:miketierney/t:d3
* http://speakerdeck.com/miketierney/interactive-data-visualization-with-backbone-and-d3