$30 off During Our Annual Pro Sale. View Details »

Azure Monitoring with Datadog Part 1

minato128
November 27, 2018

Azure Monitoring with Datadog Part 1

minato128

November 27, 2018
Tweet

More Decks by minato128

Other Decks in Technology

Transcript

  1. Azure Monitoring
    with Datadog Part 1
    @minato128

    View Slide

  2. 概要
    • Datadog?
    • How to
    • How to install
    • How to send metrics
    • Metrics
    • 注意点
    全体的に絵が少ないので随時デモで補足します

    View Slide

  3. Datadog?
    • Modern monitoring & analytics SaaS
    • See it 
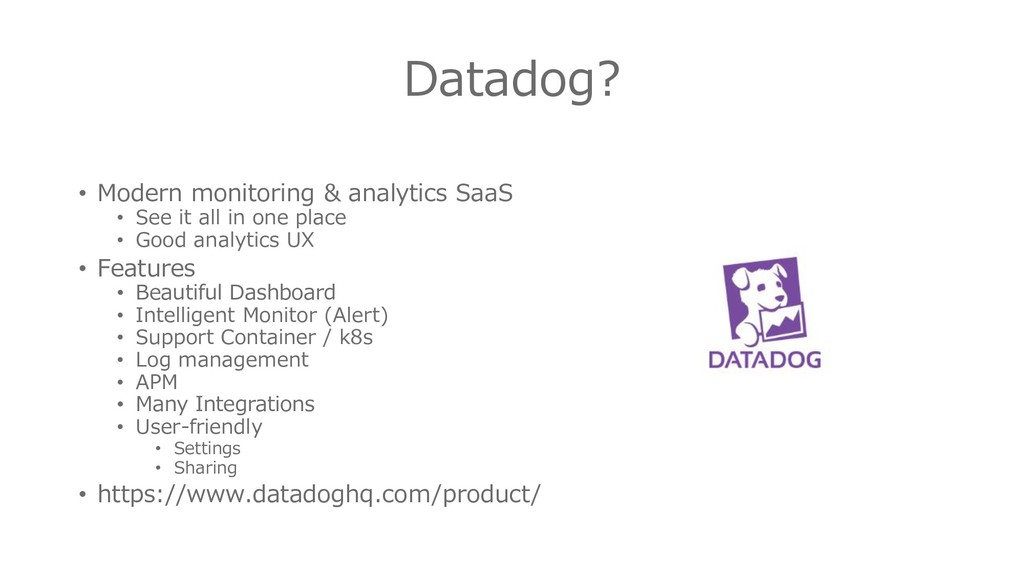
all in one place
    • Good analytics UX
    • Features
    • Beautiful Dashboard
    • Intelligent Monitor (Alert)
    • Support Container / k8s
    • Log management
    • APM
    • Many Integrations
    • User-friendly
    • Settings
    • Sharing
    • https://www.datadoghq.com/product/

    View Slide

  4. How to install/send metrics
    • Azure Integration
    • Integrationの画面からIDを設定する
    • https://docs.datadoghq.com/integrations/azure/
    • Azure Monitor から取れるメトリクスが一定間隔で取り込まれる
    • https://docs.microsoft.com/en-us/azure/monitoring-and-diagnostics/monitoring-
    supported-metrics
    • IaaS / Cloud Services / (AKS/k8s)
    • Install Datadog Agent
    • Default metrics (CPU/Memoryなど)は自動的に送信される
    • Custom metrics はアプリケーションから DogStatsD 経由で送信する
    • https://docs.datadoghq.com/developers/dogstatsd/
    • App Service / Azure Functions
    • Datadogにログやメトリクスを直接送信する
    • https://docs.datadoghq.com/logs/log_collection/csharp/?tab=serilog#agentless-
    logging

    View Slide

  5. Azure Integration

    View Slide

  6. Azure Integration
    https://docs.datadoghq.com/integrations/azure/

    View Slide

  7. IaaS or Azure Cloud Services
    https://docs.datadoghq.com/developers/dogstatsd/

    View Slide

  8. IaaS or Azure Cloud Services

    View Slide

  9. Azure Functions or App Service

    View Slide

  10. Default Metrics
    • Agent をインストールしているときにそのインスタンスのメト
    リクスが自動送信される
    • Metrics
    • CPU
    • Memory
    • Disk
    • Network
    • など

    View Slide

  11. Custom Metrics
    • DogstatsD や Web API で送信する
    • 監視したい Metrics を自由に送ることができる
    • Metrics Type
    • Gauge
    • そのときのスナップショット的な値
    • Flush間隔(10sec)で複数送ったときは最後の値が採用される
    • Histogram
    • Flush間隔(10sec) 内の統計値
    • Max / Min / Count / Avg / Median / 95 percentile
    • Count
    • Flush間隔(10sec) 内でのカウンター
    • Rate
    • https://docs.datadoghq.com/developers/metrics/

    View Slide

  12. Event
    • DogstatsD や Web API で送信する
    • アプリケーションの起動や例外などのイベントをログレベルを
    設定して送る
    • アラートを発報したり
    • ダッシュボードに Overlay 表示したりできる
    • グラフの異変が何かのイベントによるものかどうかすぐにわかる

    View Slide

  13. 注意点
    • Datadog Agent v6 は Azure Cloud Services にインストール
    できない (2018/11時点)
    • System Drive が C しか対応していないため
    • Cloud Service の System Drive は D
    • Feature Request / GitHub PR は出しているがまだ対応していない
    • Datadog Agent v5 は可能
    • DogStatd のパケット数上限 (Azureかどうかは関係ない)
    • 10秒あたり2000パケットまで
    • https://help.datadoghq.com/hc/en-us/articles/203567579-Why-am-I-
    seeing-inconsistencies-for-metrics-submitted-to-DogStatsD-
    • 超えるとメトリクスが正確でなくなる
    • 必要に応じてアプリ内で集計するかサンプリングする必要がある

    View Slide

  14. Application Insights に既にあるログは?
    • 必要なものだけ Custom Metrics / Log として送る
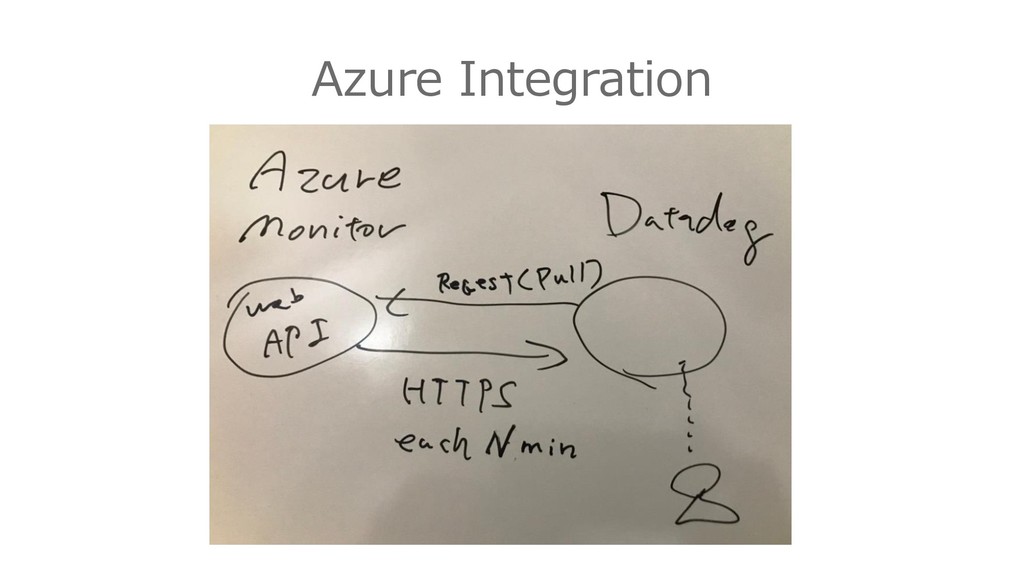
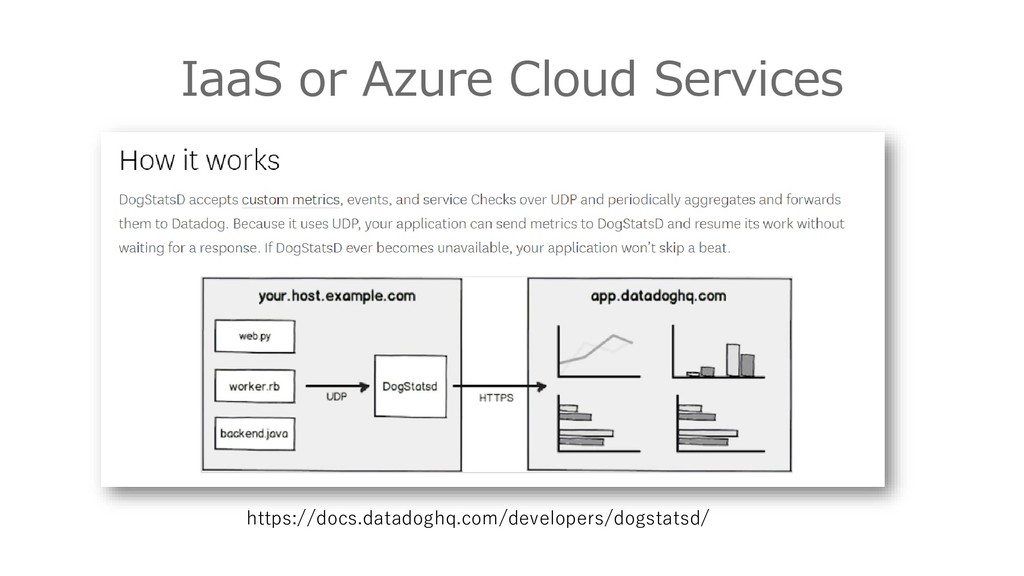
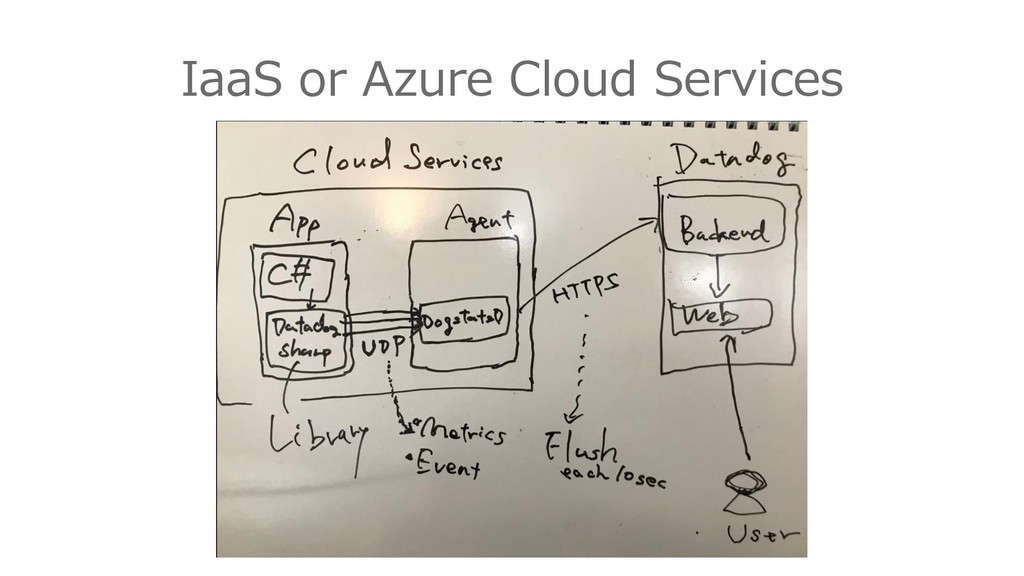
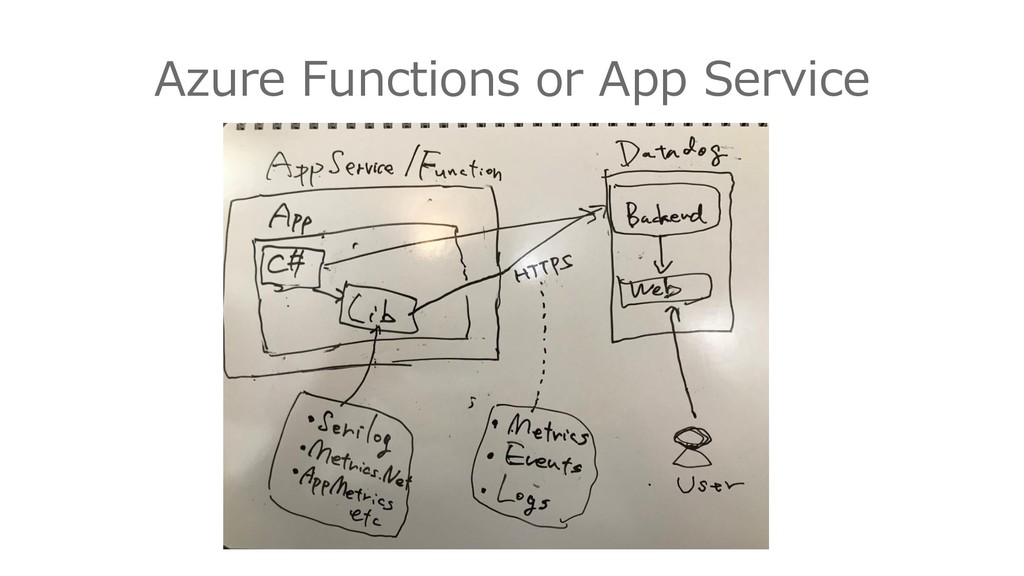
    • 例えば、
    • Azure Functions で
    • Application Insights Web API で取得して
    • Datadog Web API で送る
    • IaaS で
    • Application Insights Web API で取得して
    • Datadog Agent で送る

    View Slide

  15. DEMO
    • Dashboard
    • Time range
    • Share
    • Event overlay
    • Monitor (Alert)
    • Code

    View Slide