Upgrade to Pro — share decks privately, control downloads, hide ads and more …

Let them eat cake (first)!

Let them eat cake (first)!

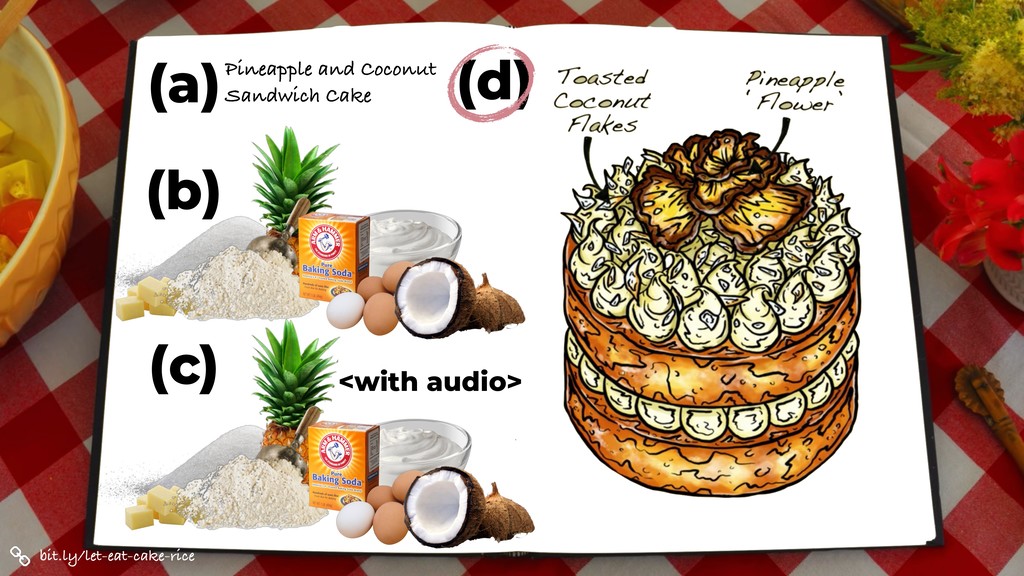
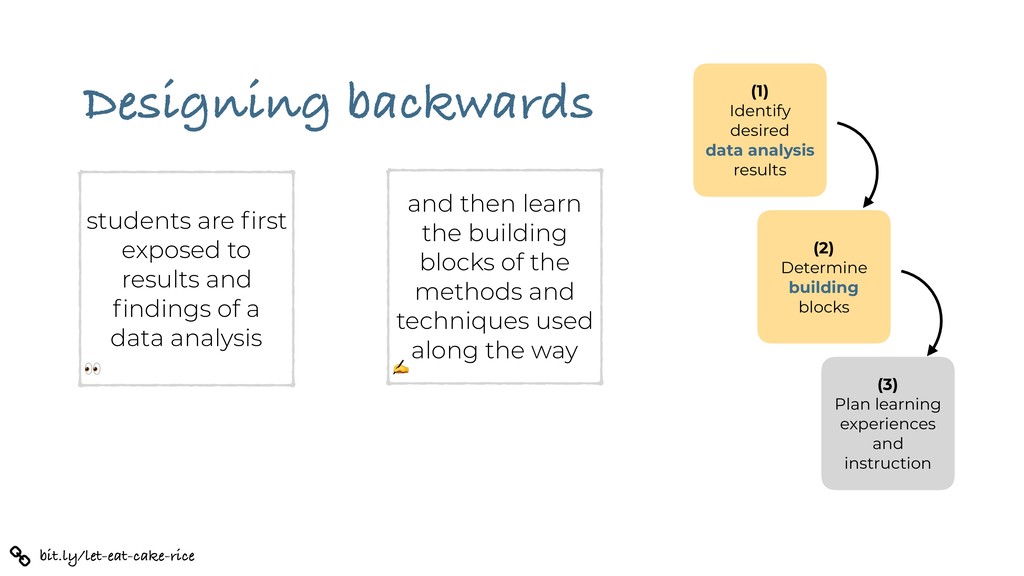
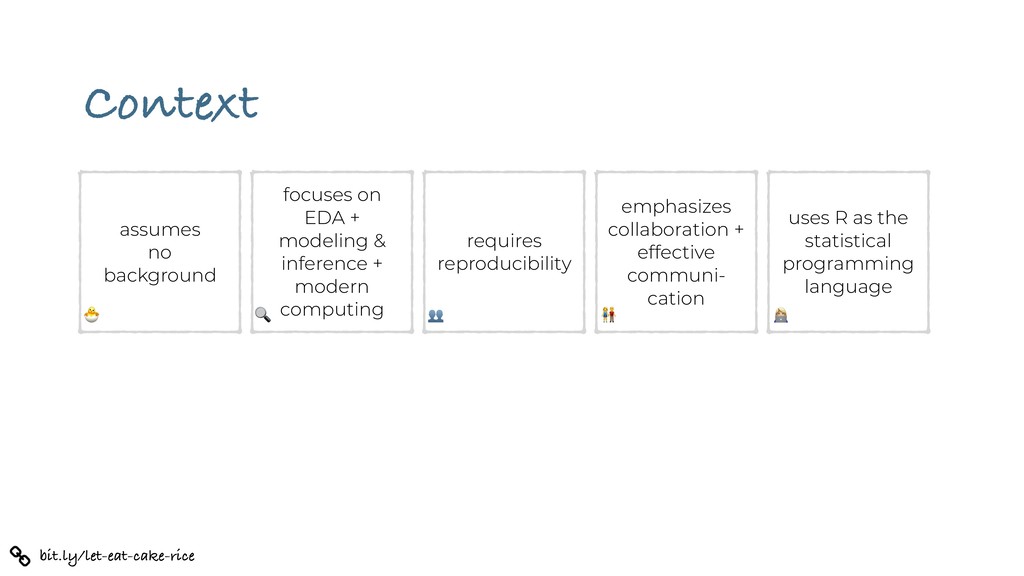
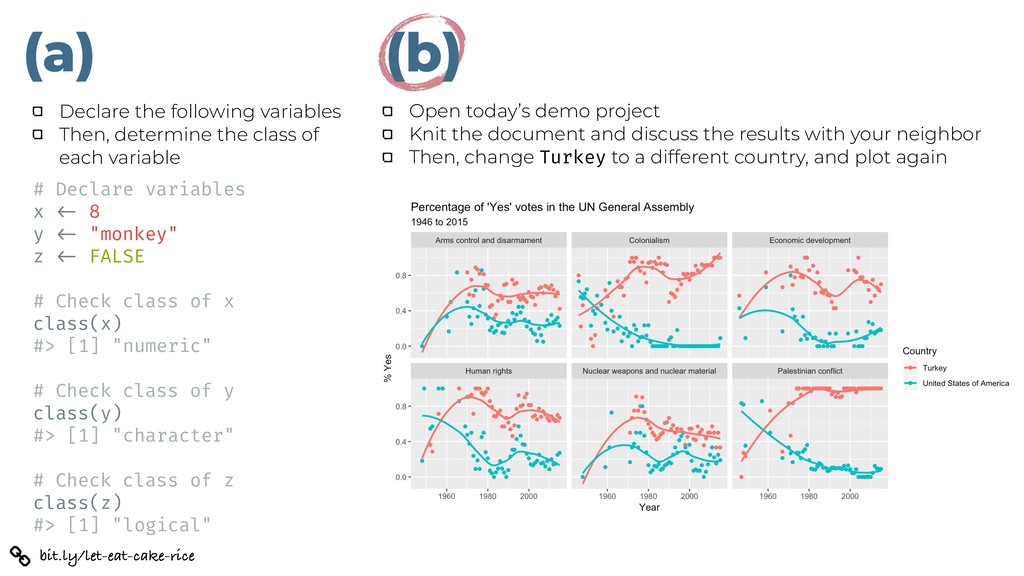
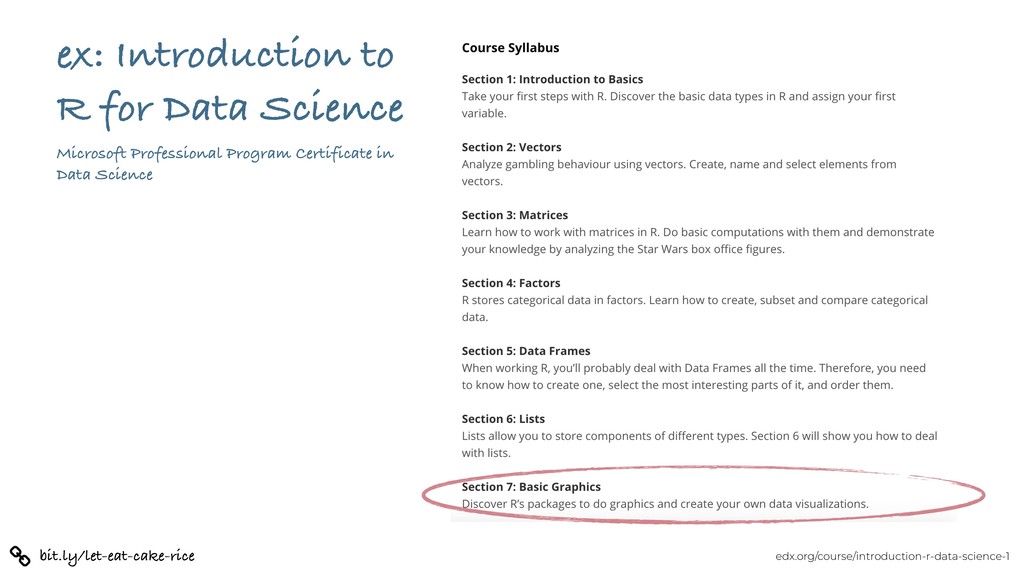
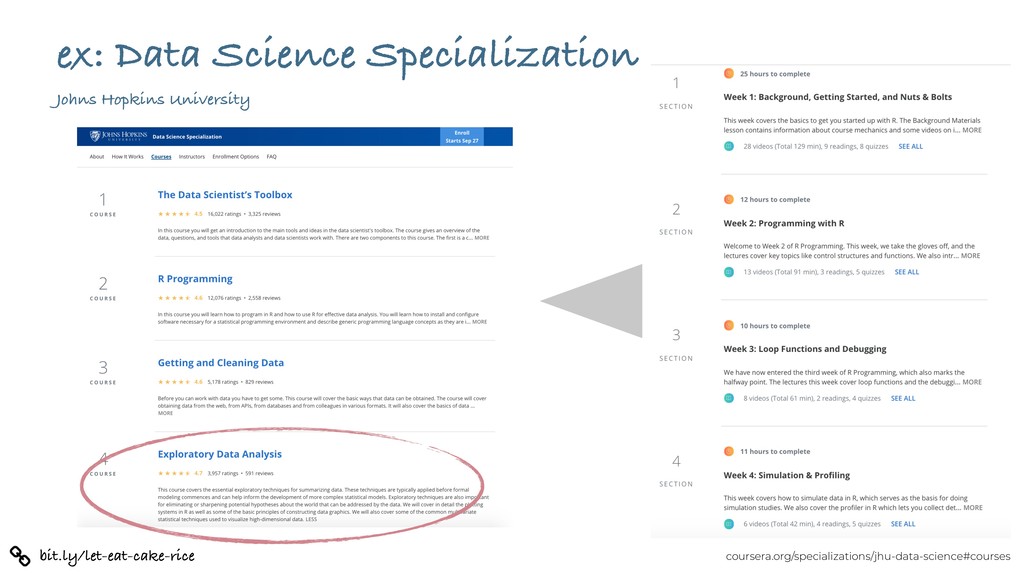
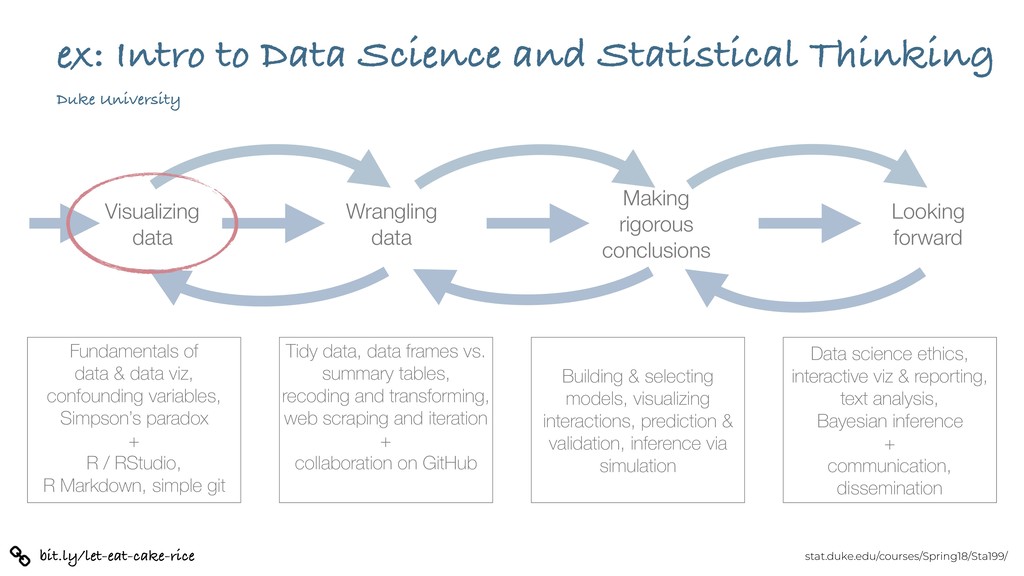
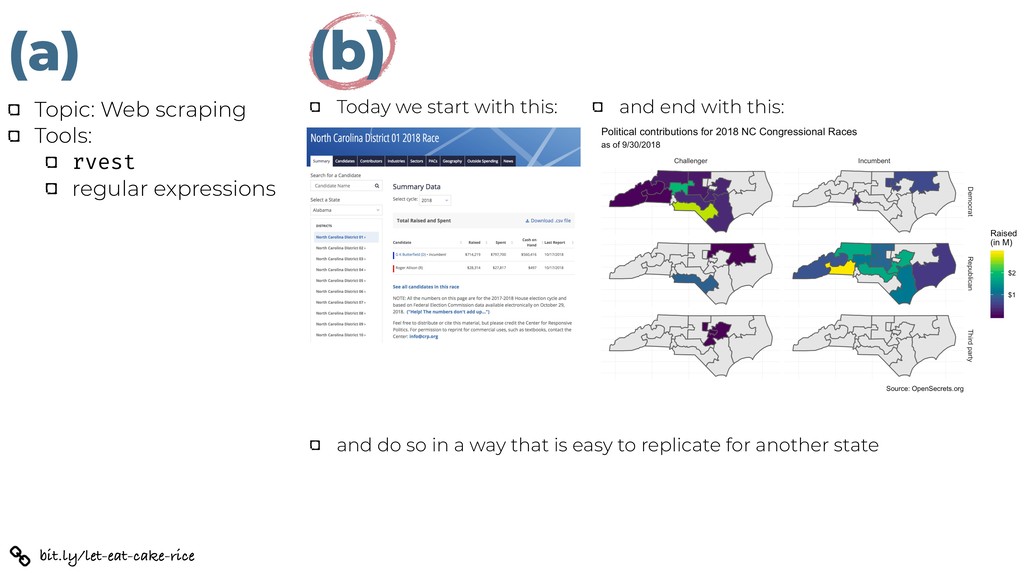
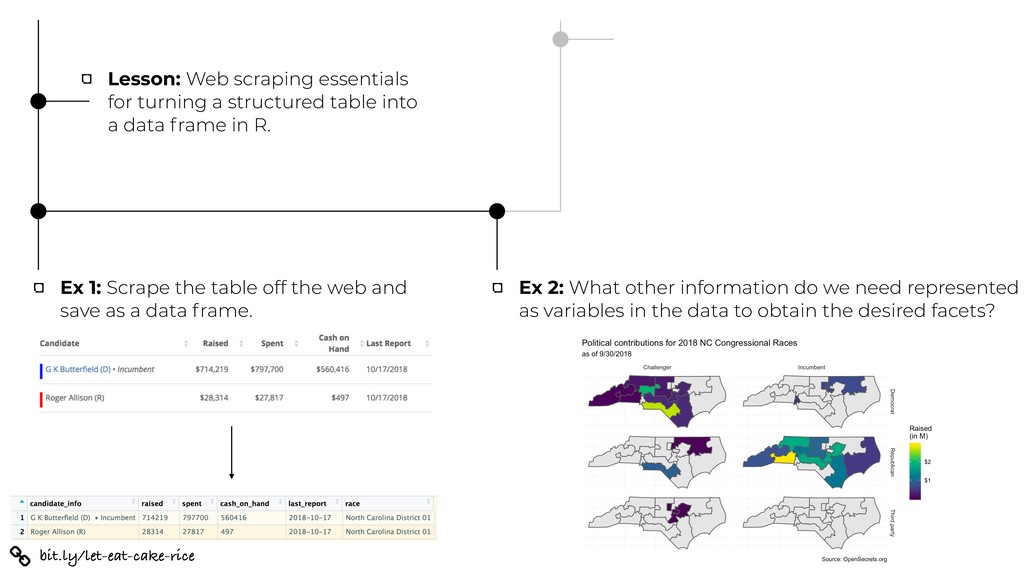
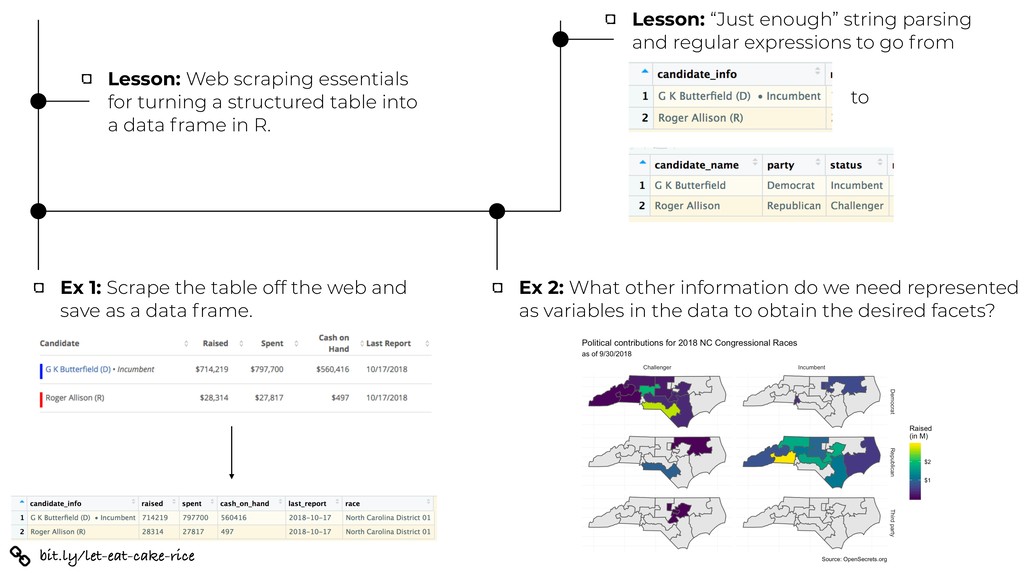
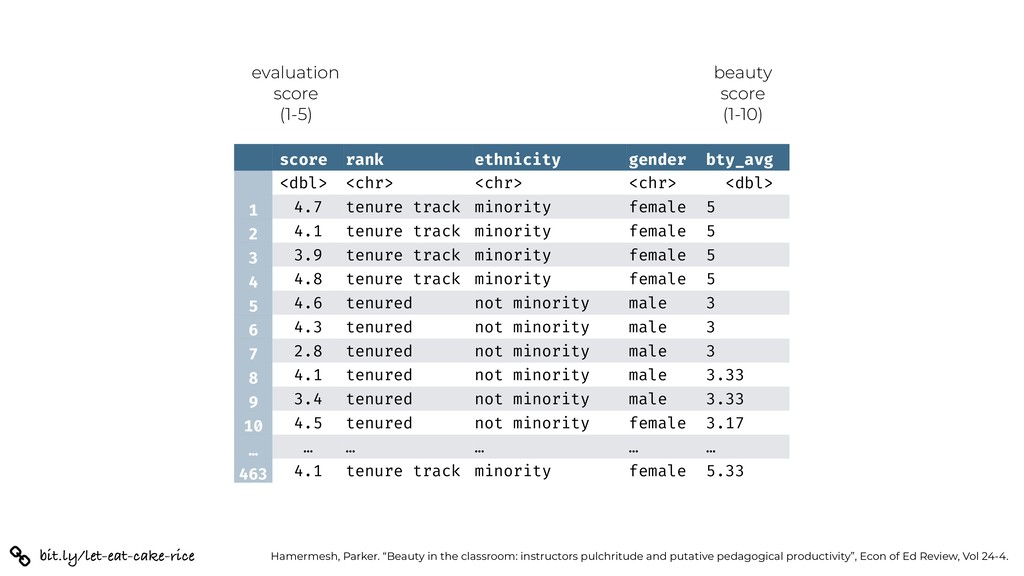
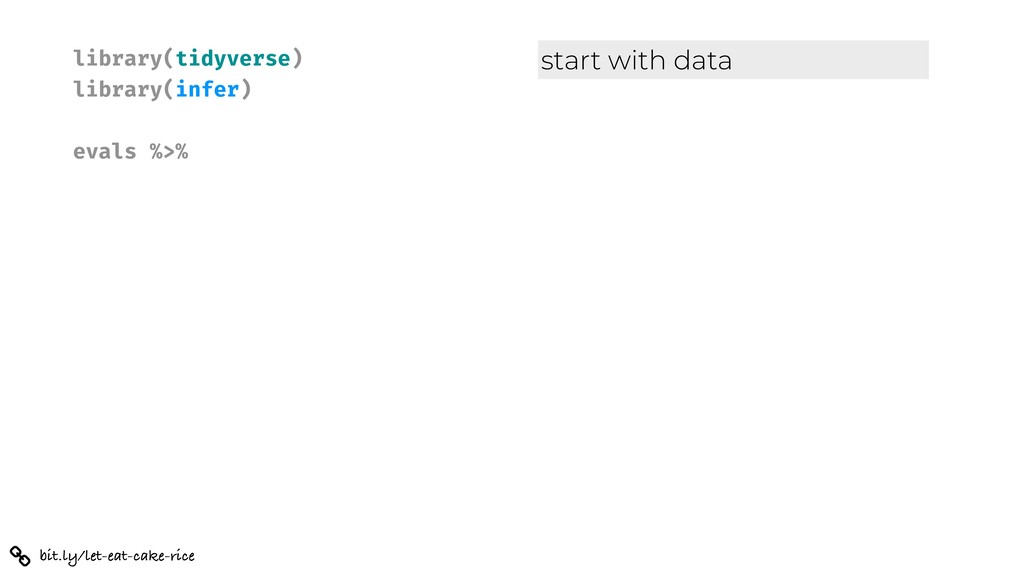
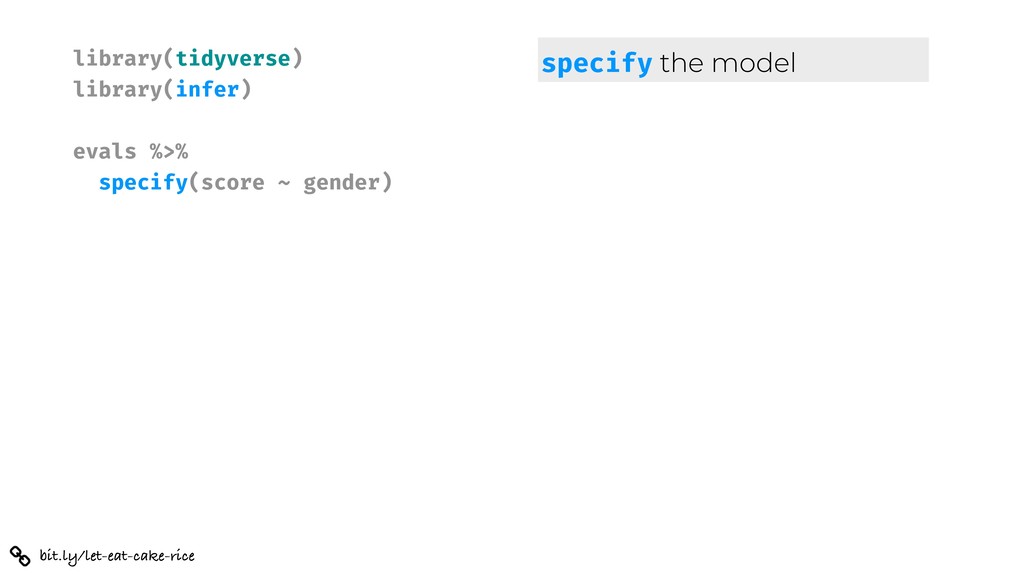
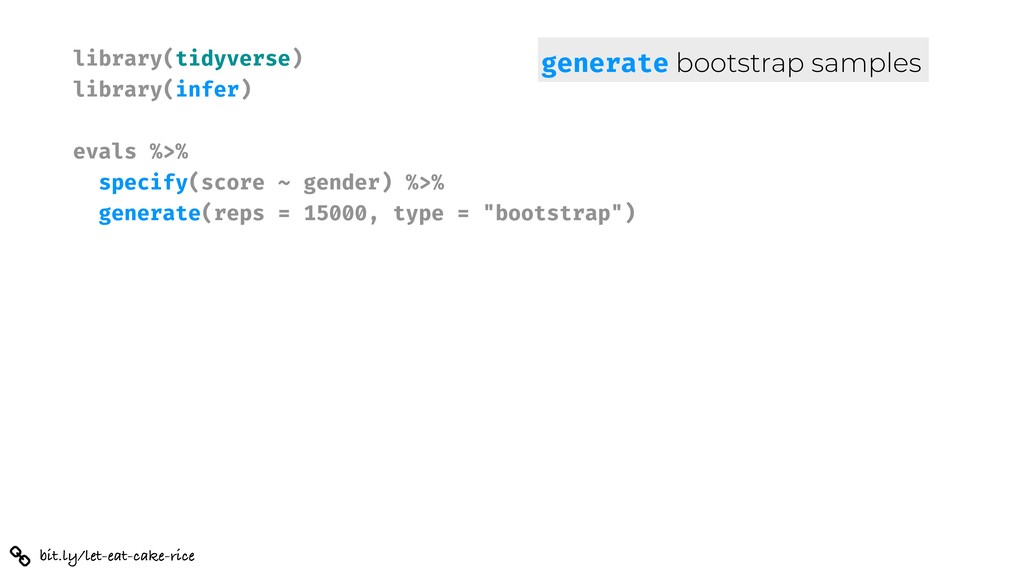
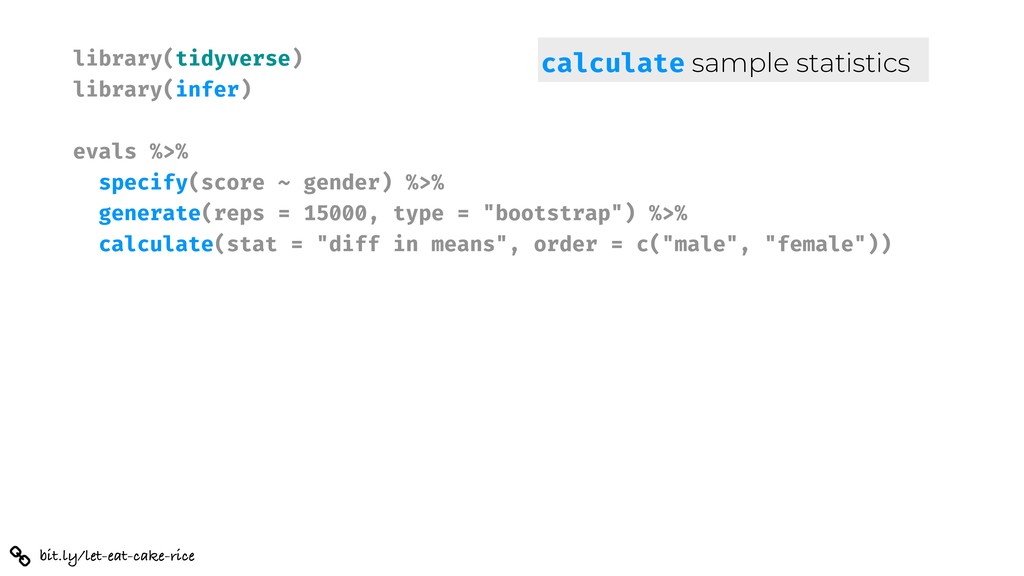
Backwards design, designing educational curricula by setting goals before choosing instructional methods and forms of assessment, is a widely accepted approach to course development. In this talk we introduce a course design approach inspired by backwards design, where students are exposed to results and findings of a data analysis first and then learn about the building blocks of the methods and techniques used to arrive at these results. We present this approach in the context of an introductory data science course that focuses on exploratory data analysis, modeling, and effective communication, while requiring reproducibility and collaboration. The talk is organized in three parts (visualization, data acquisition, and inference) and features examples of in class activities and details of the course curriculum.

This talk is delivered at Rice University. For more info, see http://bit.ly/repo-eat-cake.

Mine Cetinkaya-Rundel

January 24, 2019
Tweet

More Decks by Mine Cetinkaya-Rundel

Other Decks in Education

Transcript

  1. Which of the following gives you a better sense of

    the final product? Q bit.ly/let-eat-cake-rice
  2. Wiggins, Grant P., Grant Wiggins, and Jay McTighe. Understanding by

    design. Ascd, 2005. (1) Identify desired results (2) Determine acceptable evidence (3) Plan learning experiences and instruction Backward design set goals for educational curriculum before choosing instructional methods + forms of assessment analogous to travel planning - itinerary deliberately designed to meet cultural goals, not purposeless tour of all major sites in a foreign country bit.ly/let-eat-cake-rice
  3. (1) Identify desired data analysis results (2) Determine building blocks

    (3) Plan learning experiences and instruction Designing backwards students are first exposed to results and findings of a data analysis and then learn the building blocks of the methods and techniques used along the way ✍ bit.ly/let-eat-cake-rice
  4. Context assumes no background focuses on EDA + modeling &

    inference + modern computing requires reproducibility emphasizes collaboration + effective communi- cation uses R as the statistical programming language ) bit.ly/let-eat-cake-rice
  5. Which of the following is more likely to be interesting

    for a wide range of students? Q bit.ly/let-eat-cake-rice
  6. # Declare variables x !<- 8 y !<- "monkey" z

    !<- FALSE # Check class of x class(x) #> [1] "numeric" # Check class of y class(y) #> [1] "character" # Check class of z class(z) #> [1] "logical" (a) (b) Open today’s demo project Knit the document and discuss the results with your neighbor Then, change Turkey to a different country, and plot again Declare the following variables Then, determine the class of each variable bit.ly/let-eat-cake-rice
  7. but let’s focus on the task at hand… Open today’s

    demo project Knit the document and discuss the results with your neighbor Then, change Turkey to a different country, and plot again bit.ly/let-eat-cake-rice
  8. un_votes %>% filter(country %in% c("United States of America", "Turkey")) %>%

    inner_join(un_roll_calls, by = "rcid") %>% inner_join(un_roll_call_issues, by = "rcid") %>% group_by(country, year = year(date), issue) %>% summarize( votes = n(), percent_yes = mean(vote !== "yes") ) %>% filter(votes > 5) %>% # only use records where there are more than 5 votes ggplot(mapping = aes(x = year, y = percent_yes, color = country)) + geom_point() + geom_smooth(method = "loess", se = FALSE) + facet_wrap(~ issue) + labs( title = "Percentage of 'Yes' votes in the UN General Assembly", subtitle = "1946 to 2015", y = "% Yes", x = "Year", color = "Country" ) bit.ly/let-eat-cake-rice
  9. un_votes %>% filter(country %in% c("United States of America", "Turkey")) %>%

    inner_join(un_roll_calls, by = "rcid") %>% inner_join(un_roll_call_issues, by = "rcid") %>% group_by(country, year = year(date), issue) %>% summarize( votes = n(), percent_yes = mean(vote !== "yes") ) %>% filter(votes > 5) %>% # only use records where there are more than 5 votes ggplot(mapping = aes(x = year, y = percent_yes, color = country)) + geom_point() + geom_smooth(method = "loess", se = FALSE) + facet_wrap(~ issue) + labs( title = "Percentage of 'Yes' votes in the UN General Assembly", subtitle = "1946 to 2015", y = "% Yes", x = "Year", color = "Country" ) bit.ly/let-eat-cake-rice
  10. un_votes %>% filter(country %in% c("United States of America", "Canada")) %>%

    inner_join(un_roll_calls, by = "rcid") %>% inner_join(un_roll_call_issues, by = "rcid") %>% group_by(country, year = year(date), issue) %>% summarize( votes = n(), percent_yes = mean(vote !== "yes") ) %>% filter(votes > 5) %>% # only use records where there are more than 5 votes ggplot(mapping = aes(x = year, y = percent_yes, color = country)) + geom_point() + geom_smooth(method = "loess", se = FALSE) + facet_wrap(~ issue) + labs( title = "Percentage of 'Yes' votes in the UN General Assembly", subtitle = "1946 to 2015", y = "% Yes", x = "Year", color = "Country" ) bit.ly/let-eat-cake-rice
  11. Why = ? more likely for students to have intuition

    coming in easier for students to catch their own mistakes who doesn’t like a good piece of cake visualization? bit.ly/let-eat-cake-rice
  12. stat.duke.edu/courses/Spring18/Sta199/ ex: Intro to Data Science and Statistical Thinking Visualizing

    data Wrangling data Making rigorous conclusions Looking forward Fundamentals of data & data viz, confounding variables, Simpson’s paradox + R / RStudio, R Markdown, simple git Tidy data, data frames vs. summary tables, recoding and transforming, web scraping and iteration + collaboration on GitHub Building & selecting models, visualizing interactions, prediction & validation, inference via simulation Data science ethics, interactive viz & reporting, text analysis, Bayesian inference + communication, dissemination Duke University bit.ly/let-eat-cake-rice
  13. Which of the following is more likely to inspire students

    to want to learn more? Q bit.ly/let-eat-cake-rice
  14. ggplot(data = un_votes_joined, mapping = aes(x = year, y =

    percent_yes, color = country)) + geom_point() + geom_smooth(method = "loess", se = FALSE) + facet_wrap(~ issue) + labs( title = "Percentage of 'Yes' votes in the UN General Assembly", subtitle = "1946 to 2015", y = "% Yes", x = "Year", color = "Country" ) (b) bit.ly/let-eat-cake-rice
  15. ggplot(data = un_votes_joined, mapping = aes(x = year, y =

    percent_yes)) bit.ly/let-eat-cake-rice
  16. ggplot(data = un_votes_joined, mapping = aes(x = year, y =

    percent_yes)) function( arguments ) often a verb what to apply that Verb to bit.ly/let-eat-cake-rice
  17. ggplot(data = un_votes_joined, mapping = aes(x = year, y =

    percent_yes)) rows = observations columns = variables “tidy” data frame bit.ly/let-eat-cake-rice
  18. ggplot(data = un_votes_joined, mapping = aes(x = year, y =

    percent_yes)) + geom_point() bit.ly/let-eat-cake-rice
  19. ggplot(data = un_votes_joined, mapping = aes(x = year, y =

    percent_yes, color = country)) + geom_point() bit.ly/let-eat-cake-rice
  20. ggplot(data = un_votes_joined, mapping = aes(x = year, y =

    percent_yes, color = country)) + geom_point() + geom_smooth(method = "loess", se = FALSE) bit.ly/let-eat-cake-rice
  21. ggplot(data = un_votes_joined, mapping = aes(x = year, y =

    percent_yes, color = country)) + geom_point() + geom_smooth(method = "loess", se = FALSE) + facet_wrap(~ issue) bit.ly/let-eat-cake-rice
  22. ggplot(data = un_votes_joined, mapping = aes(x = year, y =

    percent_yes, color = country)) + geom_point() + geom_smooth(method = "loess", se = FALSE) + facet_wrap(~ issue) + labs( title = "Percentage of 'Yes' votes in the UN General Assembly", subtitle = "1946 to 2015", y = "% Yes", x = "Year", color = "Country" ) bit.ly/let-eat-cake-rice
  23. Which of the following is more likely to be welcoming

    for a wide range of students? Q bit.ly/let-eat-cake-rice
  24. (a) Install R Install RStudio Install the following packages: tidyverse

    rmarkdown … Load these packages Install git (b) Go to rstudio.cloud (or some other server based solution) Log in with your ID & pass > hello R! bit.ly/let-eat-cake-rice
  25. Which of the following is more likely to be motivating

    for a wide range of students? Q bit.ly/let-eat-cake-rice
  26. (a) Topic: Web scraping Tools: rvest regular expressions (b) Today

    we start with this: and end with this: and do so in a way that is easy to replicate for another state bit.ly/let-eat-cake-rice
  27. students will encounter lots of new challenges along the way

    — let that happen, and then provide a solution bit.ly/let-eat-cake-rice
  28. Lesson: Web scraping essentials for turning a structured table into

    a data frame in R. bit.ly/let-eat-cake-rice
  29. Lesson: Web scraping essentials for turning a structured table into

    a data frame in R. Ex 1: Scrape the table off the web and save as a data frame. bit.ly/let-eat-cake-rice
  30. Lesson: Web scraping essentials for turning a structured table into

    a data frame in R. Ex 1: Scrape the table off the web and save as a data frame. Ex 2: What other information do we need represented as variables in the data to obtain the desired facets? bit.ly/let-eat-cake-rice
  31. Lesson: Web scraping essentials for turning a structured table into

    a data frame in R. Ex 1: Scrape the table off the web and save as a data frame. Lesson: “Just enough” string parsing and regular expressions to go from Ex 2: What other information do we need represented as variables in the data to obtain the desired facets? to bit.ly/let-eat-cake-rice
  32. score rank ethnicity gender bty_avg <dbl> <chr> <chr> <chr> <dbl>

    1 4.7 tenure track minority female 5 2 4.1 tenure track minority female 5 3 3.9 tenure track minority female 5 4 4.8 tenure track minority female 5 5 4.6 tenured not minority male 3 6 4.3 tenured not minority male 3 7 2.8 tenured not minority male 3 8 4.1 tenured not minority male 3.33 9 3.4 tenured not minority male 3.33 10 4.5 tenured not minority female 3.17 … … … … … … 463 4.1 tenure track minority female 5.33 evaluation score (1-5) beauty score (1-10) Hamermesh, Parker. “Beauty in the classroom: instructors pulchritude and putative pedagogical productivity”, Econ of Ed Review, Vol 24-4. bit.ly/let-eat-cake-rice
  33. library(tidyverse) library(infer) evals %>% specify(score ~ gender) %>% generate(reps =

    15000, type = "bootstrap") bit.ly/let-eat-cake-rice generate bootstrap samples
  34. library(tidyverse) library(infer) evals %>% specify(score ~ gender) %>% generate(reps =

    15000, type = "bootstrap") %>% calculate(stat = "diff in means", order = c("male", "female")) bit.ly/let-eat-cake-rice calculate sample statistics
  35. library(tidyverse) library(infer) evals %>% specify(score ~ gender) %>% generate(reps =

    15000, type = "bootstrap") %>% calculate(stat = "diff in means", order = c("male", "female")) %>% summarise(l = quantile(stat, 0.025), u = quantile(stat, 0.975)) bit.ly/let-eat-cake-rice summarise CI bounds
  36. library(tidyverse) library(infer) evals %>% specify(score ~ gender) %>% generate(reps =

    15000, type = "bootstrap") %>% calculate(stat = "diff in means", order = c("male", "female")) %>% summarise(l = quantile(stat, 0.025), u = quantile(stat, 0.975)) # l u # 0.0410 0.243 bit.ly/let-eat-cake-rice
  37. bit.ly/let-eat-cake-rice infer.netlify.com The objective of this package is to perform

    statistical inference using an expressive statistical grammar that coheres with the tidyverse design framework. Now part of the tidymodels suite of modeling packages. infer
  38. 1 2 3 4 5 start with cake skip baby

    steps cherish day one hide the veggies focus on exposure bit.ly/let-eat-cake-rice
  39. ) Fine, I’m intrigued, but I need to see the

    big picture bit.ly/let-eat-cake-rice
  40. GAISE 2016 1 NOT a commonly used subset of tests

    and intervals and produce them with hand calculations 2 Multivariate analysis requires the use of computing 3 NOT use technology that is only applicable in the intro course or that doesn’t follow good science principles 4 Data analysis isn’t just inference and modeling, it’s also data importing, cleaning, preparation, exploration, and visualization GAISE 2016, http://www.amstat.org/asa/files/pdfs/GAISE/GaiseCollege_Full.pdf. bit.ly/let-eat-cake-rice
  41. Let them eat cake (first)!* mine-cetinkaya-rundel [email protected] @minebocek * You

    can tell them all about the ingredients later! bit.ly/let-eat-cake-rice bit.ly/repo-eat-cake