Upgrade to Pro — share decks privately, control downloads, hide ads and more …

KubeVirt Observability with Prometheus and Grafana

KubeVirt Observability with Prometheus and Grafana

Ananda Dwi Ae

June 25, 2024
Tweet

More Decks by Ananda Dwi Ae

Other Decks in Technology

Transcript

  1. Goals • Provide leading indicators of an outage or service

    degradation. • Help debug and detect outages, service degradations, bugs, and unauthorized activity. • Identify long-term trends for capacity planning and business purposes. • Expose unexpected side effects of changes
  2. “In control theory, observability is a measure of how well

    internal states of a system can be inferred from knowledge of its external outputs.”
  3. KubeVirt Observability • KubeVirt is an extension of Kubernetes, providing

    a way to run and manage virtual machines (VMs) alongside container workloads. • Observability in KubeVirt involves monitoring, logging, and tracing to ensure the health, performance, and reliability of the VMs and the underlying infrastructure.
  4. Goals Key Metric to Monitor • Latency • Error Rates

    • Resource Utilization • User Activity Implementations • Automated alerts • Dashboard • Regular review
  5. Monitoring • Prometheus: A popular monitoring tool for Kubernetes, Prometheus

    can be configured to scrape metrics from KubeVirt components. ◦ KubeVirt Metrics: KubeVirt exposes metrics that Prometheus can scrape. ◦ All KubeVirt system-components expose Prometheus metrics at their /metrics REST endpoint. • Grafana: For visualization, Grafana can be used to create dashboards based on metrics collected by Prometheus. ◦ Dashboards: Pre-built dashboards can be imported to visualize KubeVirt-specific metrics. • KubeVirt Monitoring Operator: Simplifies the setup of monitoring tools for KubeVirt by providing custom resource definitions (CRDs) to manage monitoring components.
  6. Monitoring Three settings are exposed in the KubeVirt custom resource

    to direct KubeVirt to create these resources correctly: • monitorNamespace: The namespace that prometheus-operator runs in. Defaults to openshift-monitoring. • monitorAccount: The serviceAccount that prometheus-operator runs with. Defaults to prometheus-k8s. • serviceMonitorNamespace: The namespace that the serviceMonitor runs in. Defaults to be monitorNamespace kubevirt_allocatable_nodes The number of allocatable nodes in the cluster. Type: Gauge. kubevirt_api_request_deprecated_total The total number of requests to deprecated KubeVirt APIs. Type: Counter. kubevirt_configuration_emulation_enabled Indicates whether the Software Emulation is enabled in the configuration. Type: Gauge.
  7. Alerting It allows you to create, manage, and execute alerts

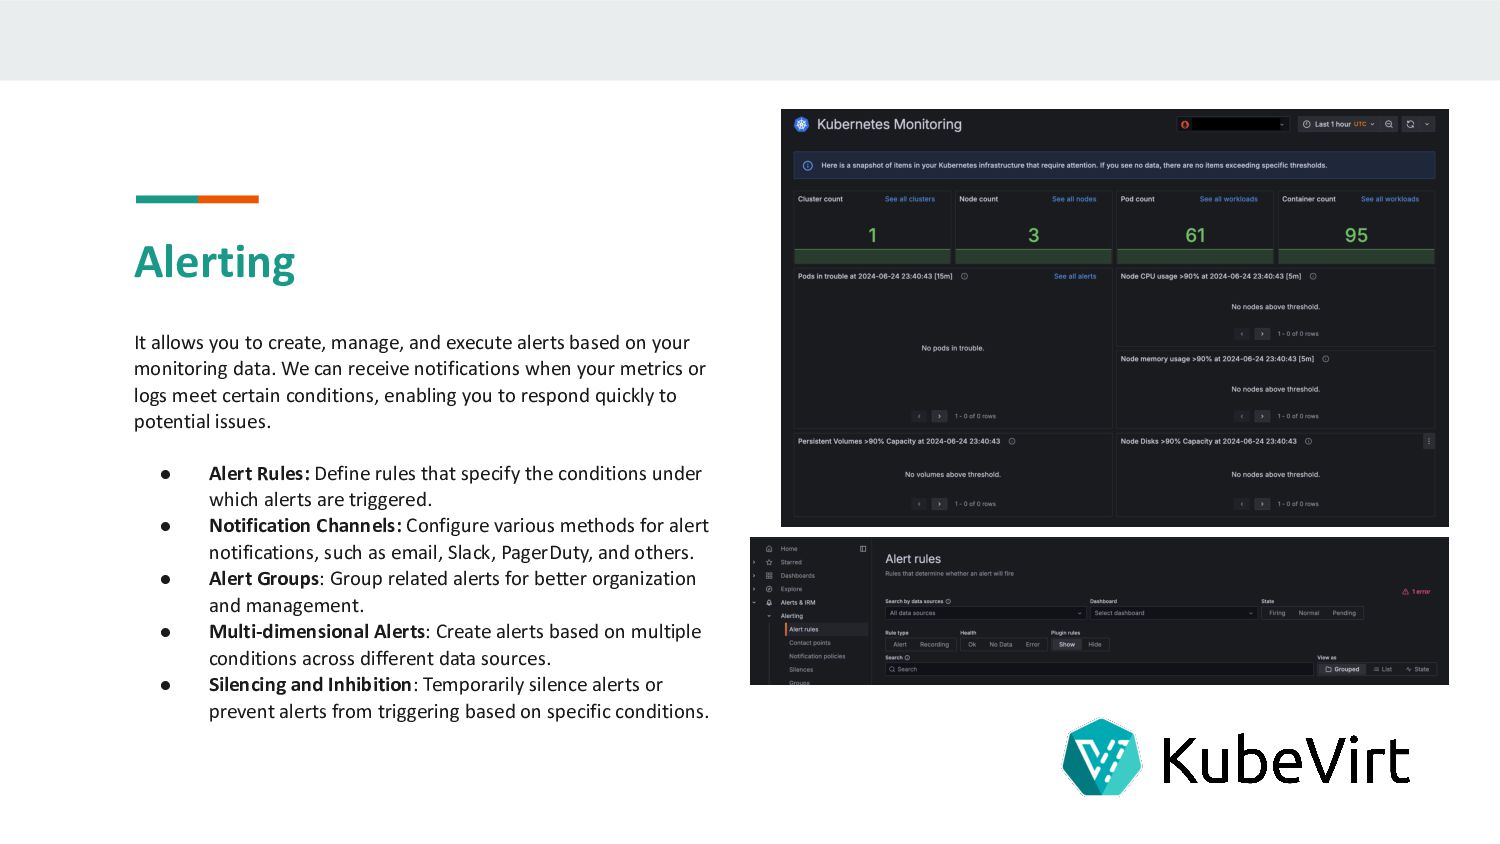
    based on your monitoring data. We can receive notifications when your metrics or logs meet certain conditions, enabling you to respond quickly to potential issues. • Alert Rules: Define rules that specify the conditions under which alerts are triggered. • Notification Channels: Configure various methods for alert notifications, such as email, Slack, PagerDuty, and others. • Alert Groups: Group related alerts for better organization and management. • Multi-dimensional Alerts: Create alerts based on multiple conditions across different data sources. • Silencing and Inhibition: Temporarily silence alerts or prevent alerts from triggering based on specific conditions.
  8. Tools and Challenges • Want to be able to get

    a 360∘ view of a problem • Need to correlate logs, metrics and traces to get deeper insights • Repetitive troubleshooting process • Data introspection
  9. References • https://kubevirt.io/user-guide/architecture/ • https://github.com/kubevirt/monitoring • https://github.com/prometheus-community/helm-charts • https://github.com/kubevirt/monitoring/blob/main/dashboards/grafana/kubevirt-control-plane.js on

    • https://kubevirt.io/2019/An-overview-to-KubeVirt-metrics.html • https://github.com/enp0s3/kubevirt-monitoring-operator • https://github.com/kubevirt/kubevirt-tutorial/tree/main