Upgrade to Pro — share decks privately, control downloads, hide ads and more …

Monitoring Kubernetes at Scale

Monitoring Kubernetes at Scale

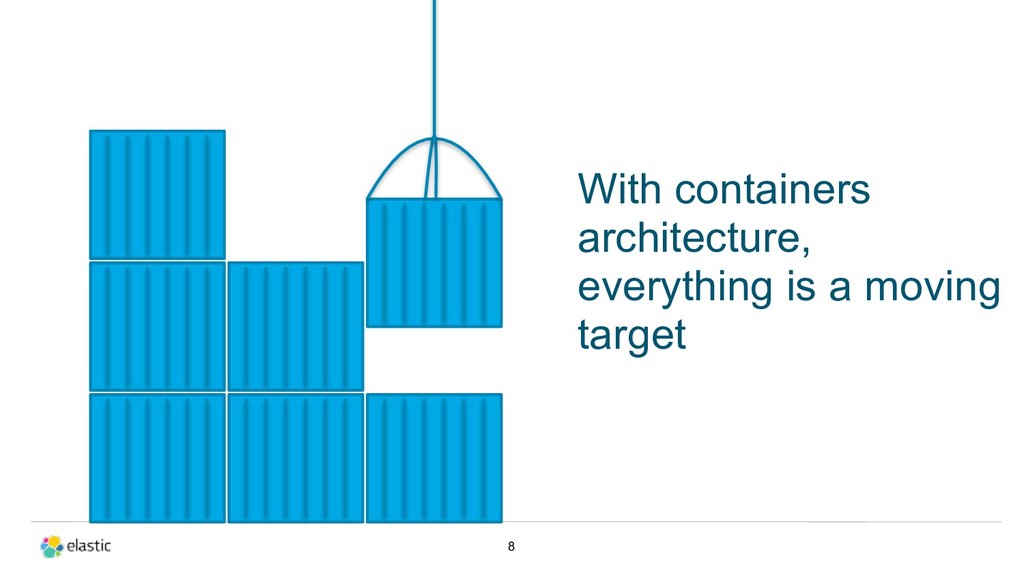
Kubernetes is changing the game in the data centre, but also in the monitoring and troubleshooting landscape. Static tools and vertically scalable TSDBs are no longer fit for the job. Large-scale dynamic infrastructures require scalable dynamic monitoring.
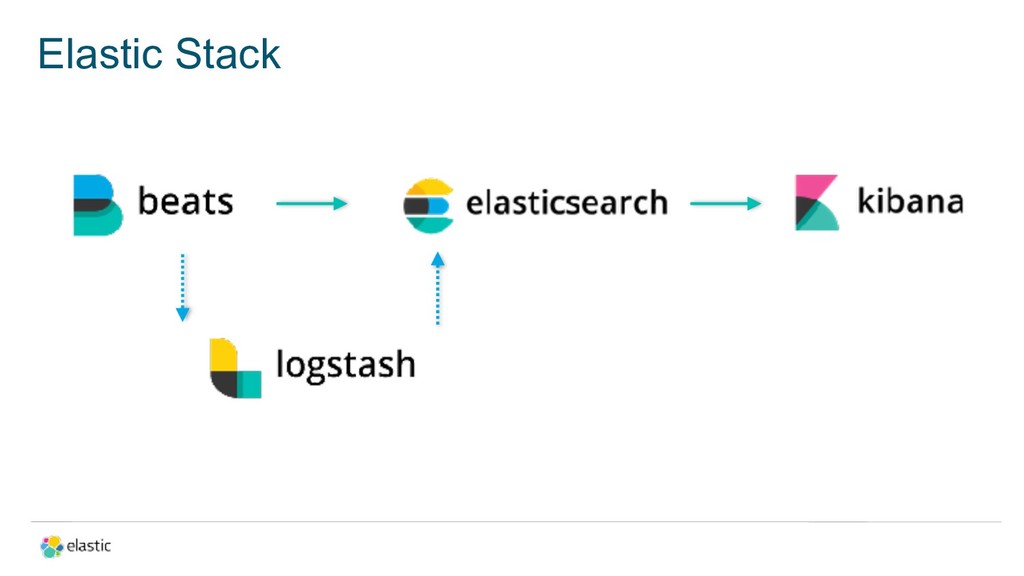
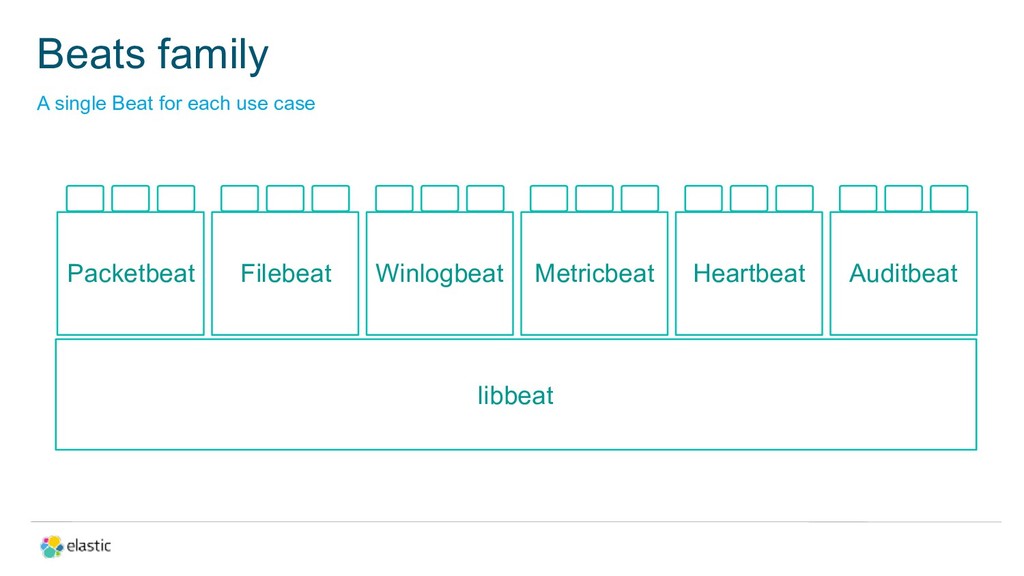
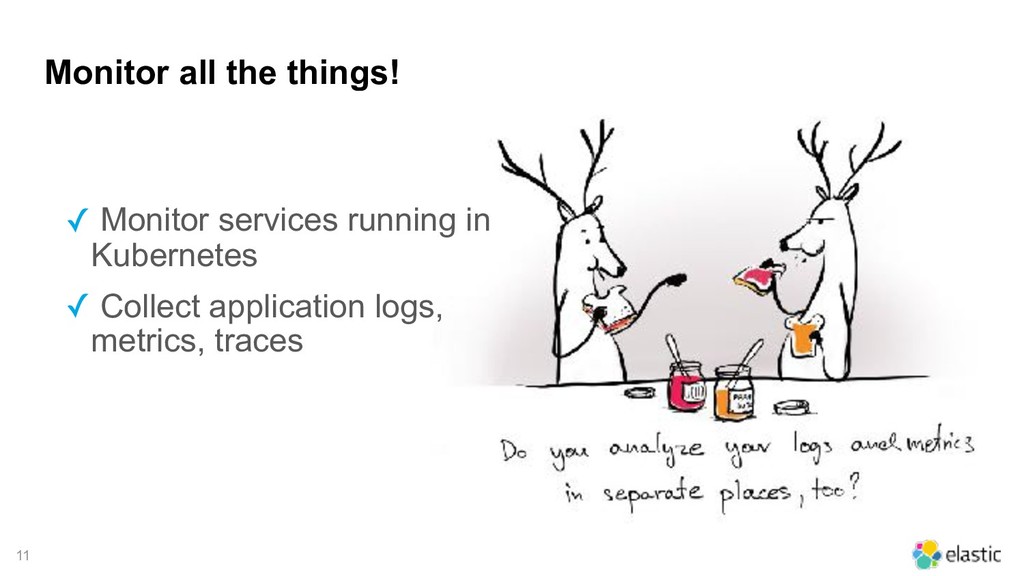
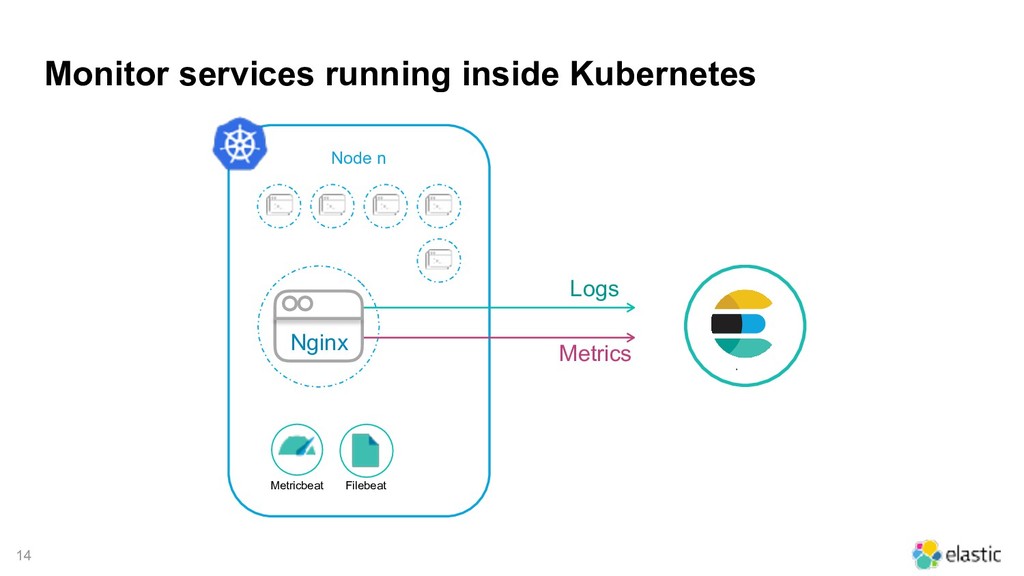
This talk presents how the Elastic Stack collects logs, metrics, and APM traces from the applications running in Kubernetes:
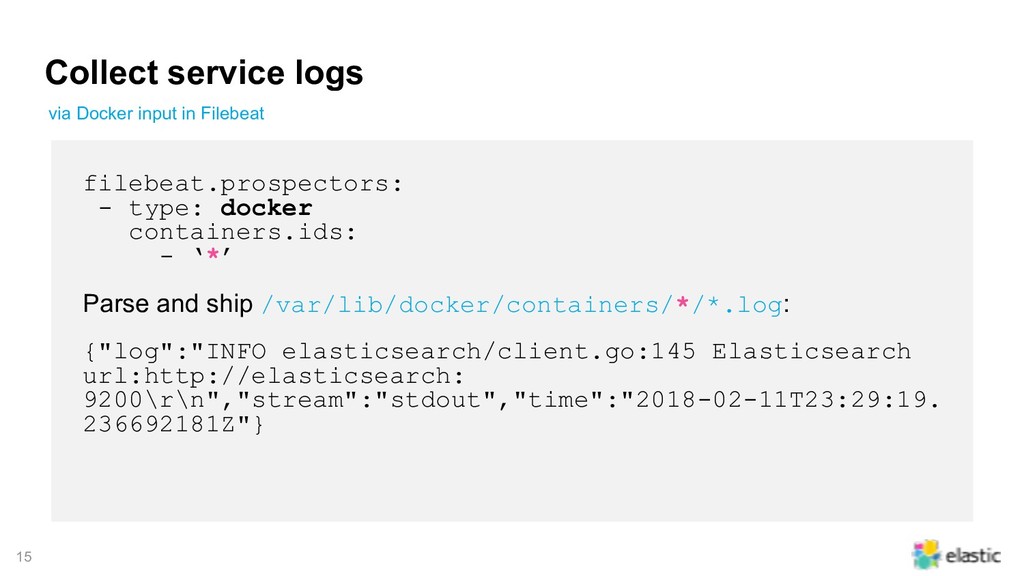
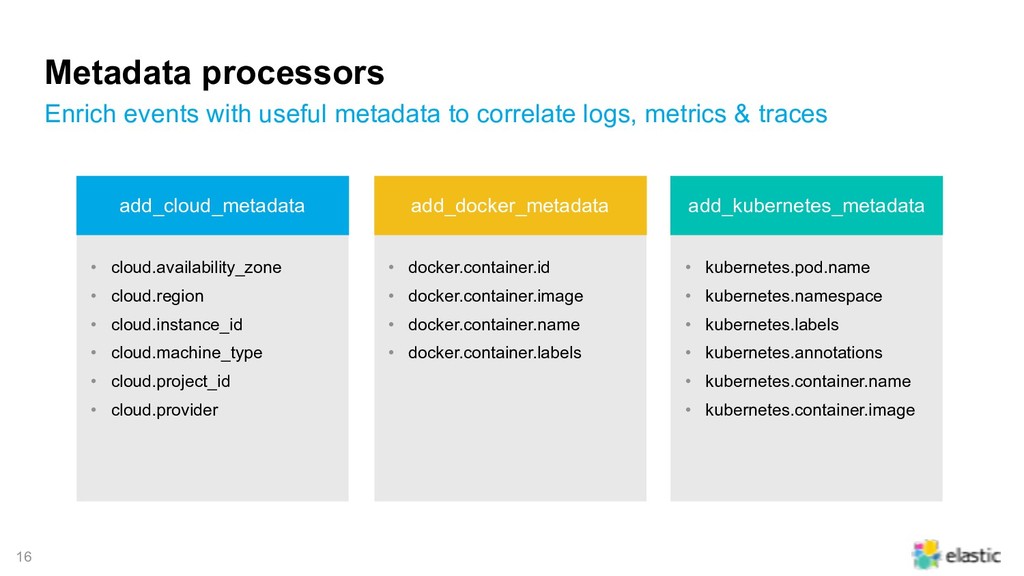
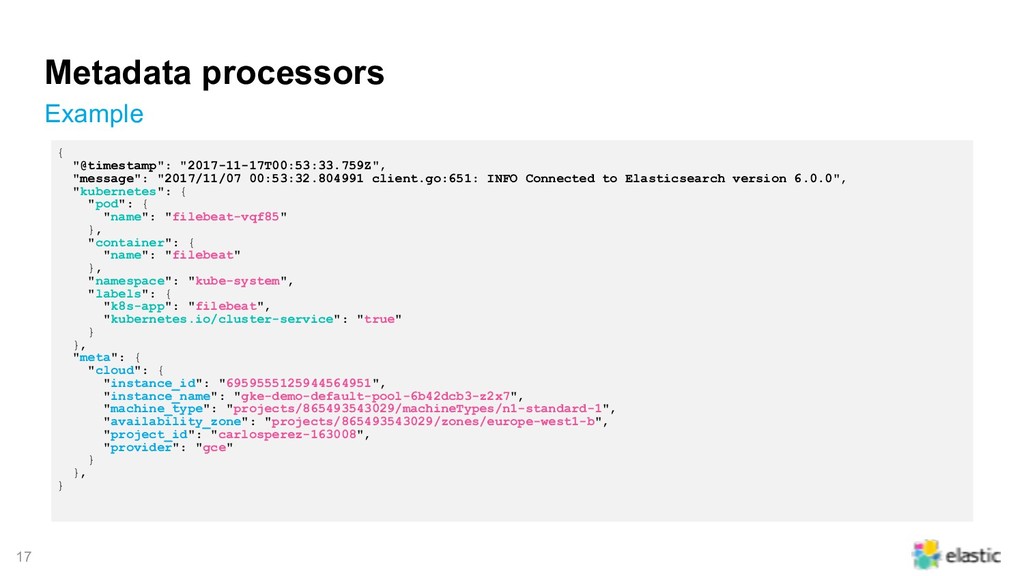
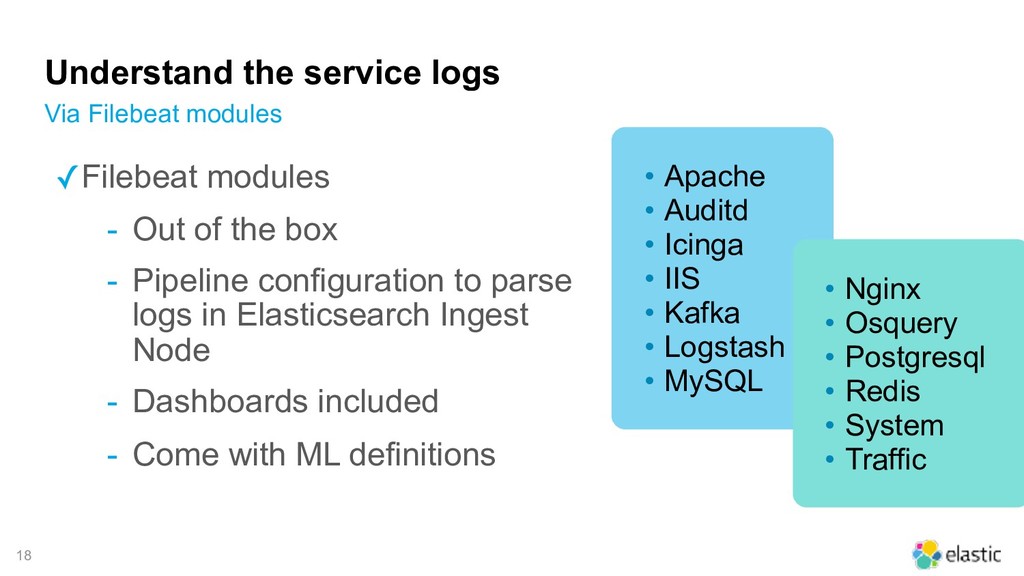
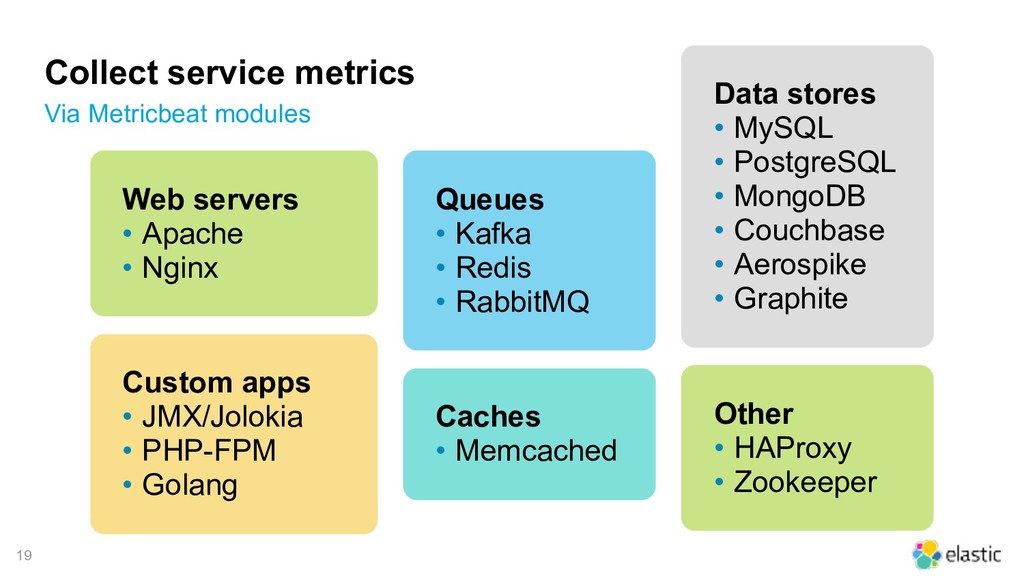
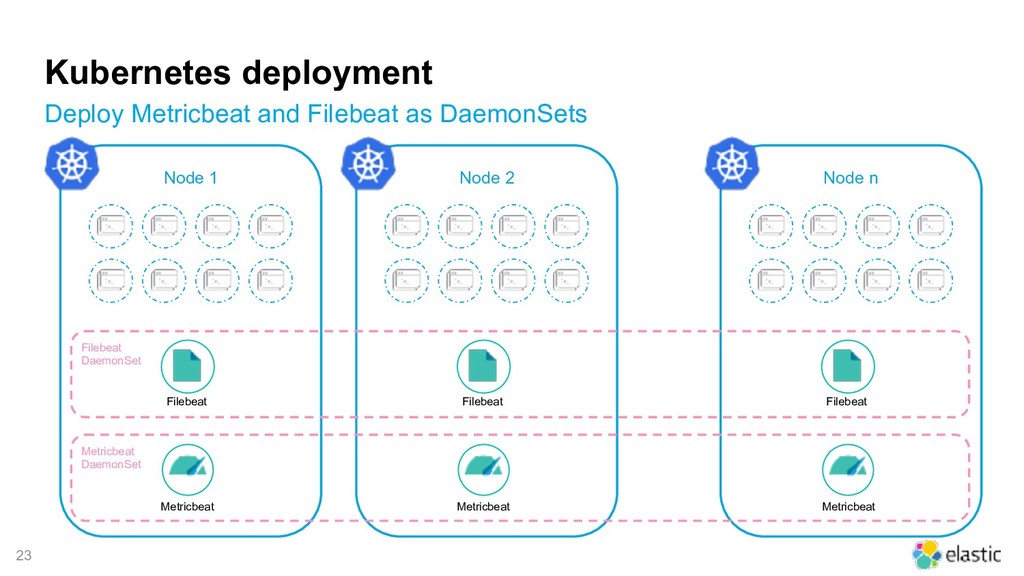
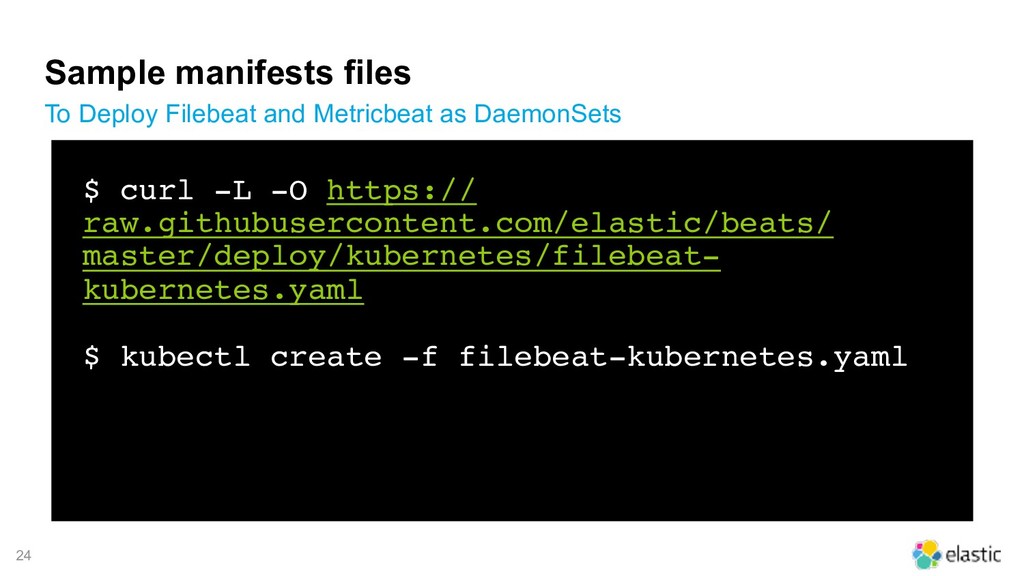
– Collect application logs, metrics and enhance them with Kubernetes metadata
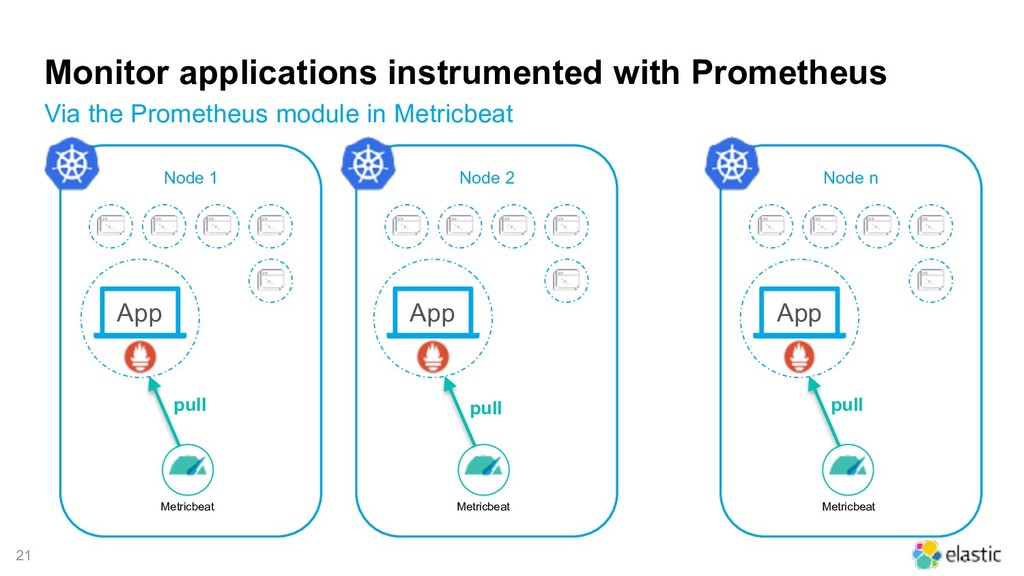
– Collect application metrics from Prometheus endpoints
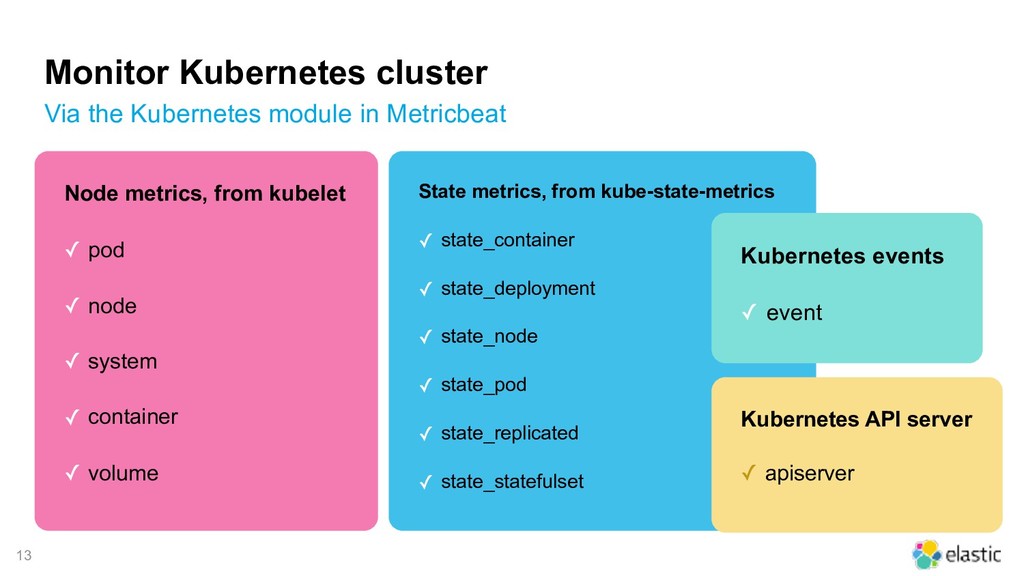
– Collect Kubernetes metrics
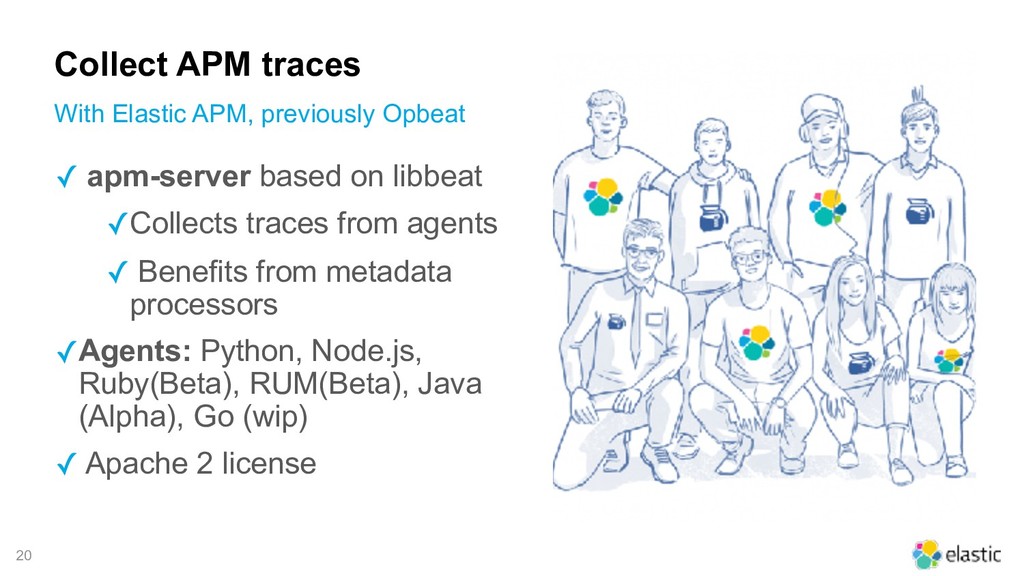
– Collect application performance traces (APM)
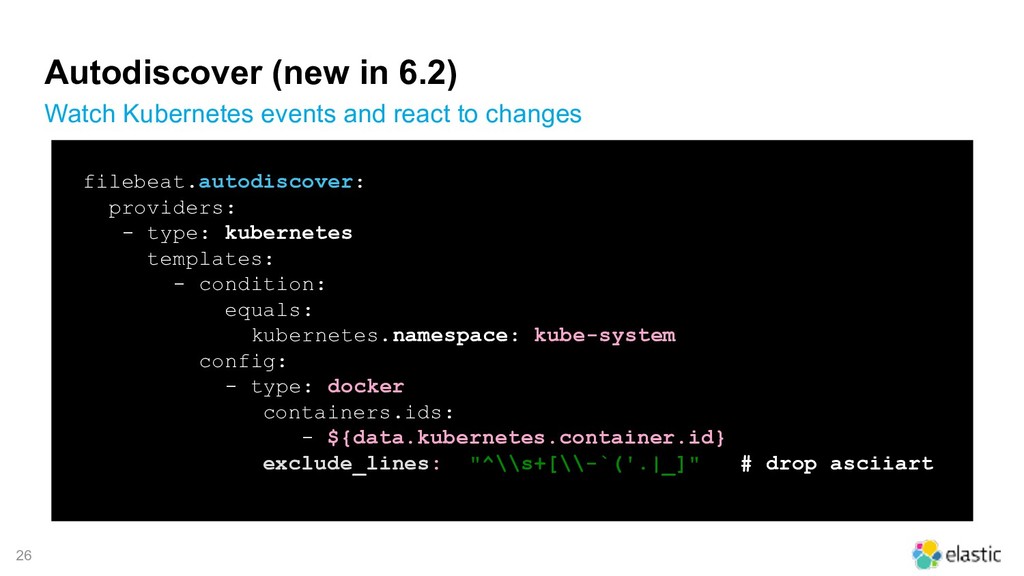
– Autodiscover new pods and monitor them based on their type
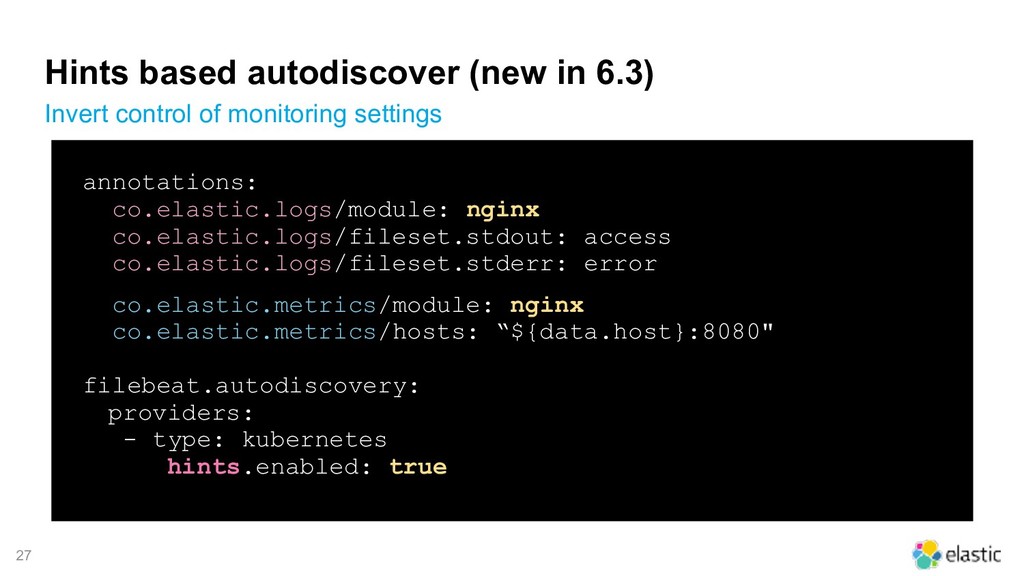
– Control the monitoring via Kubernetes annotations
– Use Kibana as a single looking glass to visualize the collected data

Monica Sarbu

June 12, 2018
Tweet

More Decks by Monica Sarbu

Other Decks in Technology

Transcript

  1. A single Beat for each use case Beats family libbeat

    Packetbeat Filebeat Winlogbeat Metricbeat Heartbeat Auditbeat
  2. !6

  3. !10

  4. !11 Monitor all the things! ✓ Monitor services running in

    Kubernetes ✓ Collect application logs, metrics, traces
  5. !13 Monitor Kubernetes cluster Via the Kubernetes module in Metricbeat

    Node metrics, from kubelet ✓ pod ✓ node ✓ system ✓ container ✓ volume State metrics, from kube-state-metrics ✓ state_container ✓ state_deployment ✓ state_node ✓ state_pod ✓ state_replicated ✓ state_statefulset Kubernetes events ✓ event Kubernetes API server ✓ apiserver
  6. !15 Collect service logs filebeat.prospectors: - type: docker containers.ids: -

    ‘*’ Parse and ship /var/lib/docker/containers/*/*.log: {"log":"INFO elasticsearch/client.go:145 Elasticsearch url:http://elasticsearch: 9200\r\n","stream":"stdout","time":"2018-02-11T23:29:19. 236692181Z"} via Docker input in Filebeat
  7. !16 Metadata processors Enrich events with useful metadata to correlate

    logs, metrics & traces • cloud.availability_zone • cloud.region • cloud.instance_id • cloud.machine_type • cloud.project_id • cloud.provider • docker.container.id • docker.container.image • docker.container.name • docker.container.labels • kubernetes.pod.name • kubernetes.namespace • kubernetes.labels • kubernetes.annotations • kubernetes.container.name • kubernetes.container.image add_cloud_metadata add_docker_metadata add_kubernetes_metadata
  8. !17 Metadata processors Example { "@timestamp": "2017-11-17T00:53:33.759Z", "message": "2017/11/07 00:53:32.804991

    client.go:651: INFO Connected to Elasticsearch version 6.0.0", "kubernetes": { "pod": { "name": "filebeat-vqf85" }, "container": { "name": "filebeat" }, "namespace": "kube-system", "labels": { "k8s-app": "filebeat", "kubernetes.io/cluster-service": "true" } }, "meta": { "cloud": { "instance_id": "6959555125944564951", "instance_name": "gke-demo-default-pool-6b42dcb3-z2x7", "machine_type": "projects/865493543029/machineTypes/n1-standard-1", "availability_zone": "projects/865493543029/zones/europe-west1-b", "project_id": "carlosperez-163008", "provider": "gce" } }, }
  9. !18 Understand the service logs Via Filebeat modules • Apache

    • Auditd • Icinga • IIS • Kafka • Logstash • MySQL • Nginx • Osquery • Postgresql • Redis • System • Traffic ✓Filebeat modules - Out of the box - Pipeline configuration to parse logs in Elasticsearch Ingest Node - Dashboards included - Come with ML definitions
  10. !19 Collect service metrics Via Metricbeat modules Data stores •

    MySQL • PostgreSQL • MongoDB • Couchbase • Aerospike • Graphite Queues • Kafka • Redis • RabbitMQ Caches • Memcached Custom apps • JMX/Jolokia • PHP-FPM • Golang Web servers • Apache • Nginx Other • HAProxy • Zookeeper
  11. !20 Collect APM traces With Elastic APM, previously Opbeat ✓

    apm-server based on libbeat ✓Collects traces from agents ✓ Benefits from metadata processors ✓Agents: Python, Node.js, Ruby(Beta), RUM(Beta), Java (Alpha), Go (wip) ✓ Apache 2 license
  12. !21 Monitor applications instrumented with Prometheus Via the Prometheus module

    in Metricbeat Node 1 Metricbeat Node 2 Metricbeat Node n Metricbeat App App App pull pull pull
  13. !23 Kubernetes deployment Deploy Metricbeat and Filebeat as DaemonSets Node

    1 Metricbeat Filebeat Node 2 Metricbeat Filebeat Node n Metricbeat Filebeat Filebeat DaemonSet Metricbeat DaemonSet
  14. !24 Sample manifests files To Deploy Filebeat and Metricbeat as

    DaemonSets $ curl -L -O https:// raw.githubusercontent.com/elastic/beats/ master/deploy/kubernetes/filebeat- kubernetes.yaml $ kubectl create -f filebeat-kubernetes.yaml
  15. !26 Autodiscover (new in 6.2) Watch Kubernetes events and react

    to changes filebeat.autodiscover: providers: - type: kubernetes templates: - condition: equals: kubernetes.namespace: kube-system config: - type: docker containers.ids: - ${data.kubernetes.container.id} exclude_lines: ["^\\s+[\\-`('.|_]"] # drop asciiart
  16. !27 Hints based autodiscover (new in 6.3) Invert control of

    monitoring settings annotations: co.elastic.logs/module: nginx co.elastic.logs/fileset.stdout: access co.elastic.logs/fileset.stderr: error co.elastic.metrics/module: nginx co.elastic.metrics/hosts: “${data.host}:8080" filebeat.autodiscovery: providers: - type: kubernetes hints.enabled: true