Upgrade to Pro — share decks privately, control downloads, hide ads and more …

Monitor your infrastructure with the Elastic Beats

Monica Sarbu
November 30, 2016

Monitor your infrastructure with the Elastic Beats

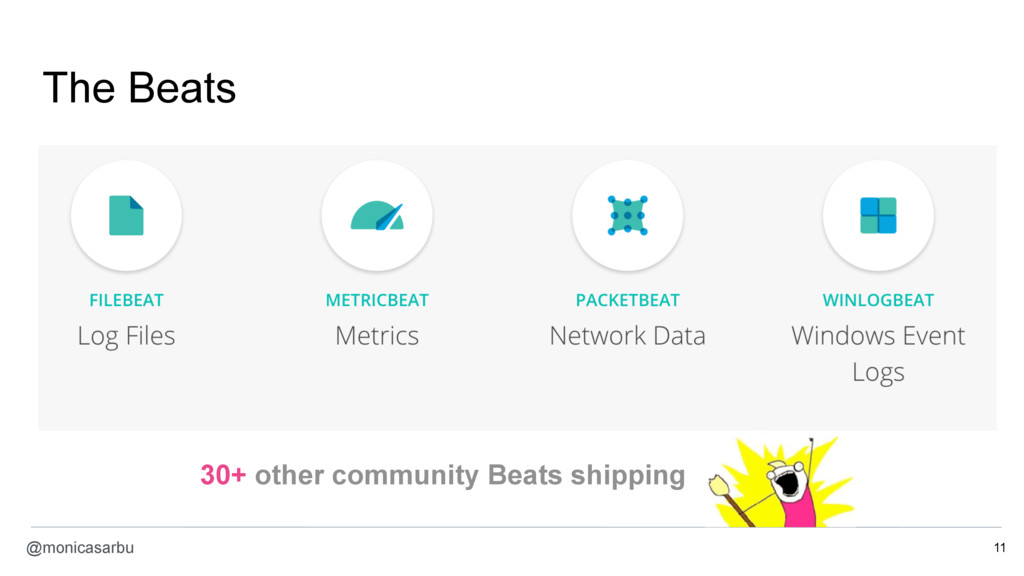
Monitor your Infrastructure with Elastic Beats
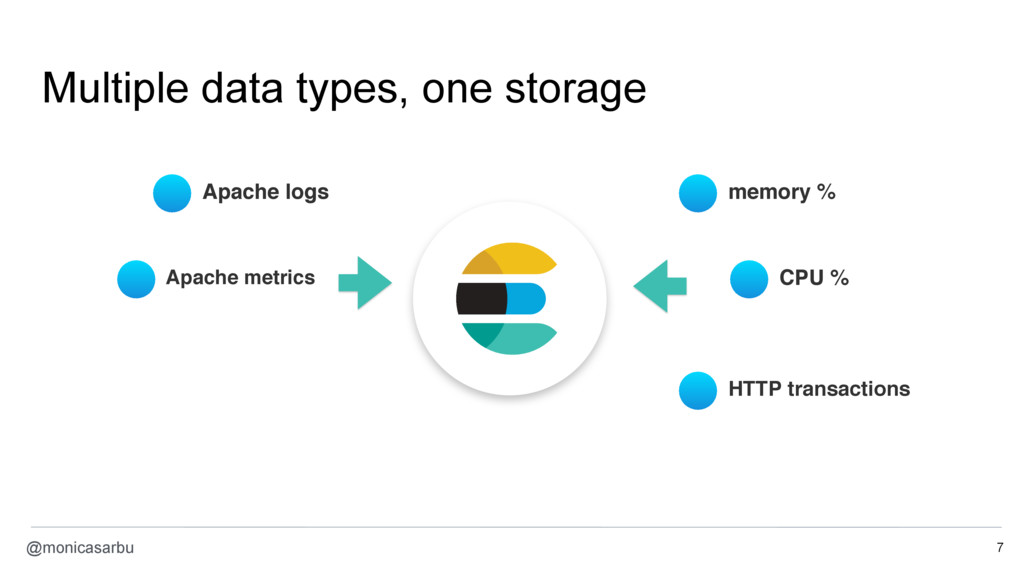
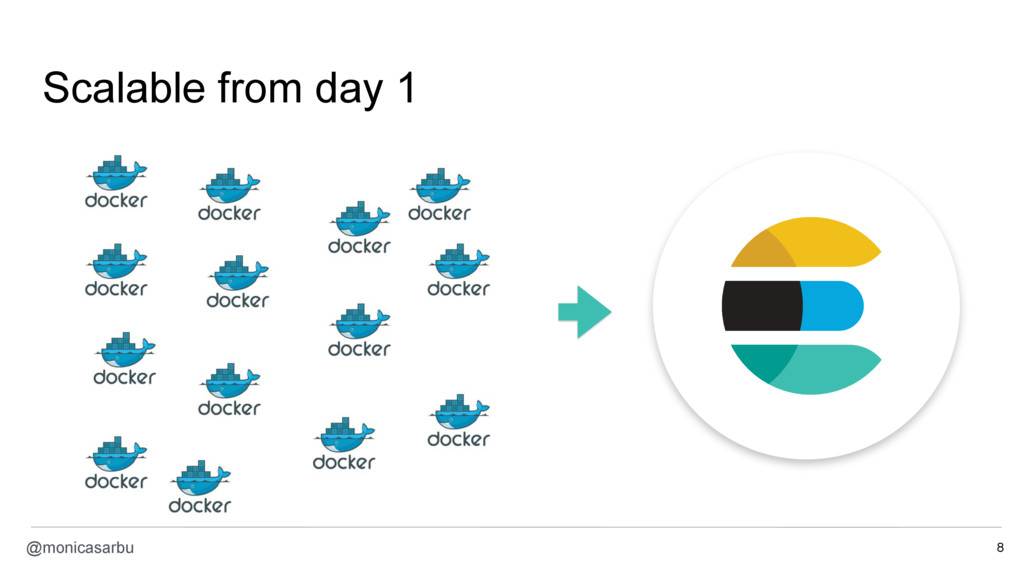
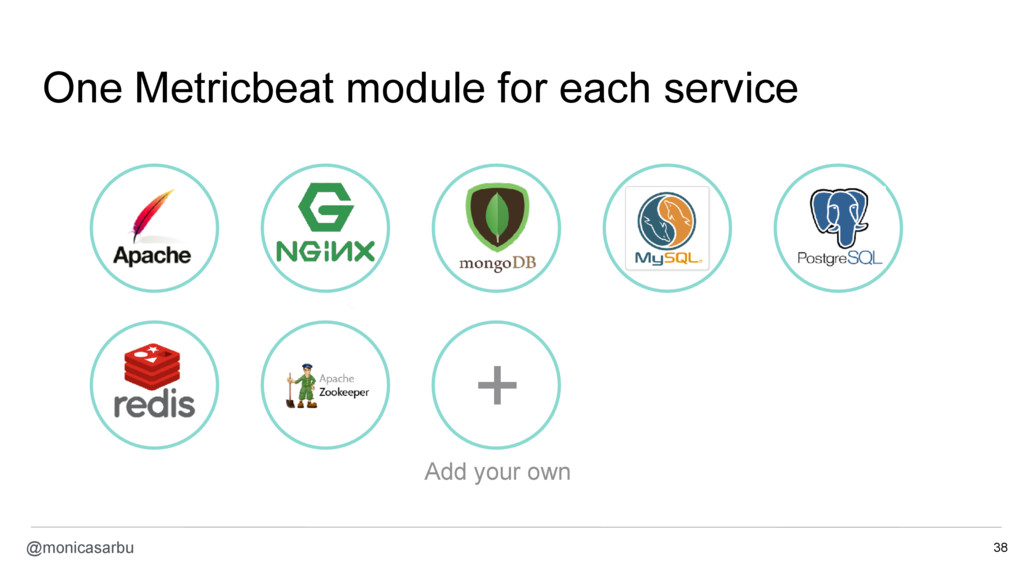
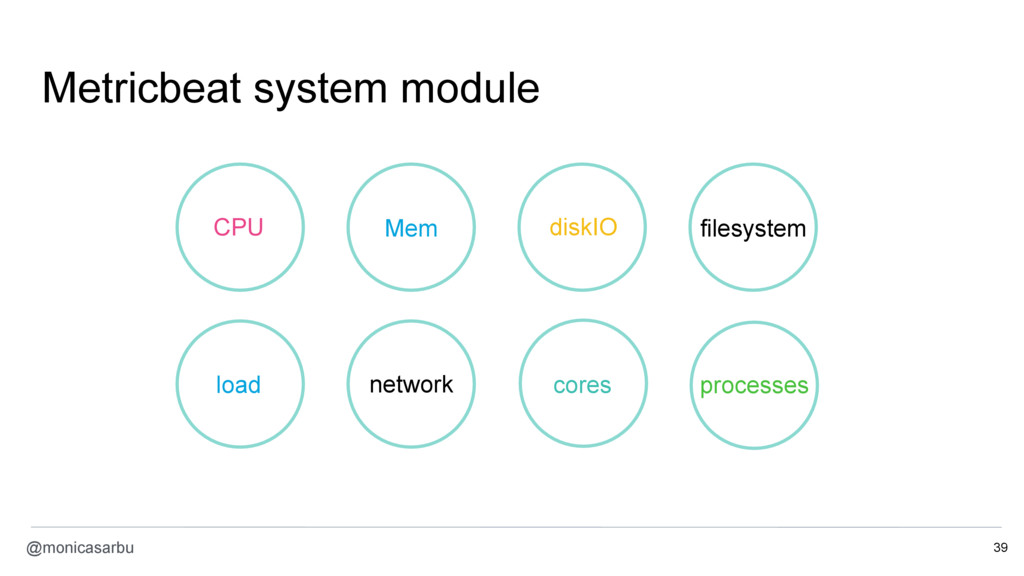
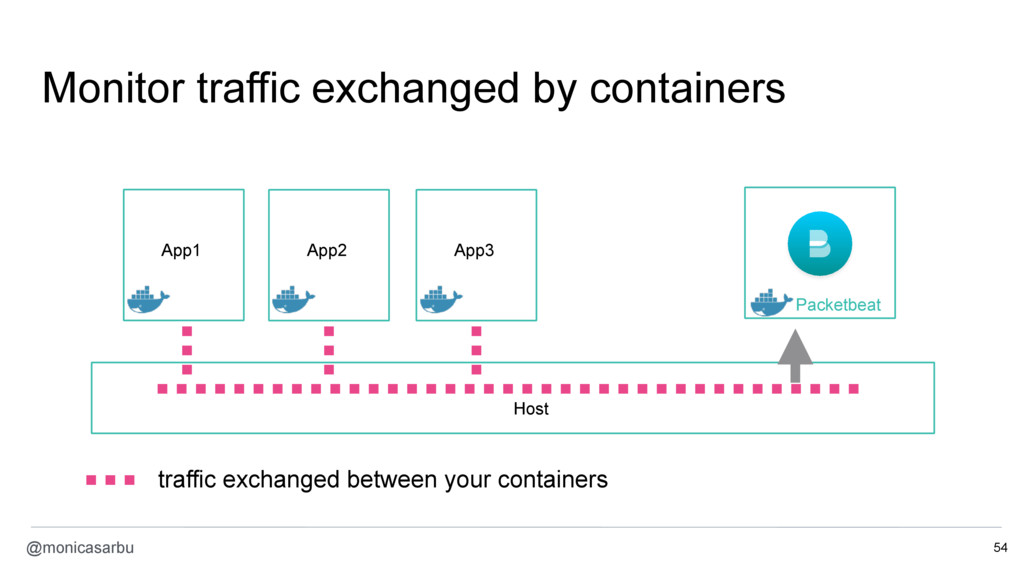
The Beats are a friendly army of lightweight agents that, installed on your servers, capture operational data and ship it to Elasticsearch for analysis. They collect the logs from your servers, get system statistics like CPU, memory, disk usage, gather metrics by interrogating periodically external systems like MySQL, Docker, Zookeeper and give you visibility into your network by sniffing the traffic exchanged between your servers.

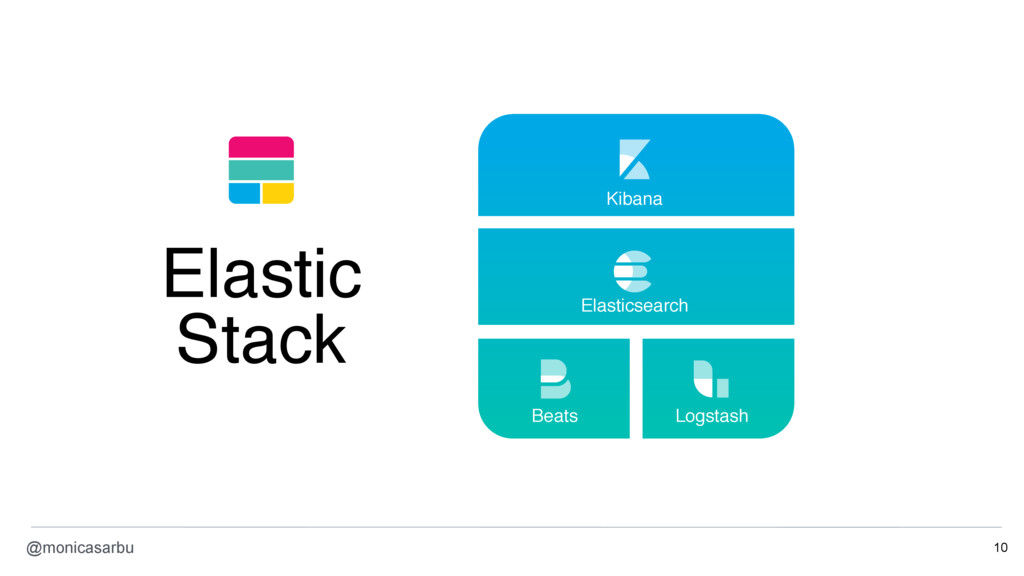
This talk shows how to combine the Beats with Elasticsearch and Kibana in one complete open source monitoring solution that helps you monitor and troubleshoot your distributed infrastructure.

Monica Sarbu

November 30, 2016
Tweet

More Decks by Monica Sarbu

Other Decks in Technology

Transcript

  1. @monicasarbu After parsing 20 { message: “55.3.244.1 GET /index.html 15824

    0.043” client: “55.3.244.1”, method: “GET”, request: “/index.html” bytes: 15824, duration: 0.043 … }
  2. @monicasarbu When next stage is down … • Filebeat patiently

    waits • Log lines are not lost • It doesn’t allocate memory • It doesn’t buffer log lines on disk 25
  3. #velo @monicasarbu 28 batch of messages ack batch of messages

    same batch of messages ack duplicates! 28
  4. @monicasarbu 001 Gelf driver + Logstash Pros: • logs send

    directly to Logstash 31 Cons: • UDP based, no delivery guarantees, no congestion control
  5. @monicasarbu 010 json-file driver + Filebeat Pros: • Simple to

    setup as it’s the default driver • Easy to add container metadata (name, labels, etc.) • `docker logs` works 32 Cons: • json-file driver can slow down Docker container
  6. @monicasarbu 011 Syslog driver + Syslog server + Filebeat Pros:

    • Good control over the path where the files are written, rotation strategies, etc. 33 Cons: • you need to manage the syslog server • metadata is serialized as string, needs to be de- serialized again • multiline is difficult because data from containers can be mixed
  7. @monicasarbu 100 Journald driver + Filebeat Pros: • journald is

    often already available • convenient support for container metadata (name, labels, etc.) • `docker logs` works 34 Cons: • Filebeat doesn’t yet support journald • You can use the community Beat, Journalbeat
  8. @monicasarbu 101 Shared volume + Filebeat Pros: • If your

    app can rotate it’s own logs, it’s very easy to setup • Scales well 35 Cons: • Difficult to pass container metadata (name, labels, etc.)
  9. @monicasarbu Conclusion “At-least-once” guarantees and handle back-pressure: • json-file driver

    + Filebeat • Syslog driver + Filebeat • Shared volume + Filebeat • Journald driver + Filebeat (in the future) 36 No guarantees: • Gelf driver + Logstash • Fluentd driver + Logstash
  10. @monicasarbu Querying the Docker API • CPU and memory •

    Docker container information • network (in/out bytes, dropped) • diskIO (reads/writes) • status of containers (# of stopped, running, etc) 41
  11. @monicasarbu Docker module in Metricbeat • Get container metrics by

    querying the Docker API • Has access to container names and labels • Easy to setup 42 in progress
  12. @monicasarbu Reading cgroup data from /proc/ • Doesn’t require access

    to the Docker API (can be a security issue) • Works for any container runtime (Docker, rkt, runC, LXD, etc.) • Cannot get the container name and labels only the container ID 43
  13. @monicasarbu System module + cgroup data • if cgroup option

    is enabled (by default is disabled) • Automatically enhances process data with cgroup information 44
  14. #velo @monicasarbu Elasticsearch BKD trees 47 • Added for Geo-points

    • faster to index • faster to query • more disk-efficient • more memory efficient
  15. @monicasarbu 0 10000 20000 30000 40000 50000 60000 70000 80000

    float half float scaled float (factor = 4000) scaled float (factor = 100) On Disk Usage in kb Points disk usage (kb) docs_values disk usage (kb) Float values 48 • half floats • scaled floats (using a scaling factor) - great for things like percentage points
  16. #velo @monicasarbu Why Elasticsearch for time series • Horizontal scalability.

    Mature and battle tested cluster support. • Flexible aggregations (incl moving averages & Holt Winters) • One system for both logs and metrics • Timelion UI, Grafana • Great ecosystem: e.g. alerting tools 49
  17. @monicasarbu How Packetbeat works 51 1 2 3 4 capture

    network traffic decodes network traffic correlates request & response into transactions send transactions to Elasticsearch
  18. @monicasarbu Unknown traffic, use flows •Look into data for which

    we don’t understand the application layer protocol •TLS •Protocols we don’t yet support •Get data about IP / TCP / UDP layers •number of packets & bytes •retransmissions •inter-arrival time 53
  19. @monicasarbu Monitor traffic exchanged by containers 54 App1 Host App2

    App3 Packetbeat traffic exchanged between your containers