Upgrade to Pro — share decks privately, control downloads, hide ads and more …

Collecting the right data to monitor your infrastructure

Collecting the right data to monitor your infrastructure

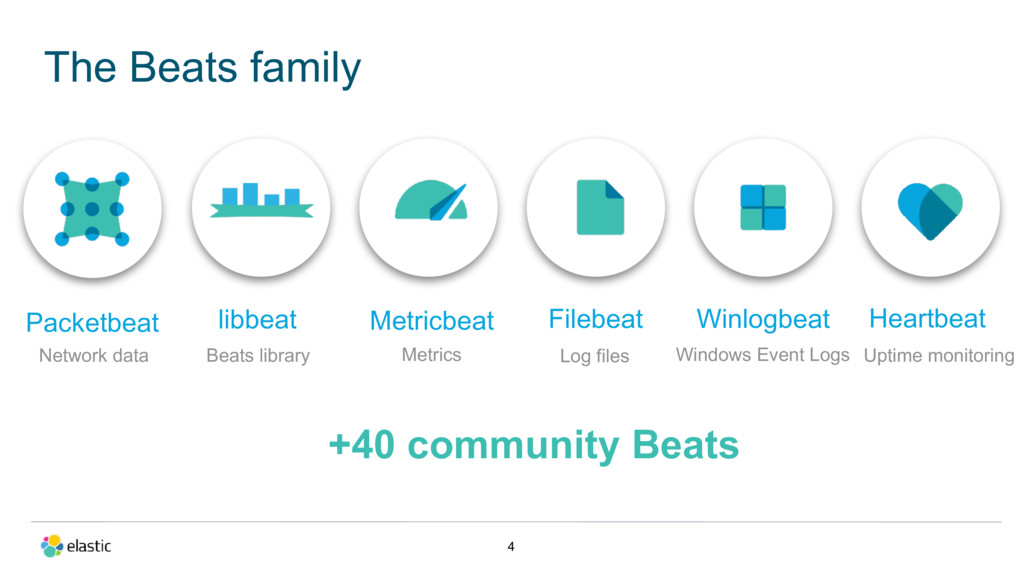
In the world of containers and microservices, where your infrastructure consists of thousands of containers that are changing continuously, monitoring your infrastructure become a challenge. At the beginning, you collect the logs from all your servers to help you understand when there is a failure in your system, but logs are not always available, think of when the service is down. To prevent a failure, you would need to monitor the status of your services, and the health of the server where the service is running. In a distributed environment where the microservices communicate between them via APIs, it’s important to be able to visualize the traffic exchanged between your microservices for troubleshooting purposes. This talk will present how you can use the open source tools and in particular the Elastic Beats to offer a broad visibility into your network by collecting different kinds of operational data from all your services into a central point in Elasticsearch, and then build Dashboards with Kibana.

Monica Sarbu

May 17, 2017
Tweet

More Decks by Monica Sarbu

Other Decks in Technology

Transcript

  1. 2 About me Monica Sarbu Team lead, Beats Working at

    Elastic for 2 years Building monitoring tools for 10+ years Likes traveling Starting Beats 4 years ago Enjoys writing code @monicasarbu
  2. Beats is a family of lightweight shippers that collect and

    ship all kinds of operational data to Elasticsearch
  3. The Beats family 4 Packetbeat Network data libbeat Beats library

    Filebeat Log files Winlogbeat Windows Event Logs Heartbeat Uptime monitoring +40 community Beats Metricbeat Metrics
  4. Beats, multiple use cases Se Security Uptime monitoring Service monitoring

    Application monitoring System monitoring Network monitoring
  5. Application logs • install Filebeat on the application servers to

    forward the logs in a raw format • easy when application writes logs in json format, otherwise it requires log parsing • Parsing can be done with Ingest Node plugin of Elasticsearch or Logstash by defining Grok patterns
  6. Application metrics • Logs can be a source of metrics

    • instrument your application to get metrics
  7. 12

  8. Application running in Kubernetes • Each Beat can use the

    kubernetes processor to enrich events with metadata coming from the Kubernetes Pod from which the event originated like: pod name, namespace, labels
  9. Application running in Cloud • Each Beat can use the

    add_cloud_metadata processor to add cloud metadata in the exported events
  10. Service logs • out-of-the-box experience with Filebeat modules $ filebeat

    -setup -modules=apache2 $ filebeat -setup -modules=apache2,nginx
  11. Service metrics • using Metricbeat modules MySQL Memcache PHP-FPM CEPH

    Zoo keeper Docker Apache Kafka HAProxy HTTP Redis Couchbase NGINX Postgres Kubernetes Vsphere Dropwizard
  12. Docker metrics • use Metricbeat to collect metrics about your

    Docker containers either interrogating directly the Docker API or using cgroup.
  13. Kubernetes metrics • use the kubernetes module in Metricbeat to

    get details about the running containers and the available pods
  14. System metrics • collect periodically metrics by installing Metricbeat on

    your system • Metricbeat system module: - CPU usage - Load - Memory usage - Desk IO - Filesystem - Network stats - Per process information - Per core information
  15. Monitor traffic exchanged between servers • by installing Packetbeat on

    your servers, you can decode the messages exchanged between them http mysql redis
  16. Heartbeat - Ping all the things 33 host Your app

    OS TCP/TLS connect ICMP ping HTTP/S request
  17. • Round Trip Times: • dns_resolve • icmp • tcp_connect

    • socks5_connect • tls_handshake • http Heartbeat metrics 34
  18. auth logs • SSH logins (password or publickey, IP, GeoIP)

    • failed sudo attempts • useradd / groupadd
  19. 37

  20. 39

  21. DNS tunneling • Packetbeat monitors the DNS traffic to look

    for a high number of unique hostnames for a domain https://www.elastic.co/blog/detecting_dns_tunnels_with_packetbeat_and_watcher