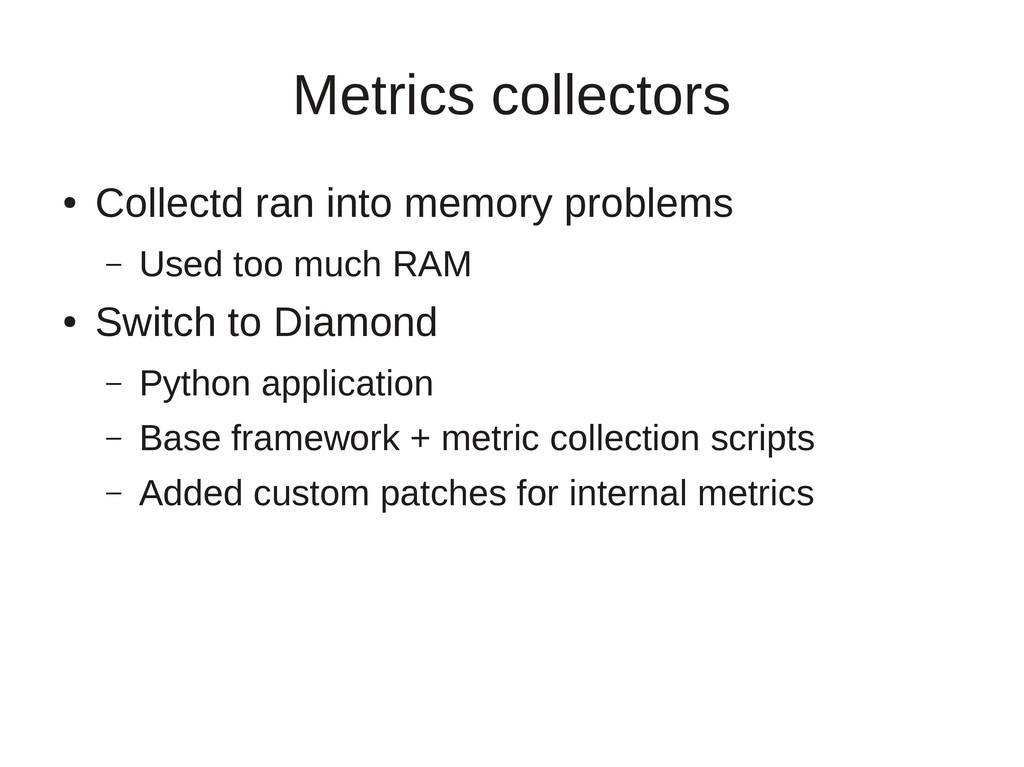
for time series data series plots. • Written in Python • Consists of multiple separate daemons • Has it's own storage backend – Like RRD, but with more features
– Web frontend, and API provider • Relaying daemons – Event based daemons – Matches input based on name – Relays to one or more destinations based on rules or hashing
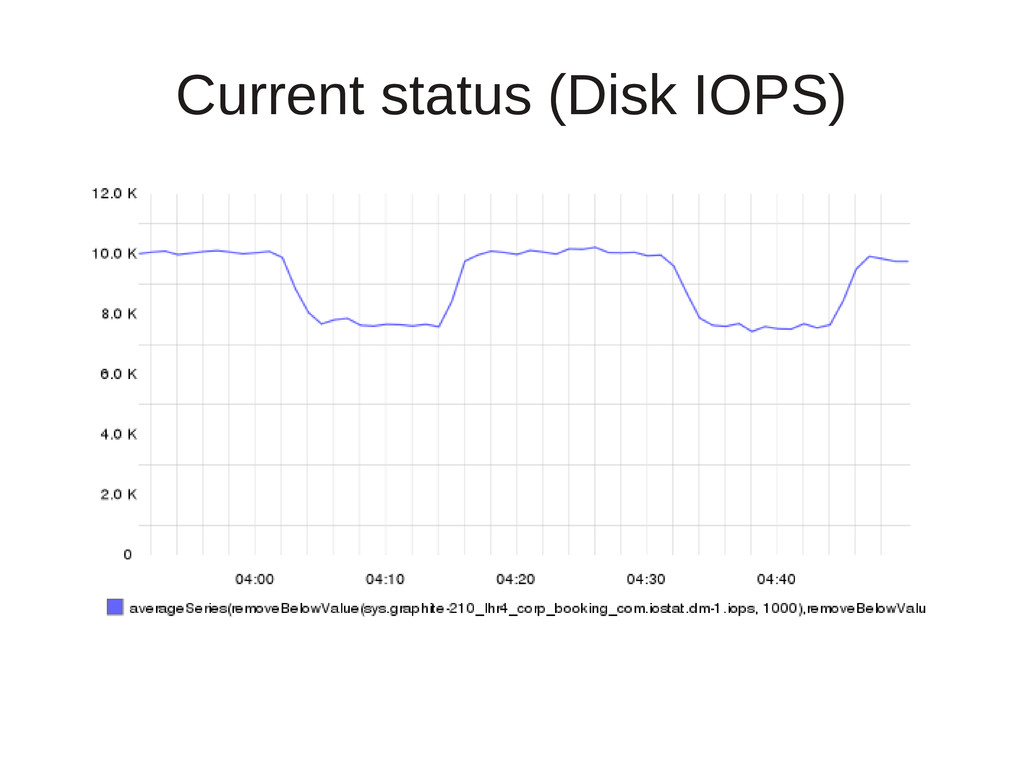
planning to grow slowly • RAID 1+0 spinning disk setup – It works for our databases • Ran into the IO wall – Spinning rust sucks at IO – Whisper updates force crazy seek patterns
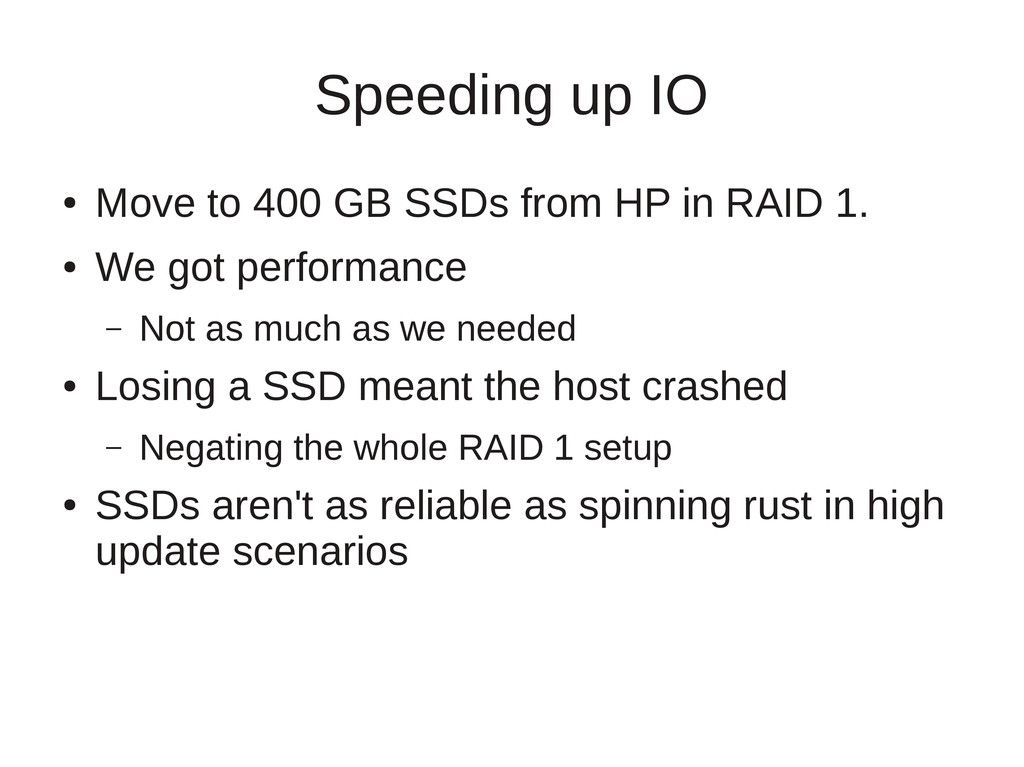
HP in RAID 1. • We got performance – Not as much as we needed • Losing a SSD meant the host crashed – Negating the whole RAID 1 setup • SSDs aren't as reliable as spinning rust in high update scenarios
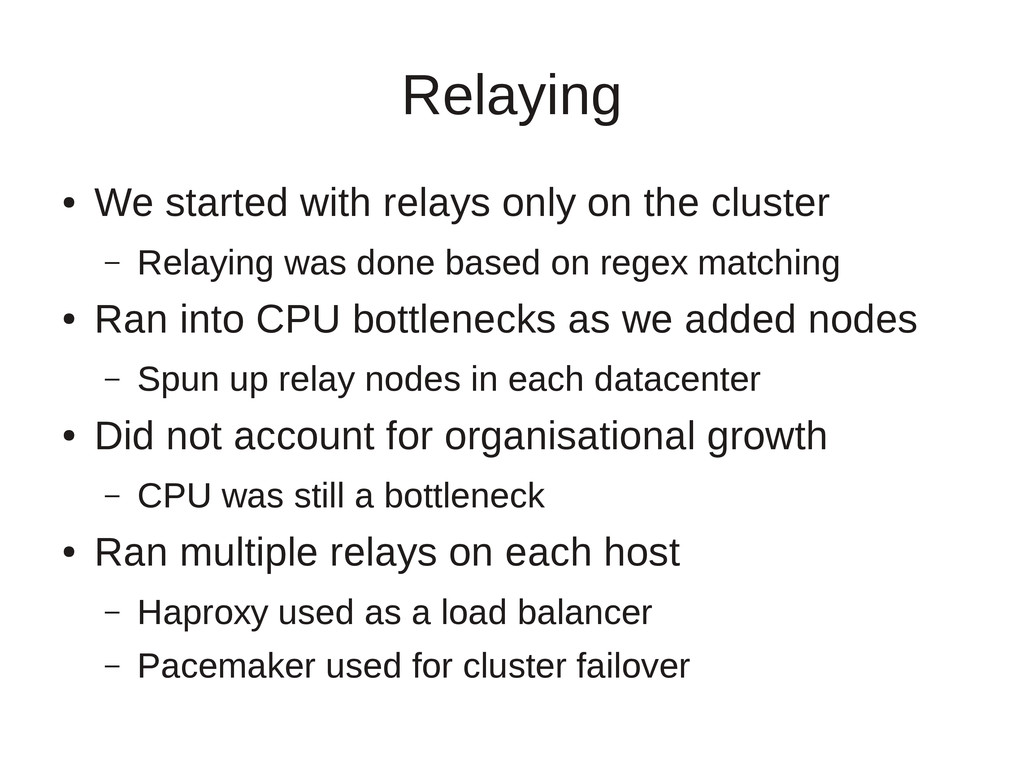
– Relaying was done based on regex matching • Ran into CPU bottlenecks as we added nodes – Spun up relay nodes in each datacenter • Did not account for organisational growth – CPU was still a bottleneck • Ran multiple relays on each host – Haproxy used as a load balancer – Pacemaker used for cluster failover
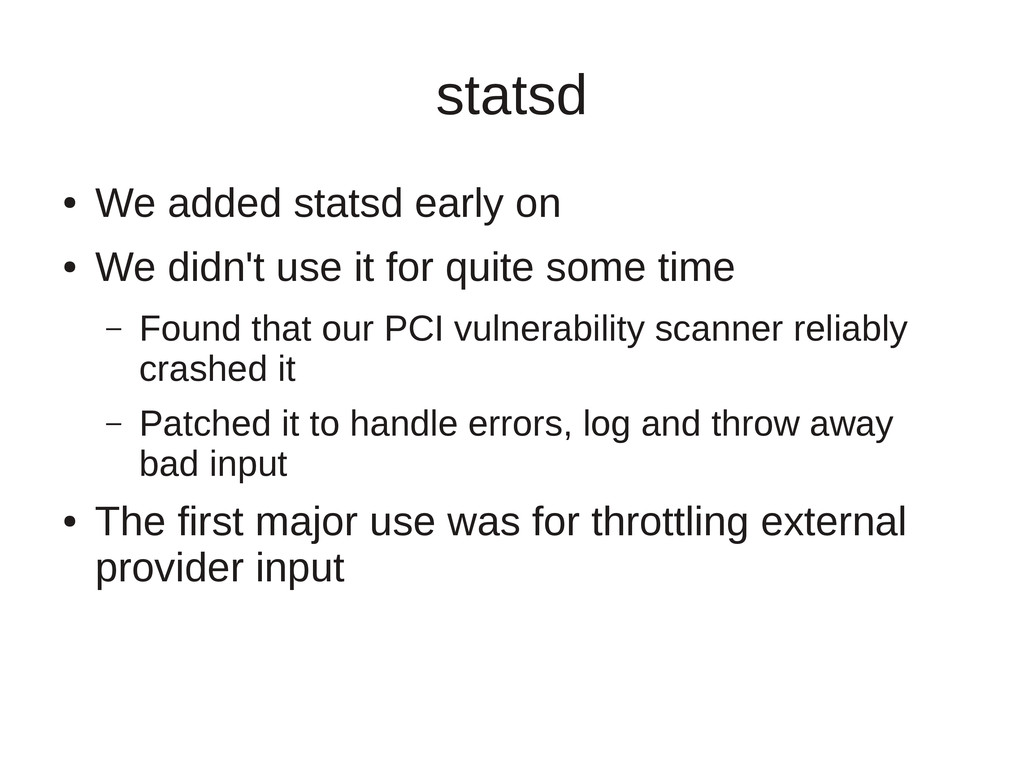
use it for quite some time – Found that our PCI vulnerability scanner reliably crashed it – Patched it to handle errors, log and throw away bad input • The first major use was for throttling external provider input
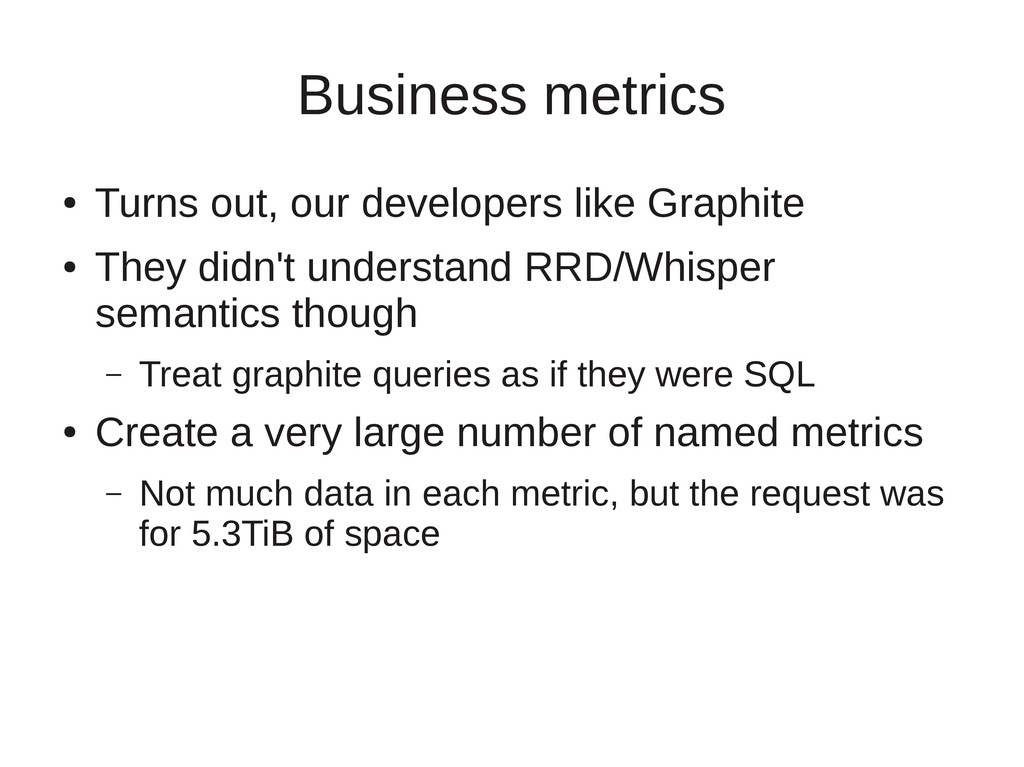
They didn't understand RRD/Whisper semantics though – Treat graphite queries as if they were SQL • Create a very large number of named metrics – Not much data in each metric, but the request was for 5.3TiB of space
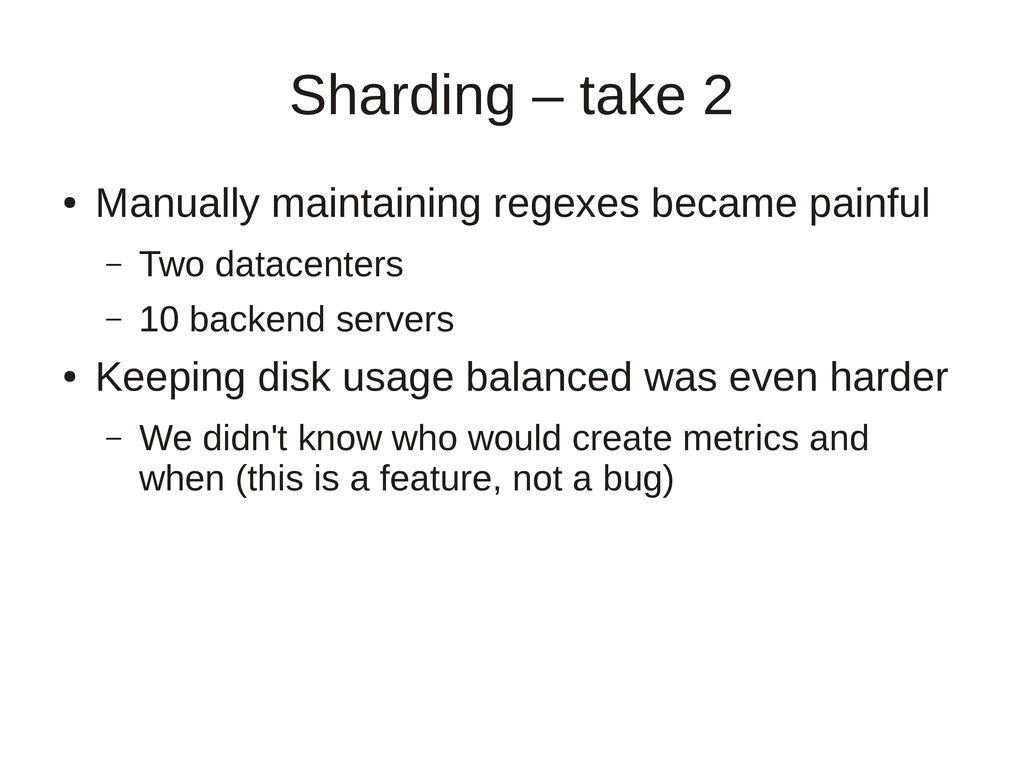
– Two datacenters – 10 backend servers • Keeping disk usage balanced was even harder – We didn't know who would create metrics and when (this is a feature, not a bug)
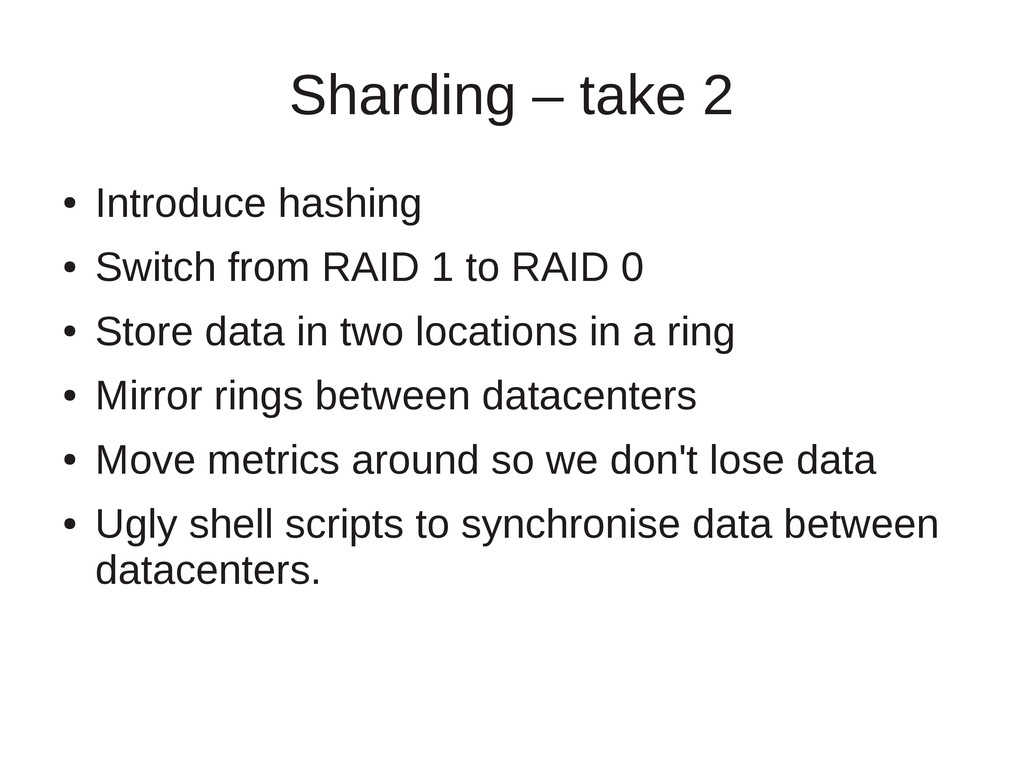
RAID 1 to RAID 0 • Store data in two locations in a ring • Mirror rings between datacenters • Move metrics around so we don't lose data • Ugly shell scripts to synchronise data between datacenters.
have had problems recording data after upgrading whisper • Horizontal scalability – Adding shards is hard – Replacing SSDs is getting a bit expensive • People – Want a graph, throw the data at Graphite – Even if it isn't time series data or one record a day
change alerting – Not just the trend, the rate at which it changes • OpenTSDB storage • Anomaly detection – Skyline, etc • Tracking even more business metrics • Hiring people to work on such fun problems – Developers, Sysadmins ... – http://www.booking.com/jobs