Upgrade to Pro
— share decks privately, control downloads, hide ads and more …
Speaker Deck
Features
Speaker Deck
PRO
Sign in
Sign up for free
Search
Search
Berlin 2013 - Session - Mark McGranaghan
Search
Sponsored
·
Your Podcast. Everywhere. Effortlessly.
Share. Educate. Inspire. Entertain. You do you. We'll handle the rest.
→
Monitorama
September 19, 2013
340
1
Share
Embed
Copy iframe code
Copy JS code
Copy link
Start on current slide
Berlin 2013 - Session - Mark McGranaghan
Monitorama
September 19, 2013
More Decks by Monitorama
See All by Monitorama
Monitorama PDX 2017 - Ian Bennett
monitorama
1
630
PDX 2017 - Pedro Andrade
monitorama
0
830
PDX 2017 - Roy Rapoport
monitorama
4
990
PDX 2017 - Julia Evans
monitorama
0
520
Berlin 2013 - Session - Brad Lhotsky
monitorama
5
770
Berlin 2013 - Session - Alex Petrov
monitorama
6
730
Berlin 2013 - Session - Jeff Weinstein
monitorama
2
670
Berlin 2013 - Session - Oliver Hankeln
monitorama
1
590
Berlin 2013 - Session - David Goodlad
monitorama
0
510
Featured
See All Featured
WENDY [Excerpt]
tessaabrams
11
38k
AI Search: Implications for SEO and How to Move Forward - #ShenzhenSEOConference
aleyda
1
1.3k
Chasing Engaging Ingredients in Design
codingconduct
0
220
What’s in a name? Adding method to the madness
productmarketing
PRO
24
4.1k
Claude Code のすすめ
schroneko
67
230k
SEO in 2025: How to Prepare for the Future of Search
ipullrank
3
3.5k
svc-hook: hooking system calls on ARM64 by binary rewriting
retrage
2
300
Jamie Indigo - Trashchat’s Guide to Black Boxes: Technical SEO Tactics for LLMs
techseoconnect
PRO
0
170
The Illustrated Guide to Node.js - THAT Conference 2024
reverentgeek
1
390
A better future with KSS
kneath
240
18k
Fashionably flexible responsive web design (full day workshop)
malarkey
408
66k
Why Your Marketing Sucks and What You Can Do About It - Sophie Logan
marketingsoph
0
170
Transcript
Fewer Better Systems Monitorama EU 2013 Mark McGranaghan
@mmcgrana
Fewer Better Systems
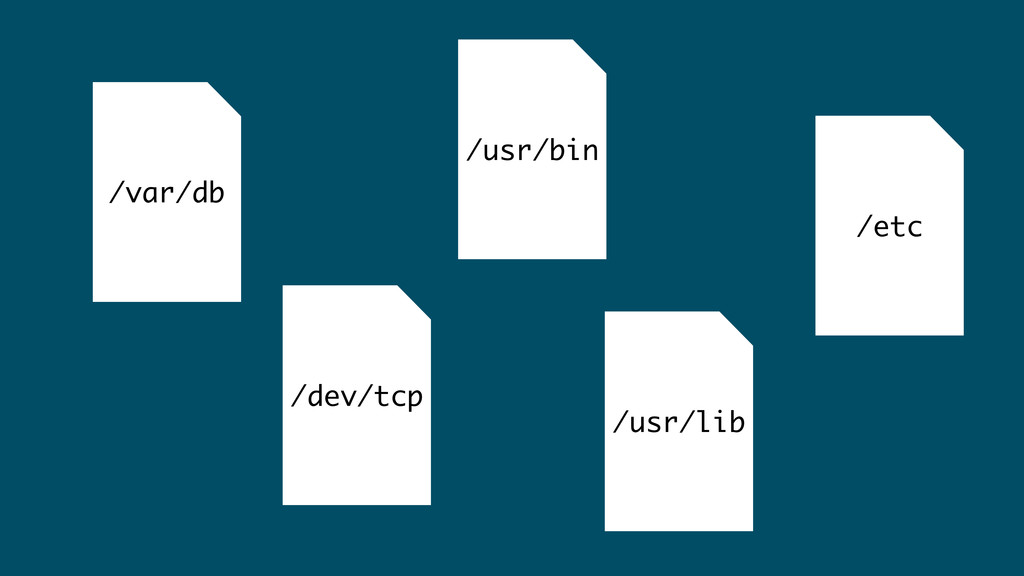
Unix
everything is a file
/var/db /usr/lib /dev/tcp /usr/bin /etc
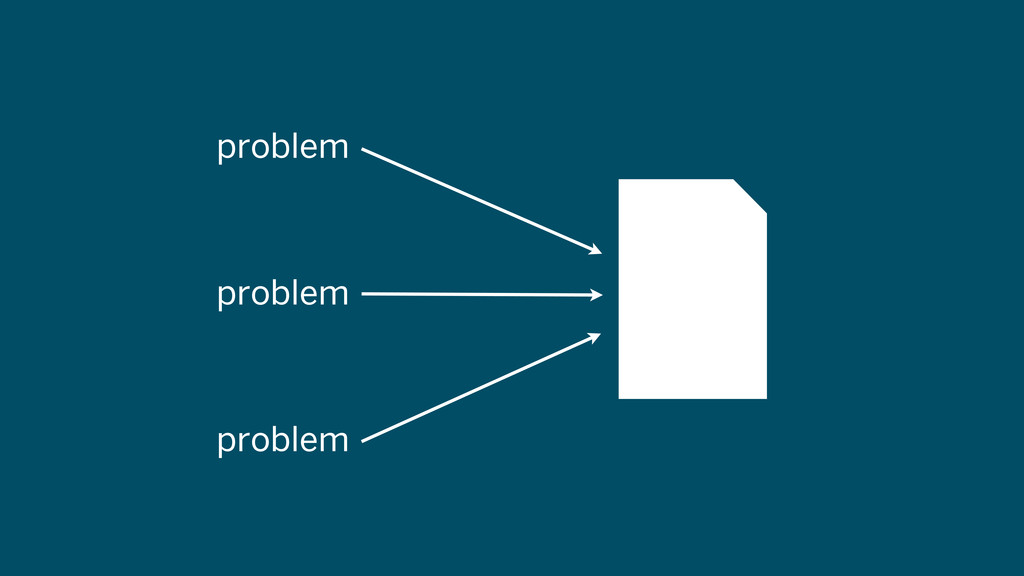
/dev/tcp
problem problem problem
everything is a ...
failover
primary secondary
primary secondary
primary secondary
primary secondary?
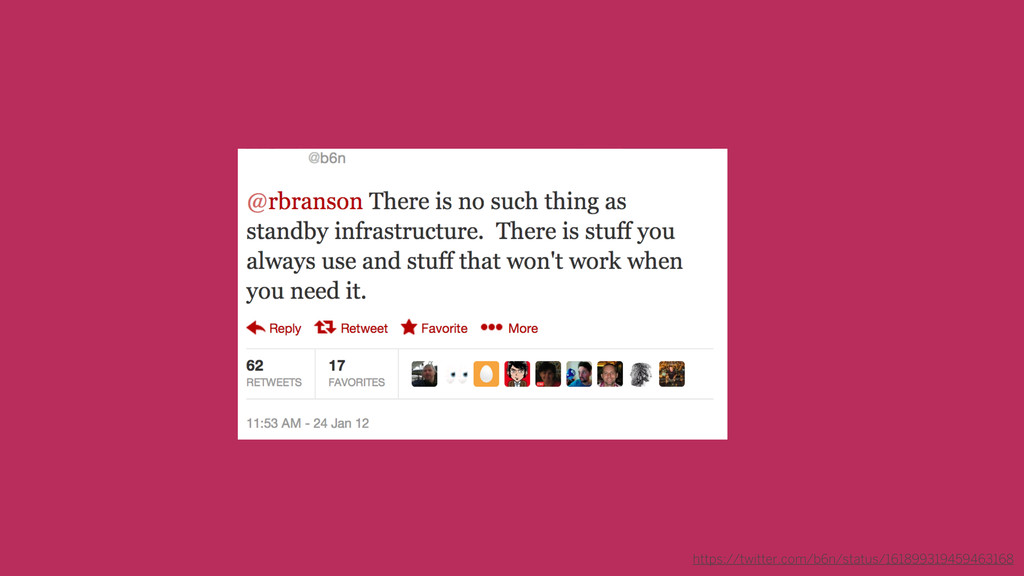
https://twitter.com/b6n/status/161899319459463168
the best systems are used constantly
Fewer Better Systems
everything is a ...
the best systems are used constantly
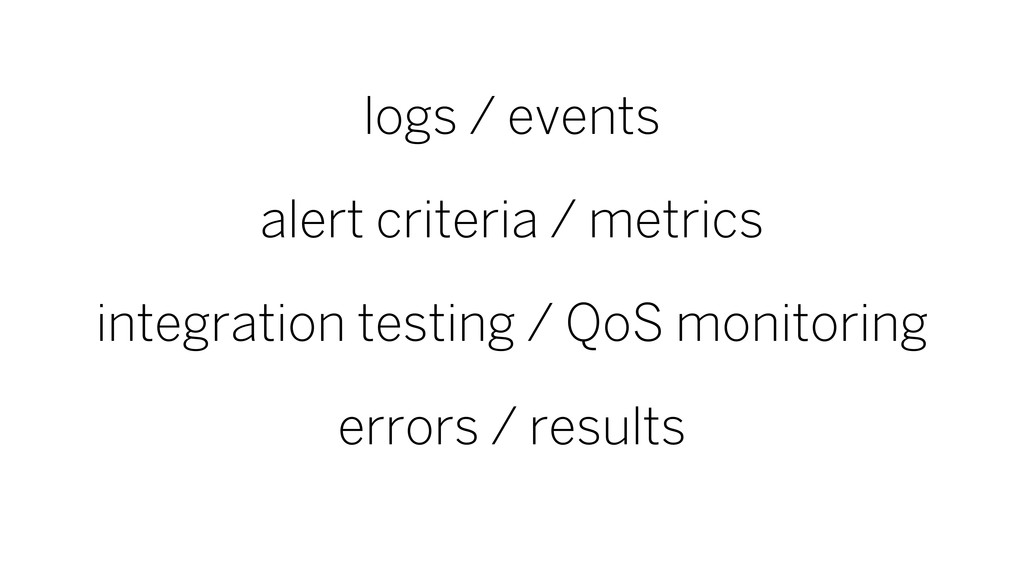
logs / events alert criteria / metrics integration testing /
QoS monitoring errors / results
logs / events
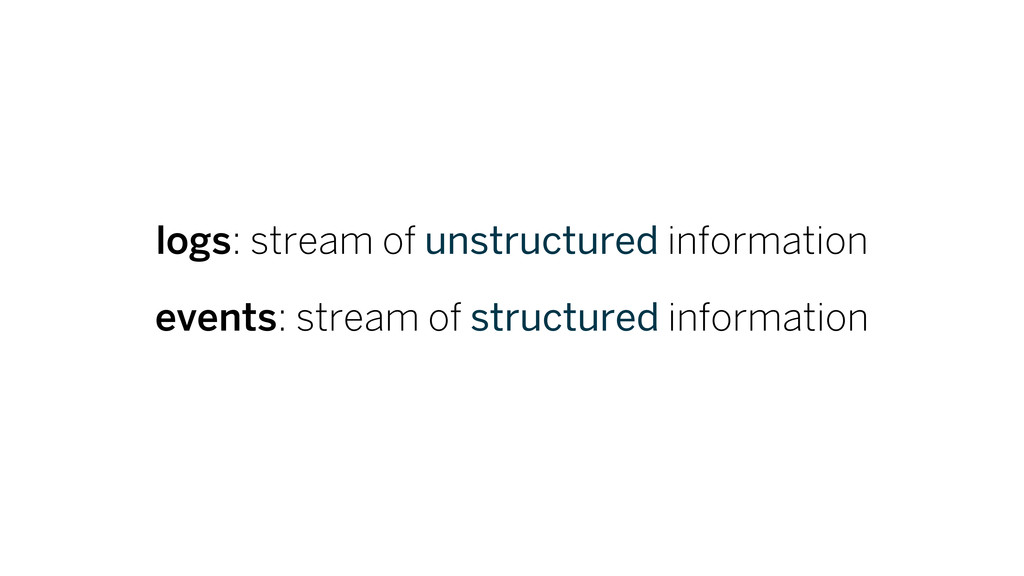
logs: stream of unstructured information events: stream of structured information
logs 64.242.88.10 - [19/Sep/2013:10:27:39] "GET /users/7 HTTP/1.1" 200 [notice] SQL
(0.5ms) SELECT users Completed in 64ms (View: 52, DB: 10) | 200 OK [/users/7]
invent ways to encode data in text...
data "data" | data <data> - data [data] (data)
meanwhile...
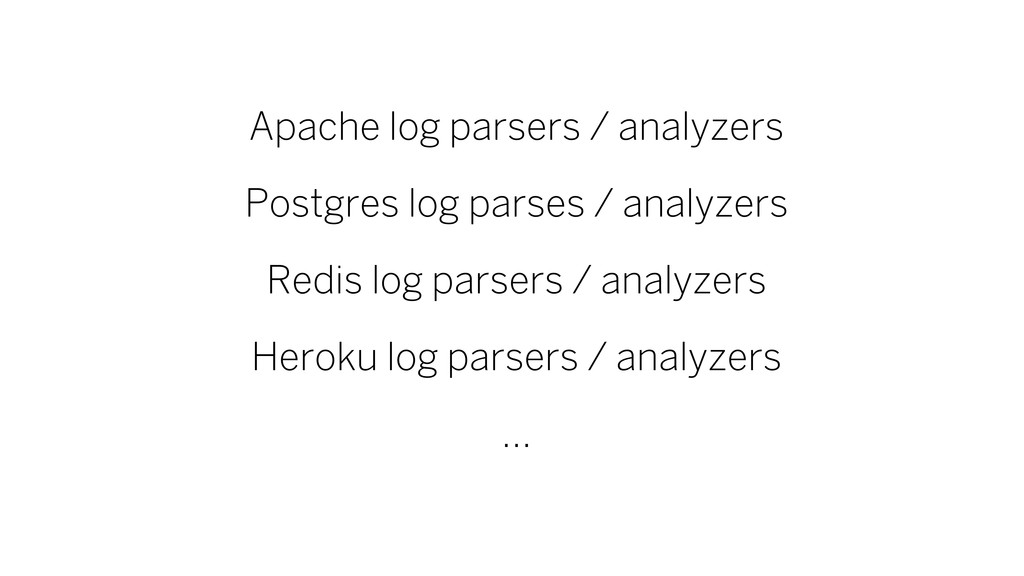
Apache log parsers / analyzers Postgres log parses / analyzers
Redis log parsers / analyzers Heroku log parsers / analyzers ...
everything is a ...
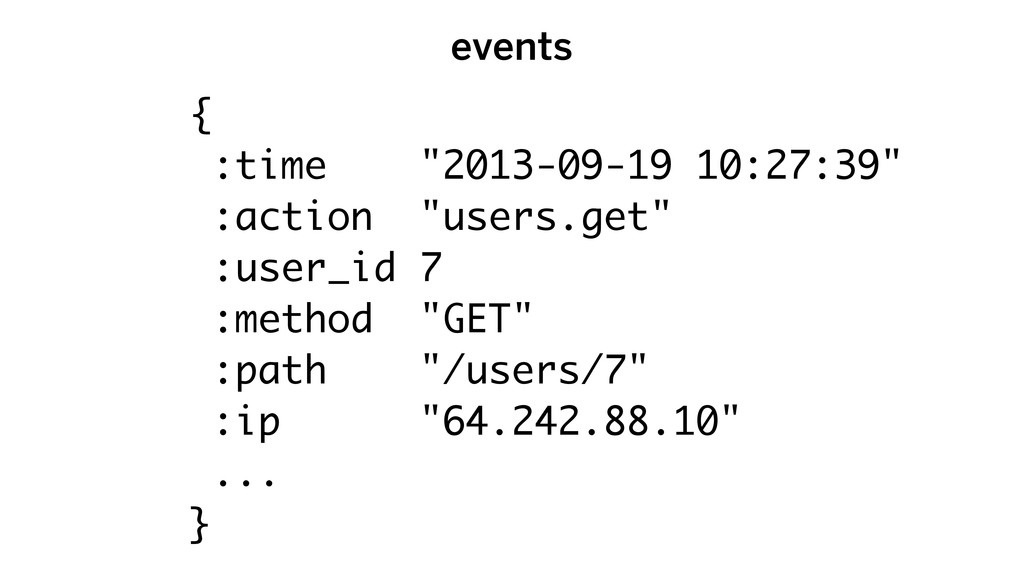
events { :time "2013-09-19 10:27:39" :action "users.get" :user_id 7 :method
"GET" :path "/users/7" :ip "64.242.88.10" ... }
64.242.88.10 - [19/Sep/2013:10:27:39] "GET /users/7 HTTP/1.1" 200
events { :time "2013-09-19 10:27:39" :action "users.get" :user_id 7 :method
"GET" :path "/users/7" :ip "64.242.88.10" ... }
encode data as data, uniformly
analyze with general tools
open source
http://fluentd.org
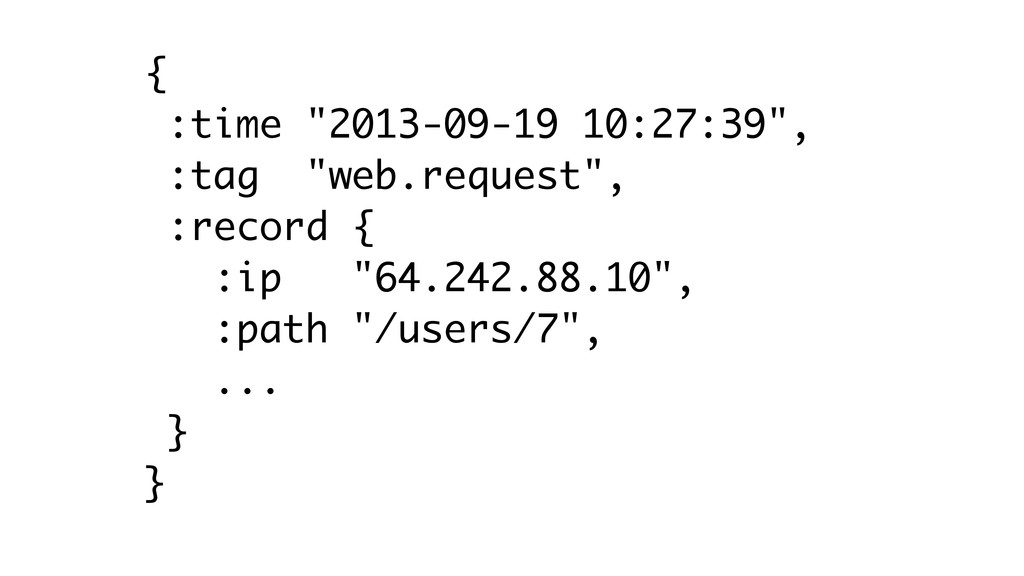
{ :time "2013-09-19 10:27:39", :tag "web.request", :record { :ip "64.242.88.10",
:path "/users/7", ... } }
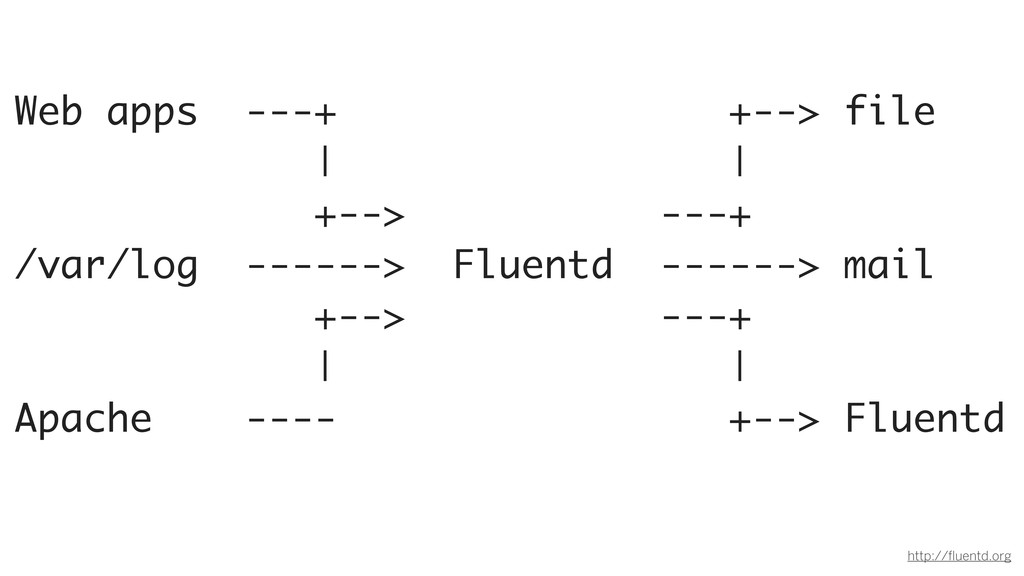
Web apps ---+ +--> file | | +--> ---+ /var/log
------> Fluentd ------> mail +--> ---+ | | Apache ---- +--> Fluentd http://fluentd.org
problem problem problem
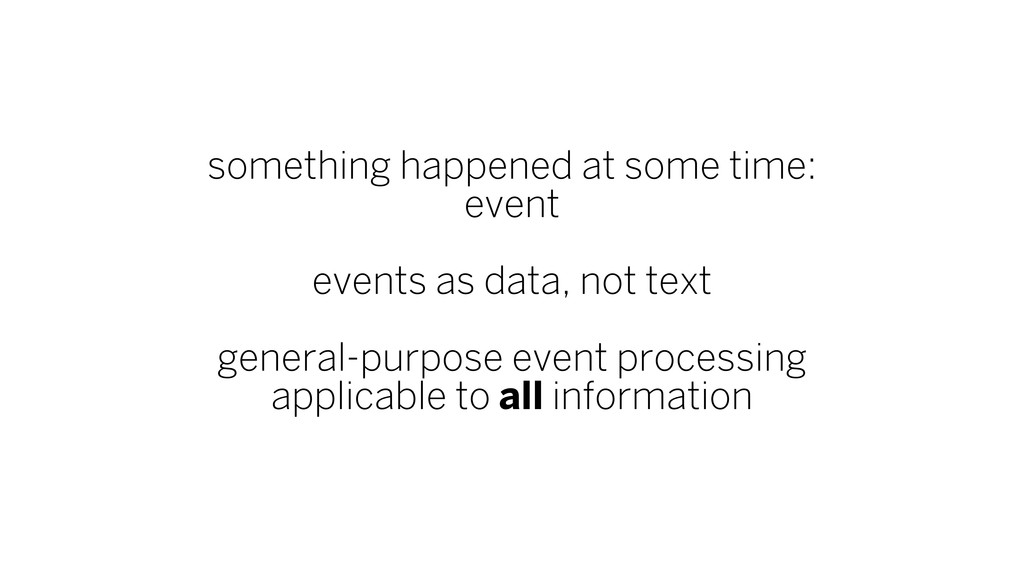
something happened at some time: event events as data, not
text general-purpose event processing applicable to all information
everything is a ...
alert criteria / metrics
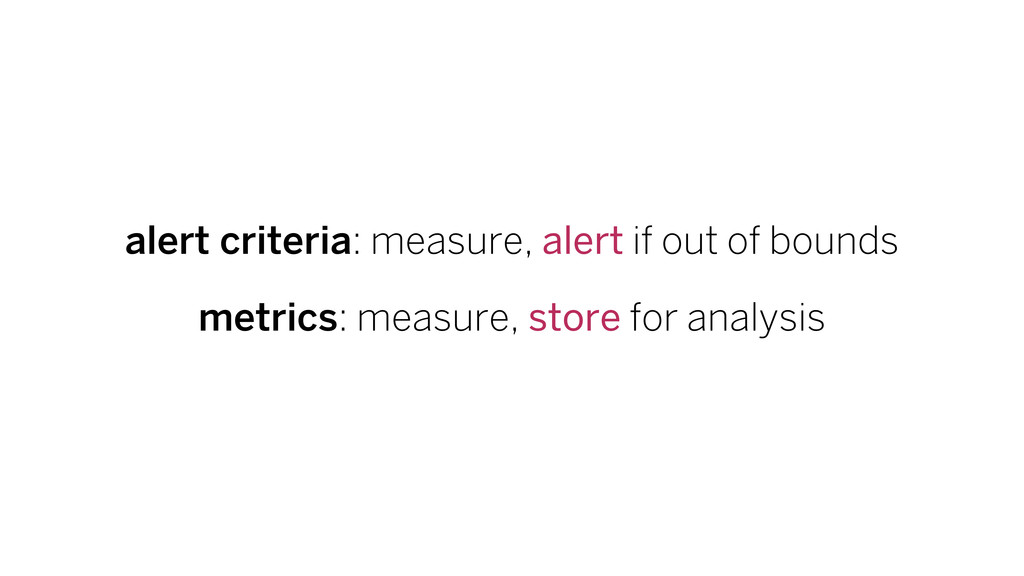
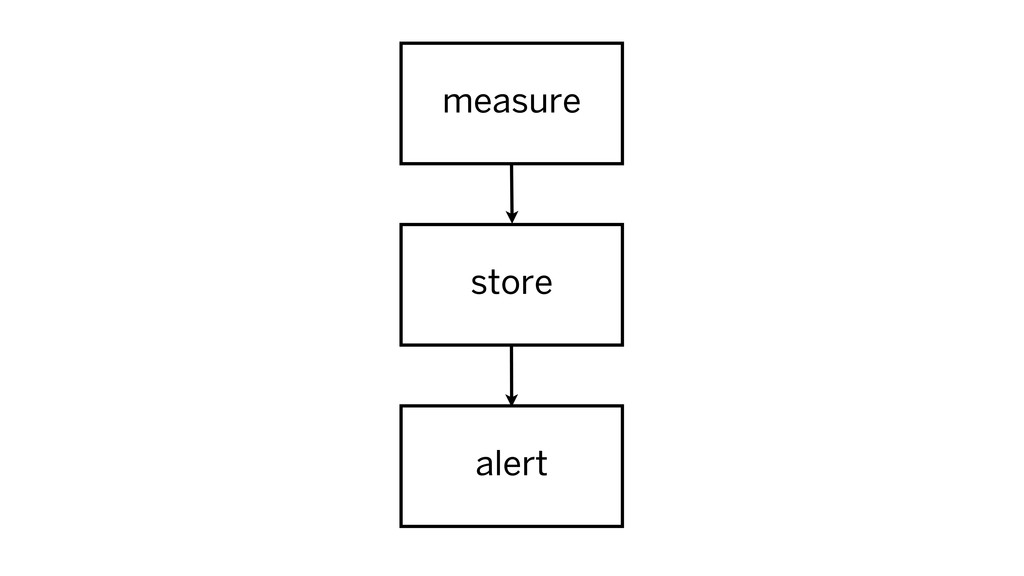
alert criteria: measure, alert if out of bounds metrics: measure,
store for analysis
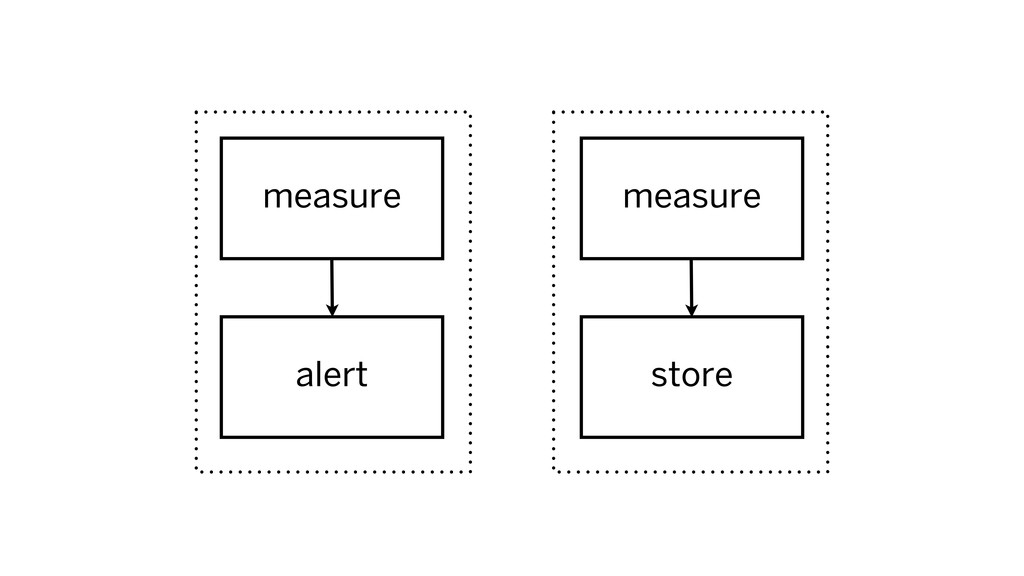
measure measure alert store
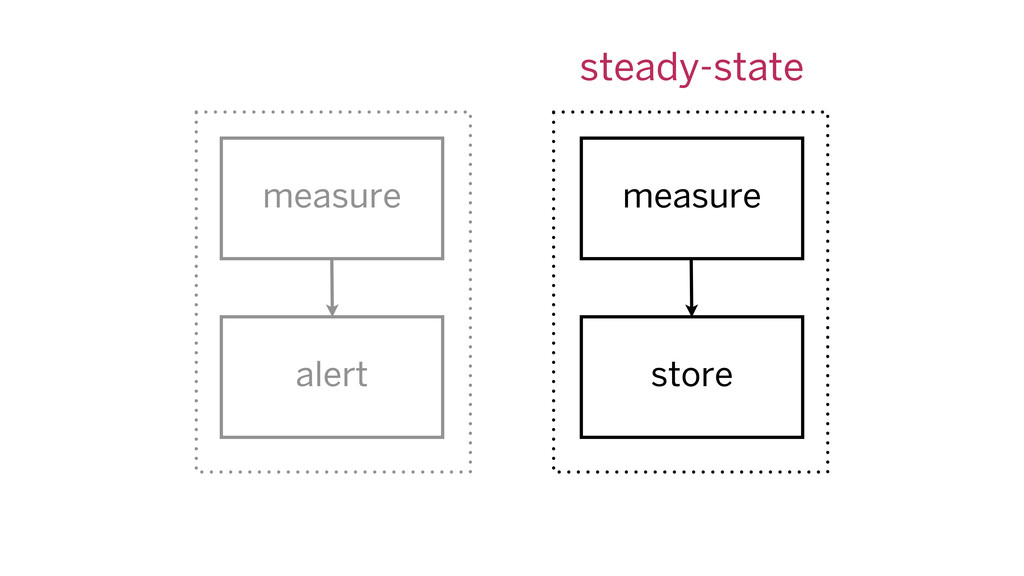
measure measure alert store steady-state
measure measure alert store alert!
measure measure alert store steady-state
measure alert store
production
None
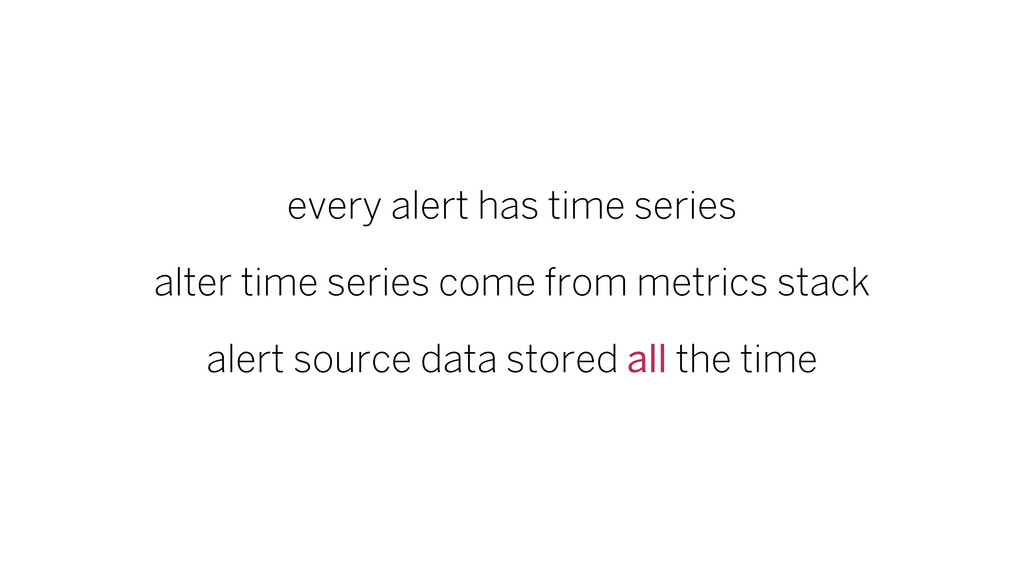
every alert has time series alter time series come from
metrics stack alert source data stored all the time
the best systems are used constantly
integration testing / QoS monitoring
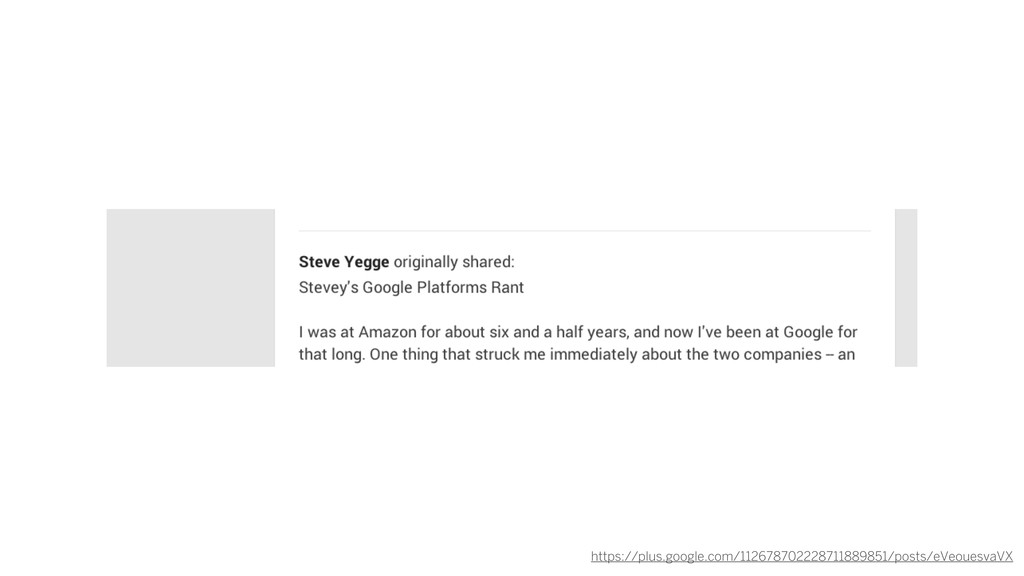
https://plus.google.com/112678702228711889851/posts/eVeouesvaVX
integration testing: is good for production? QoS monitoring: is it
good in production?
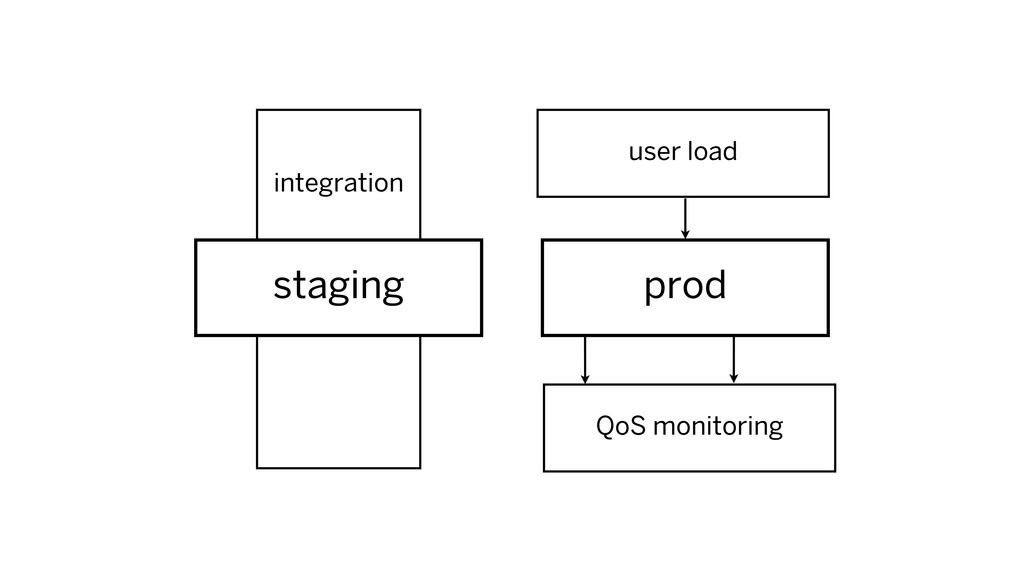
integration testing run through common user flows, assert no errors,
ensure performance adequate
quality of service (QoS) monitoring users running through flows asserting
no/minimal errors, ensuring performance adequate
integration prod staging user load QoS monitoring
Integration prod staging user load QoS monitoring
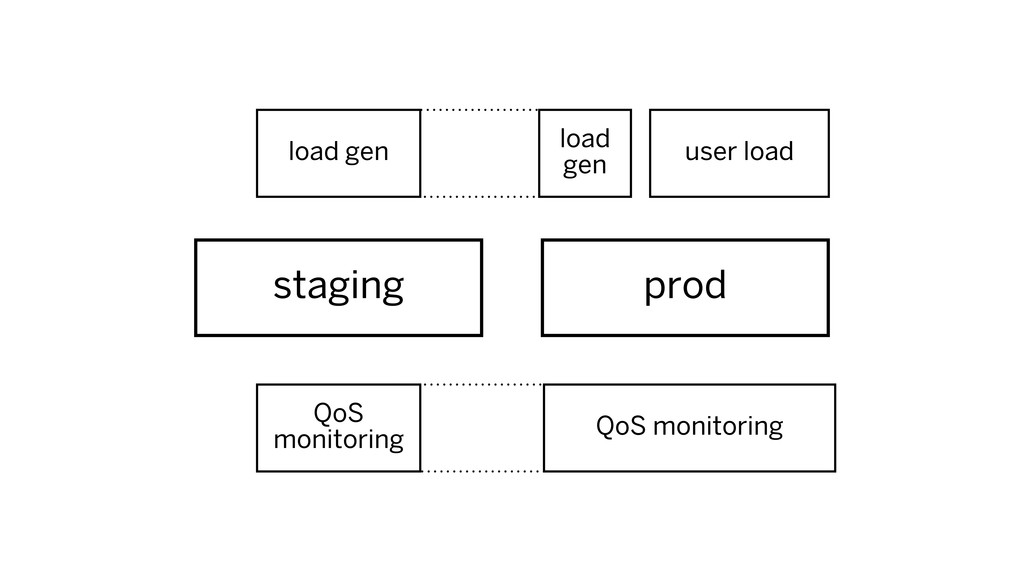
staging prod user load load gen QoS monitoring QoS monitoring
load gen
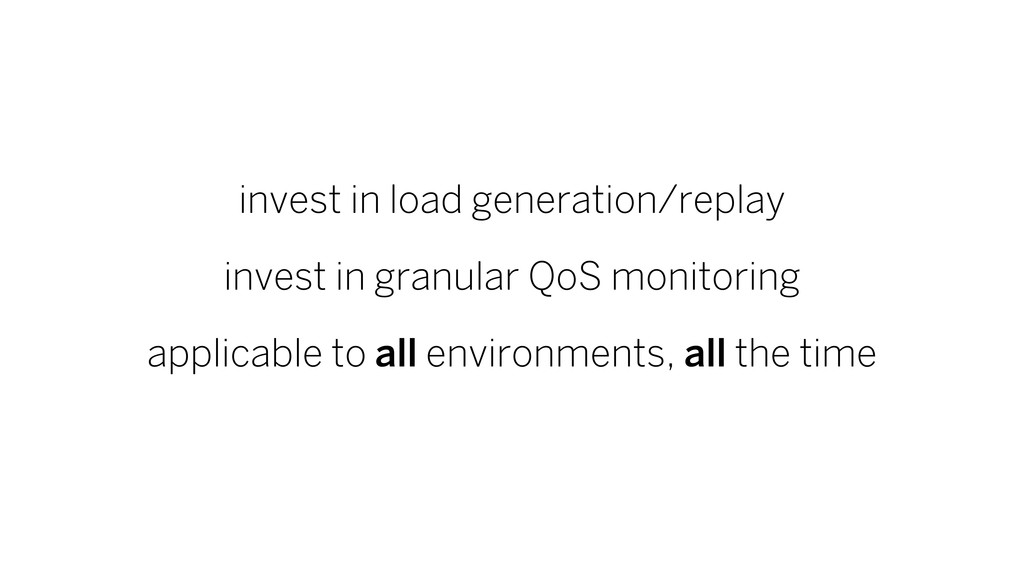
invest in load generation/replay invest in granular QoS monitoring applicable
to all environments, all the time
the best systems are used constantly
errors / results
raise(“it’s tricky”)
errors: something happened, it was bad results: something happened, it
was OK
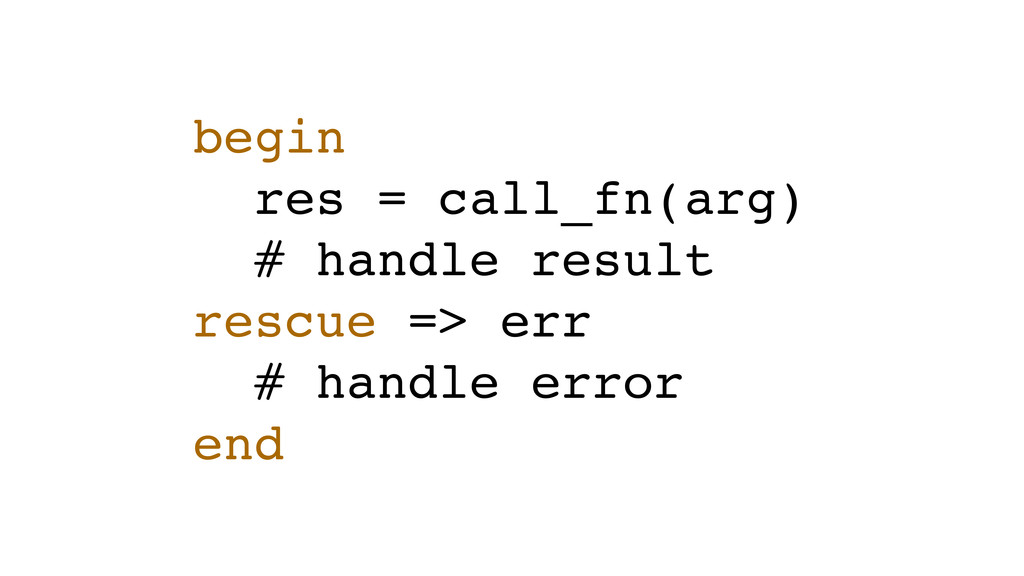
begin res = call_fn(arg) # handle result rescue => err
# handle error end
None
None
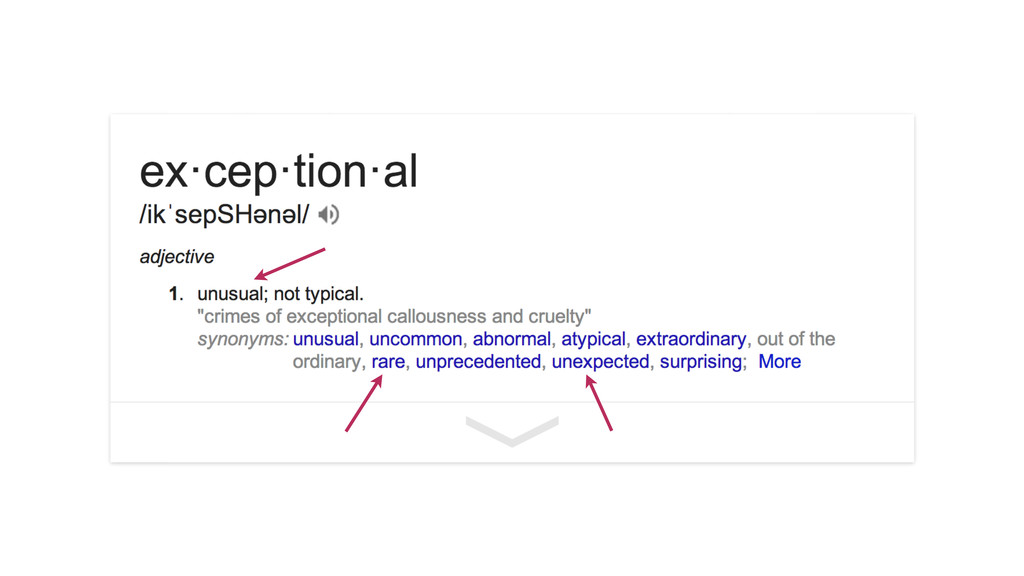
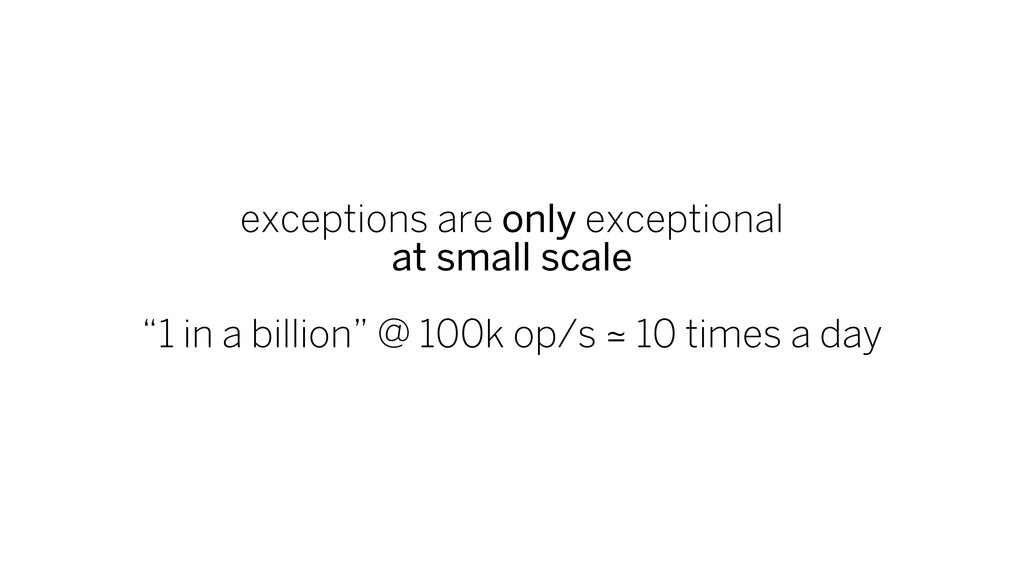
exceptions are only exceptional at small scale “1 in a
billion” @ 100k op/s ≃ 10 times a day
begin res = call_fn(arg) # handle result rescue => err
# handle error end
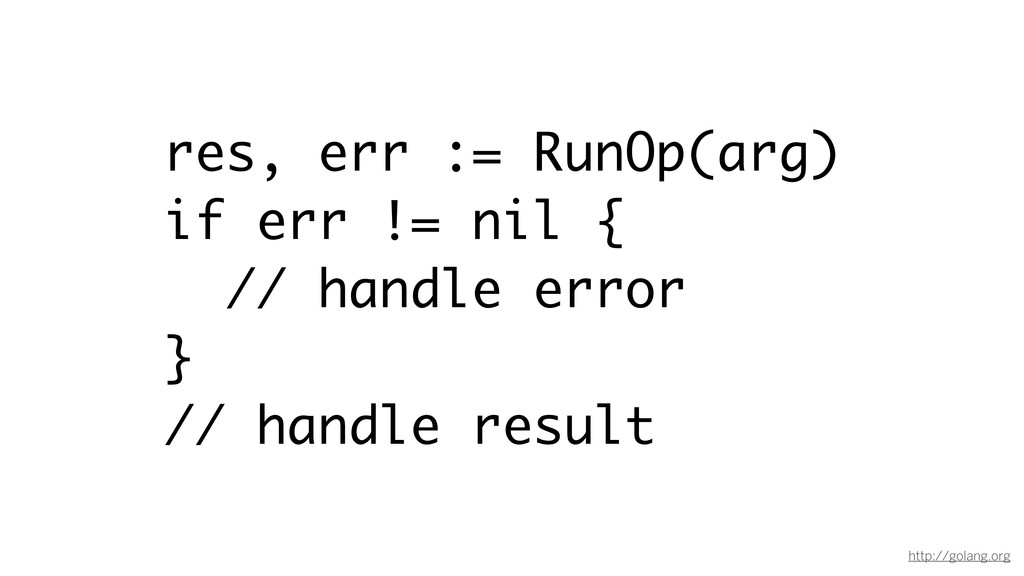
open source
http://golang.org
http://golang.org res, err := RunOp(arg) if err != nil {
// handle error } // handle result
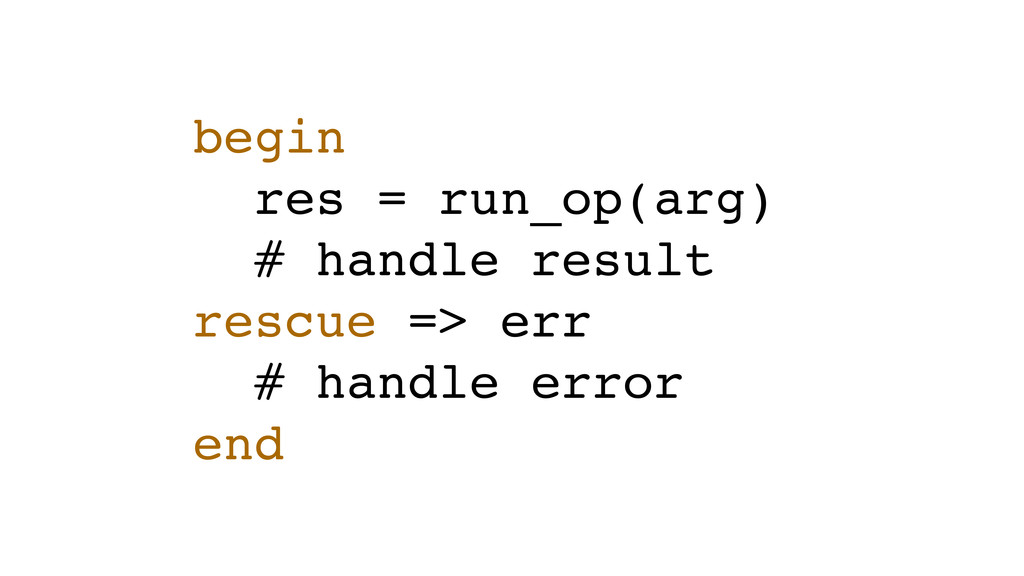
begin res = run_op(arg) # handle result rescue => err
# handle error end
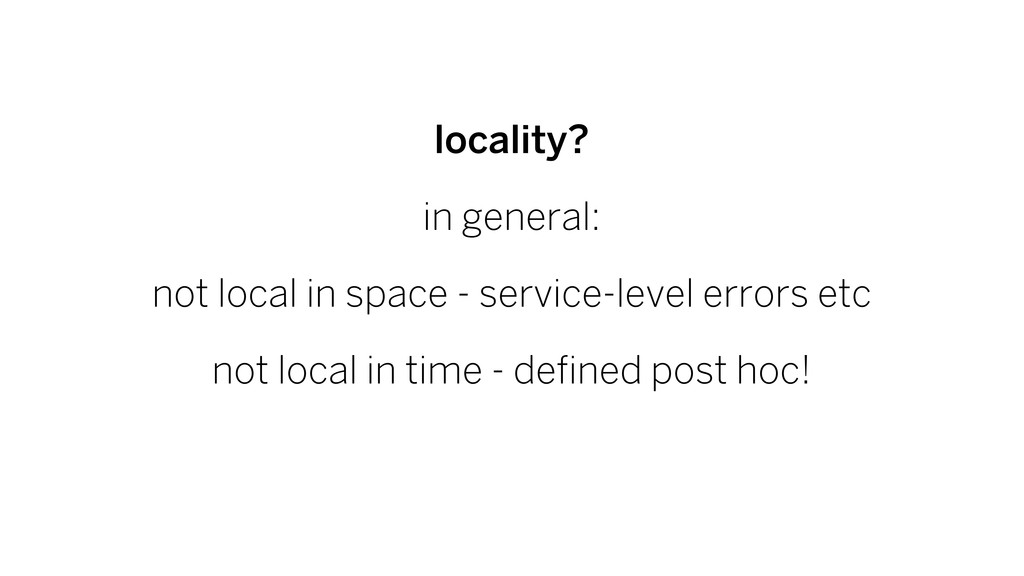
locality? in general: not local in space - service-level errors
etc not local in time - defined post hoc!
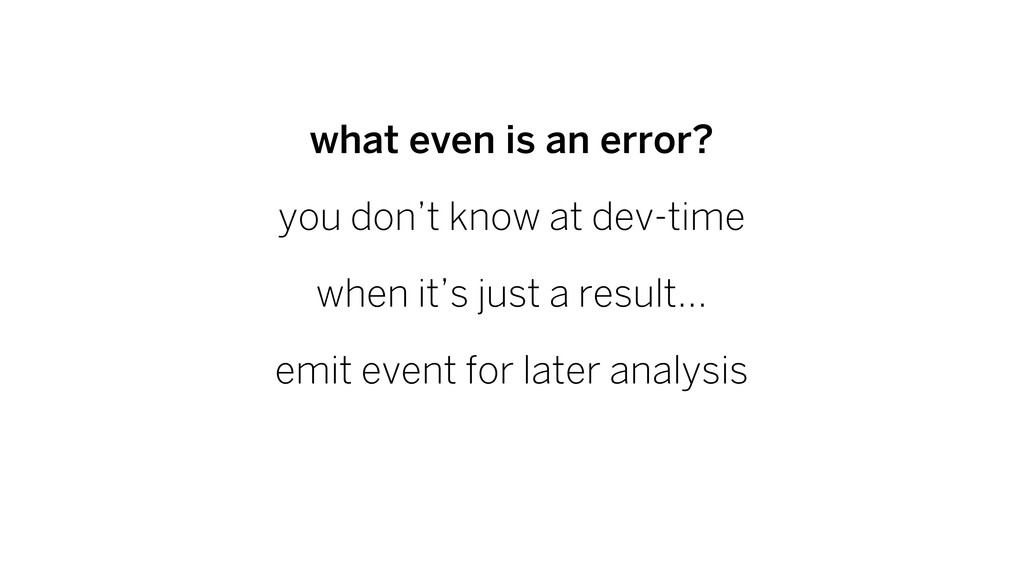
what even is an error? you don’t know at dev-time
when it’s just a result... emit event for later analysis
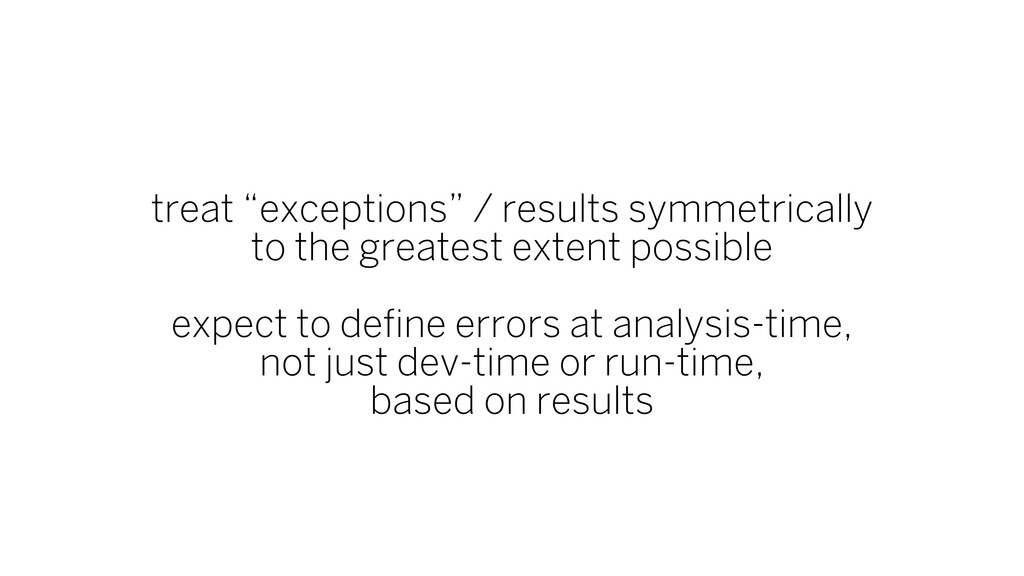
treat “exceptions” / results symmetrically to the greatest extent possible
expect to define errors at analysis-time, not just dev-time or run-time, based on results
everything is a ...
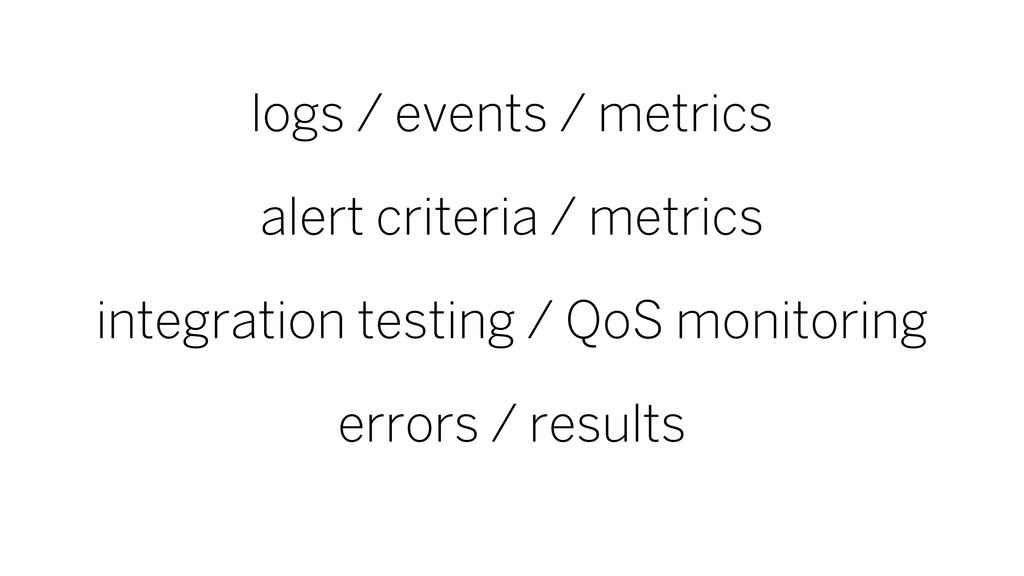
logs / events / metrics alert criteria / metrics integration
testing / QoS monitoring errors / results
a challenge
everything is a ...
the best systems are used constantly
Fewer Better Systems
![logs 64.242.88.10 - [19/Sep/2013:10:27:39] "GET /users/7 HTTP/1.1" 200 [notice] SQL](https://files.speakerdeck.com/presentations/632ea08007b0013147c96a5d3242ec61/slide_22.jpg)
![data "data" | data <data> - data [data] (data)](https://files.speakerdeck.com/presentations/632ea08007b0013147c96a5d3242ec61/slide_24.jpg)
![64.242.88.10 - [19/Sep/2013:10:27:39] "GET /users/7 HTTP/1.1" 200](https://files.speakerdeck.com/presentations/632ea08007b0013147c96a5d3242ec61/slide_29.jpg)