Upgrade to Pro
— share decks privately, control downloads, hide ads and more …
Speaker Deck
Features
Speaker Deck
PRO
Sign in
Sign up for free
Search
Search
VISUALIZING MARATHON 2012 - DESIGNER Q&A
Search
Moritz Stefaner
November 10, 2012
2.3k
0
Share
Embed
Copy iframe code
Copy JS code
Copy link
Start on current slide
VISUALIZING MARATHON 2012 - DESIGNER Q&A
Moritz Stefaner
November 10, 2012
More Decks by Moritz Stefaner
See All by Moritz Stefaner
Data Worlds — Boris Mueller & Moritz Stefaner - SAP UX Day 2016.pdf
moritzstefaner
1
280
"Weltbilder": course info
moritzstefaner
2
18k
What's the story? Visual Narratives
moritzstefaner
4
2.5k
emoto — Visualising the online response to London 2012
moritzstefaner
3
11k
Truth & Beauty Operations
moritzstefaner
2
470
OMG — It's all connected
moritzstefaner
2
4.8k
Featured
See All Featured
Why Mistakes Are the Best Teachers: Turning Failure into a Pathway for Growth
auna
0
190
Have SEOs Ruined the Internet? - User Awareness of SEO in 2025
akashhashmi
0
400
More Than Pixels: Becoming A User Experience Designer
marktimemedia
3
470
Leveraging Curiosity to Care for An Aging Population
cassininazir
1
430
The Pragmatic Product Professional
lauravandoore
37
7.4k
The Web Performance Landscape in 2024 [PerfNow 2024]
tammyeverts
12
1.2k
A Soul's Torment
seathinner
6
3.1k
From π to Pie charts
rasagy
0
240
Money Talks: Using Revenue to Get Sh*t Done
nikkihalliwell
0
420
Public Speaking Without Barfing On Your Shoes - THAT 2023
reverentgeek
1
460
Unlocking the hidden potential of vector embeddings in international SEO
frankvandijk
0
880
エンジニアに許された特別な時間の終わり
watany
108
250k
Transcript
VISUALIZING MARATHON 2012 MORITZ STEFANER TRUTH & BEAUTY OPERATOR DESIGNER
Q&A Nov 10, 2012
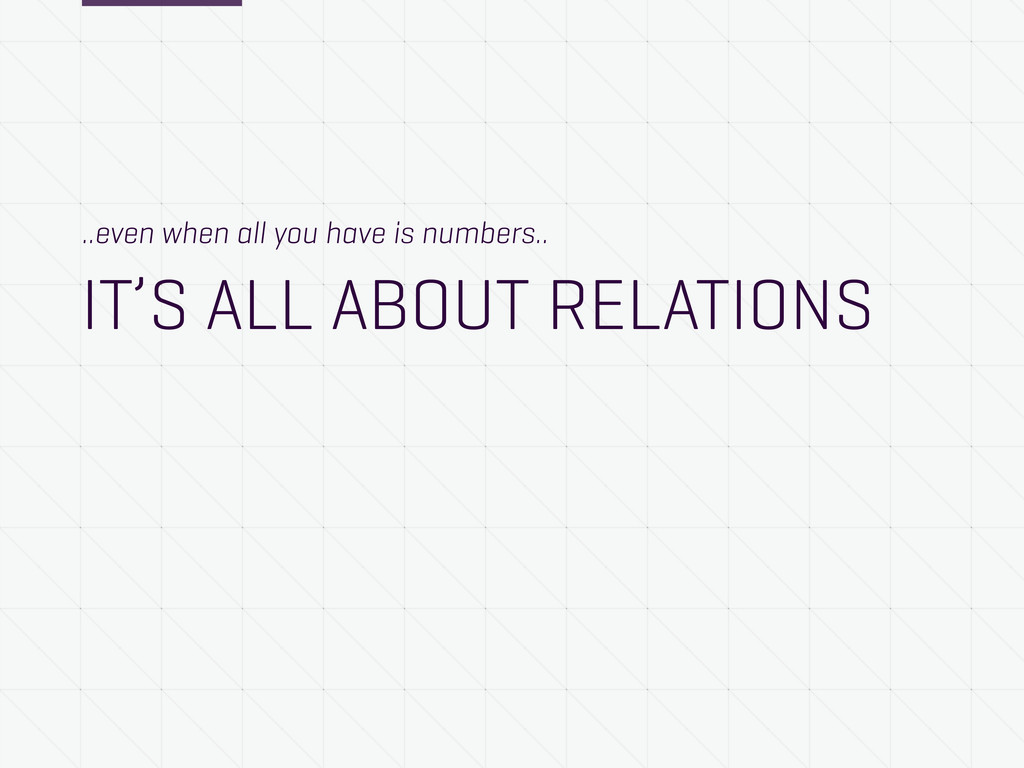
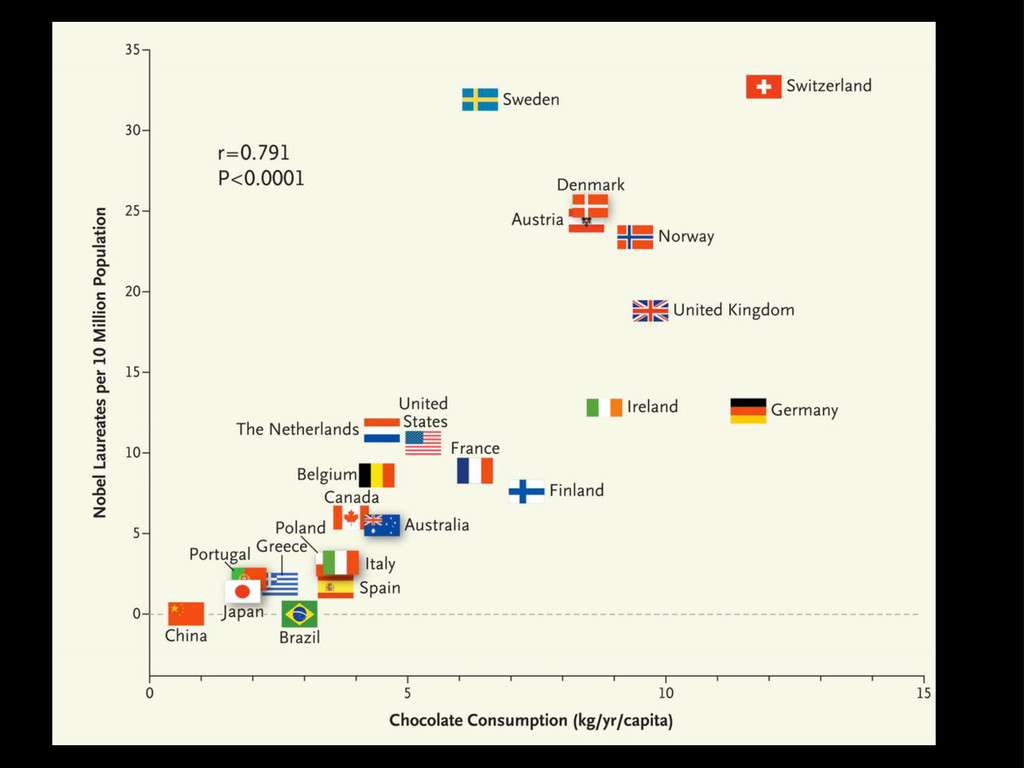
..even when all you have is numbers.. IT’S ALL ABOUT
RELATIONS
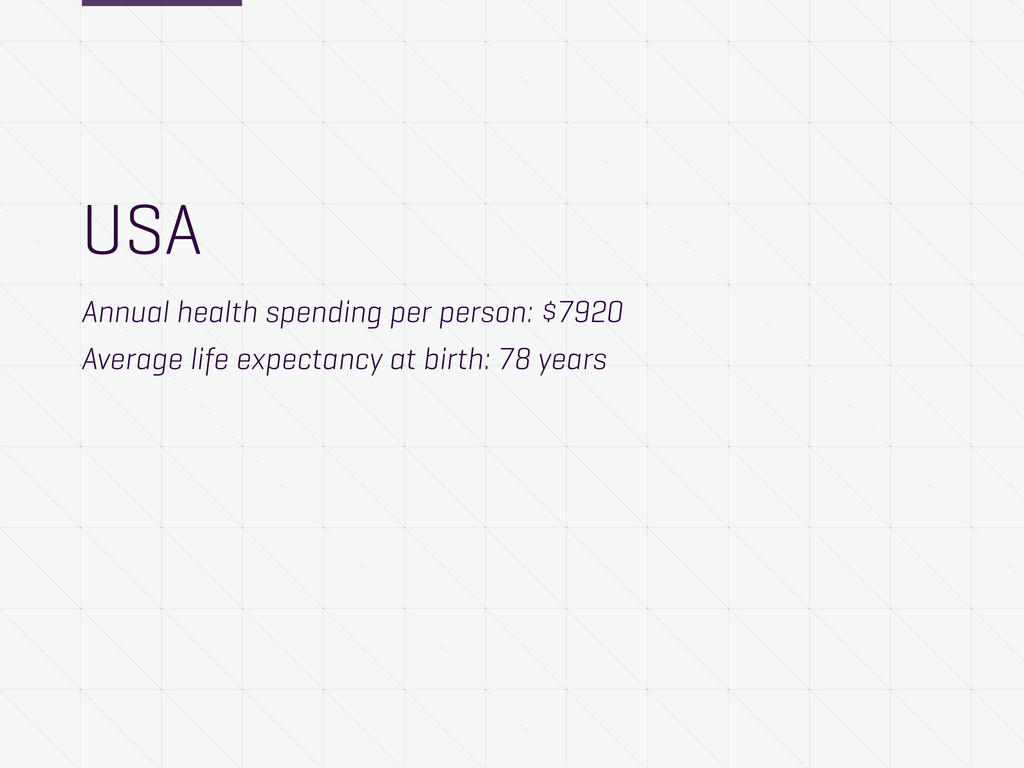
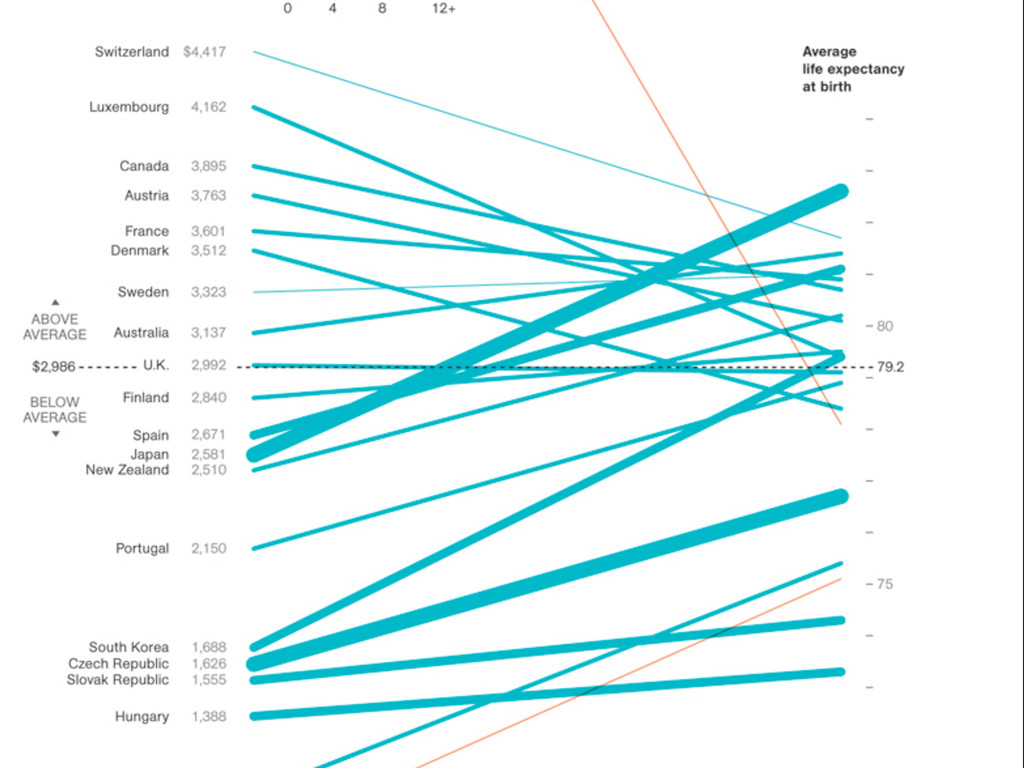
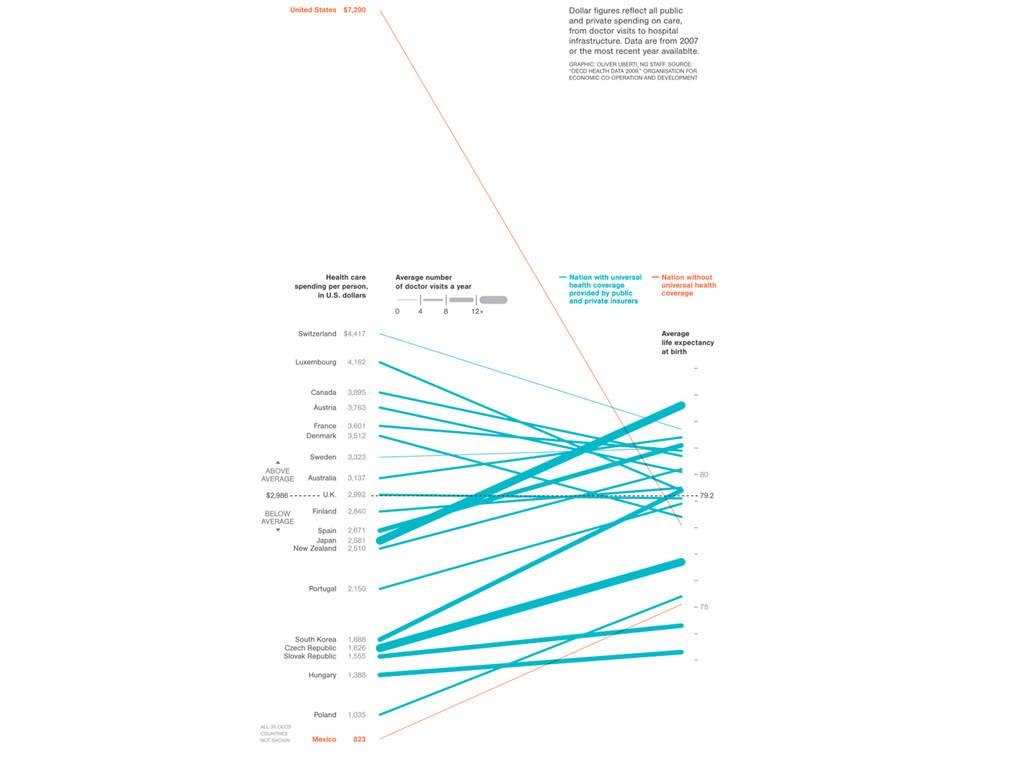
USA Annual health spending per person: $7920 Average life expectancy
at birth: 78 years
None
None
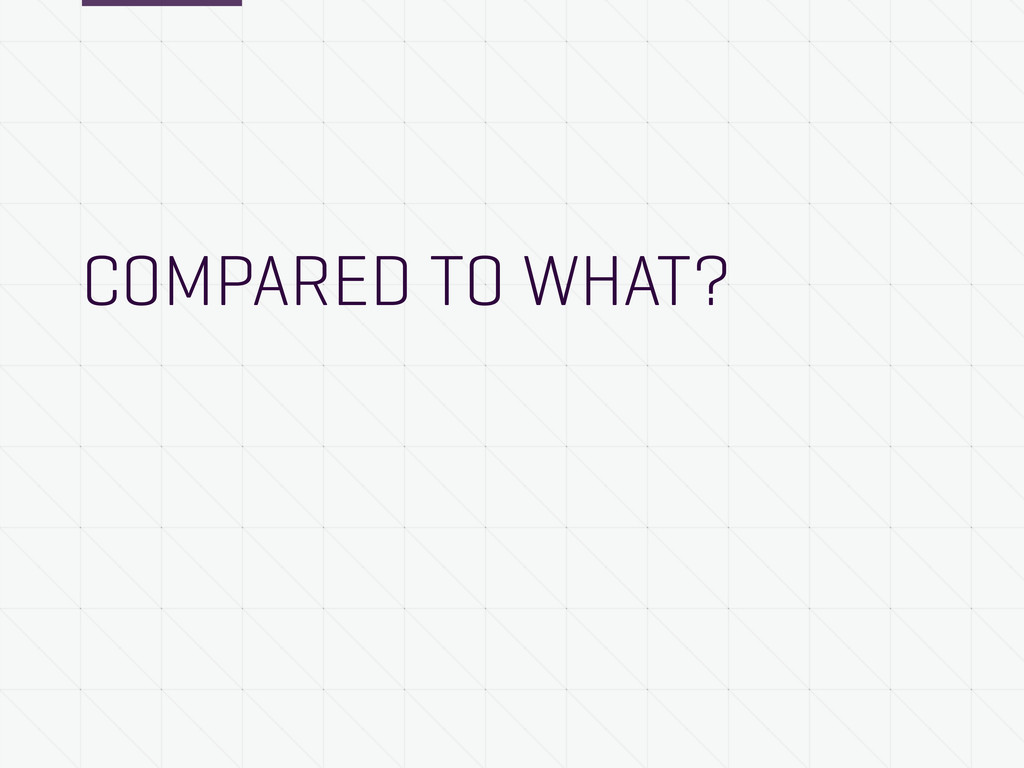
COMPARED TO WHAT?
None
None
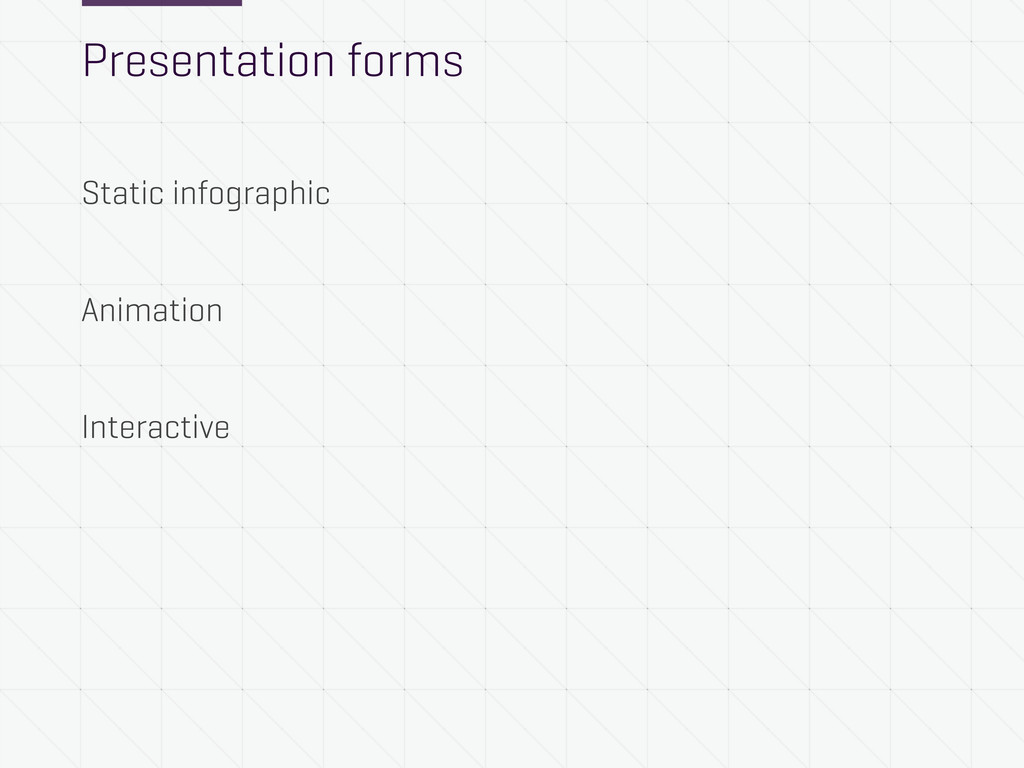
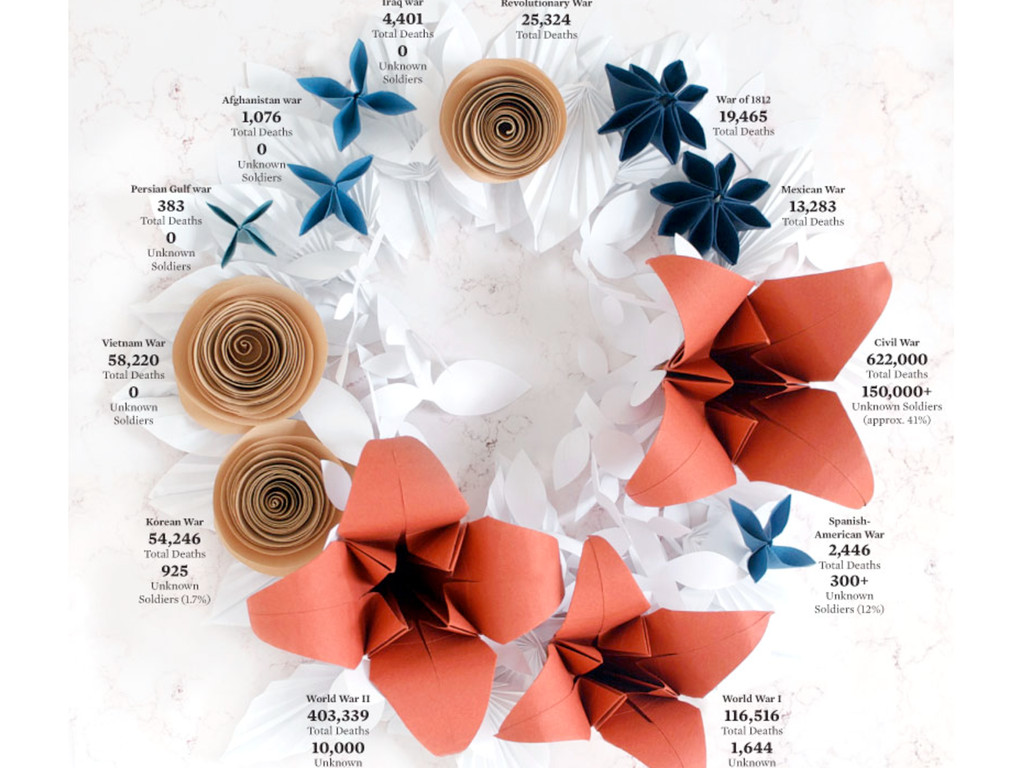
Presentation forms Static infographic Animation Interactive
Presentation forms Static infographic Animation Interactive ...that’s it?
None
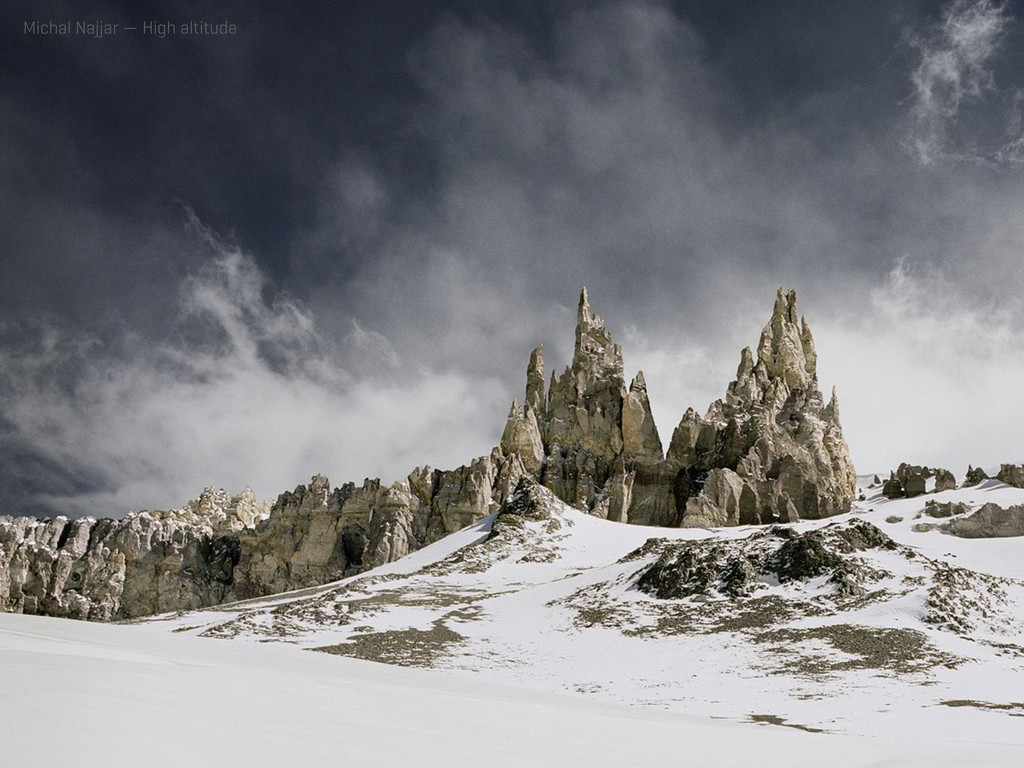
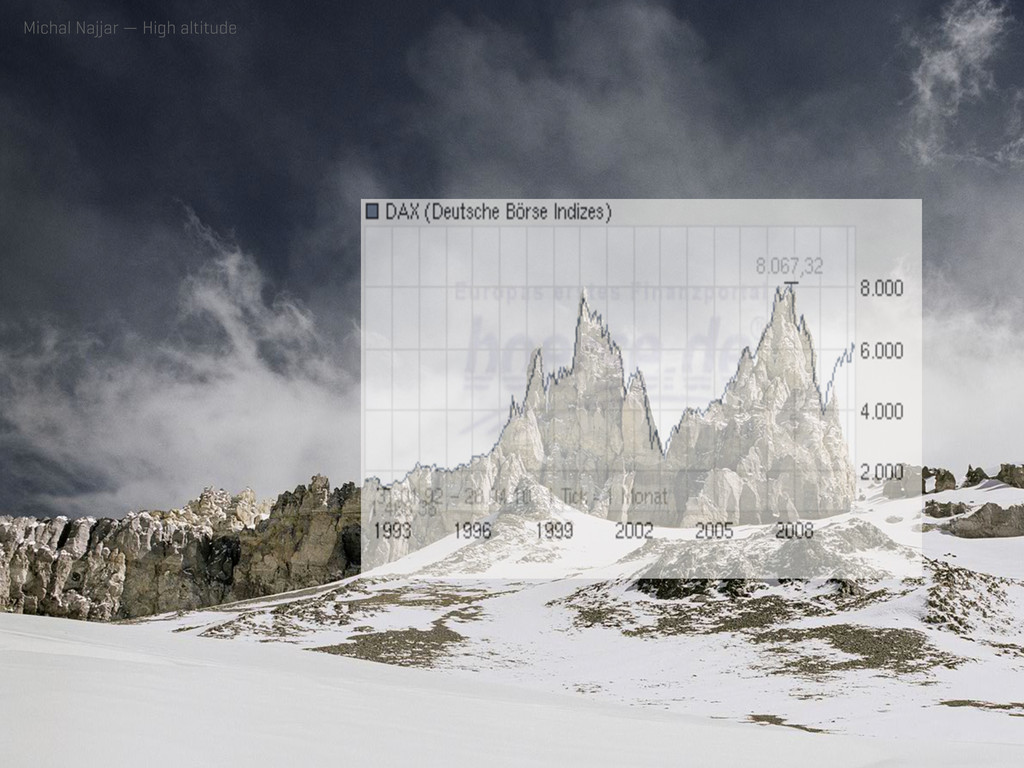
Michal Najjar — High altitude
Michal Najjar — High altitude
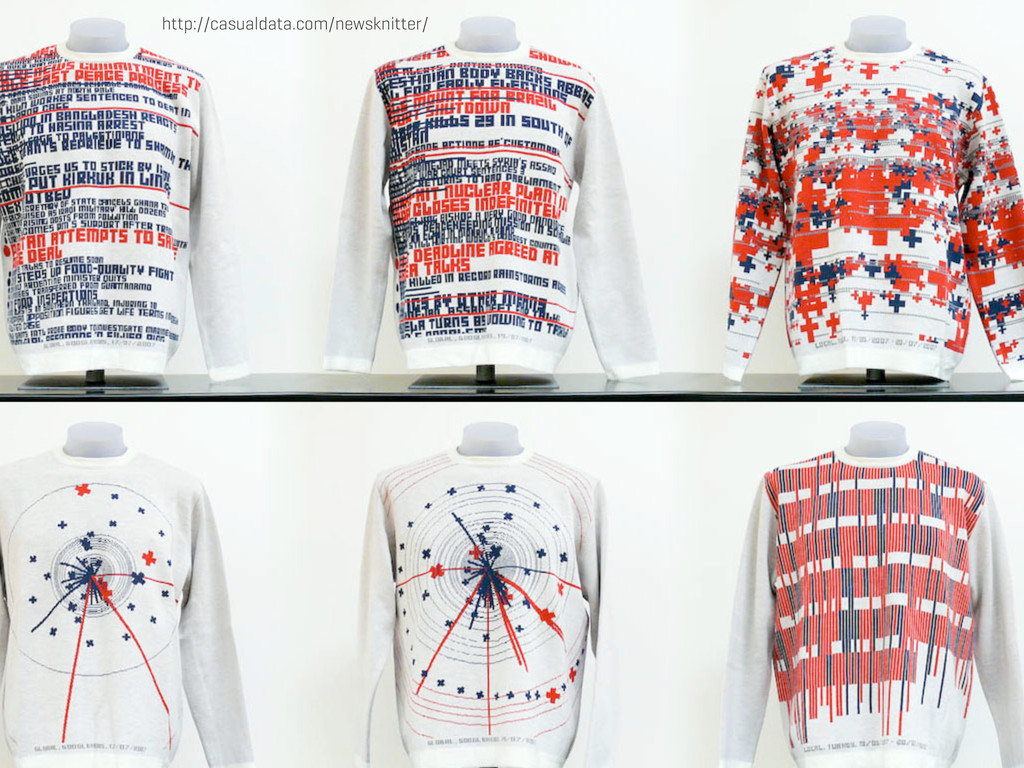
http://casualdata.com/newsknitter/
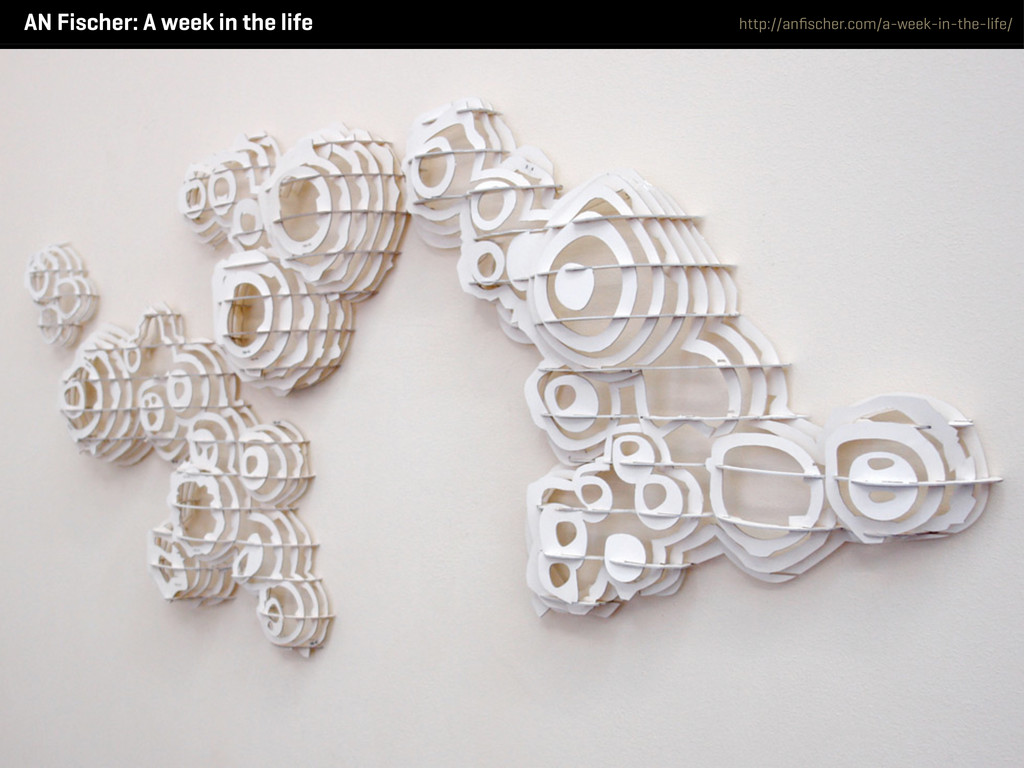
AN Fischer: A week in the life http://anfischer.com/a-week-in-the-life/
None
DATA CUISINE
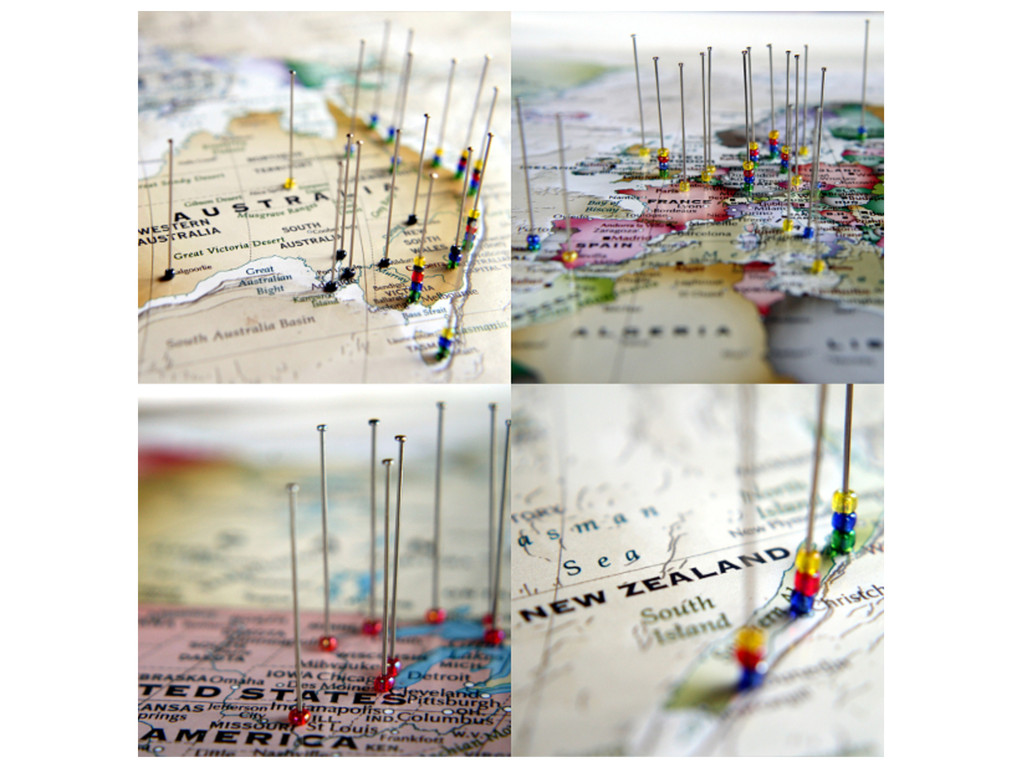
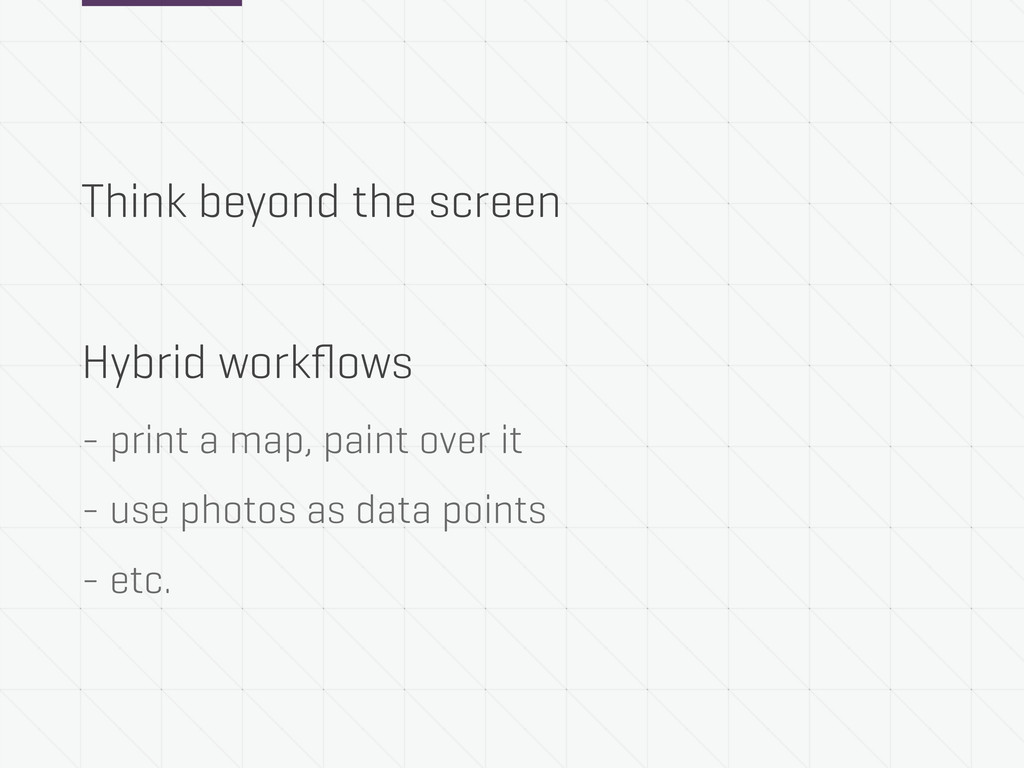
Think beyond the screen Hybrid workflows - print a map,
paint over it - use photos as data points - etc.