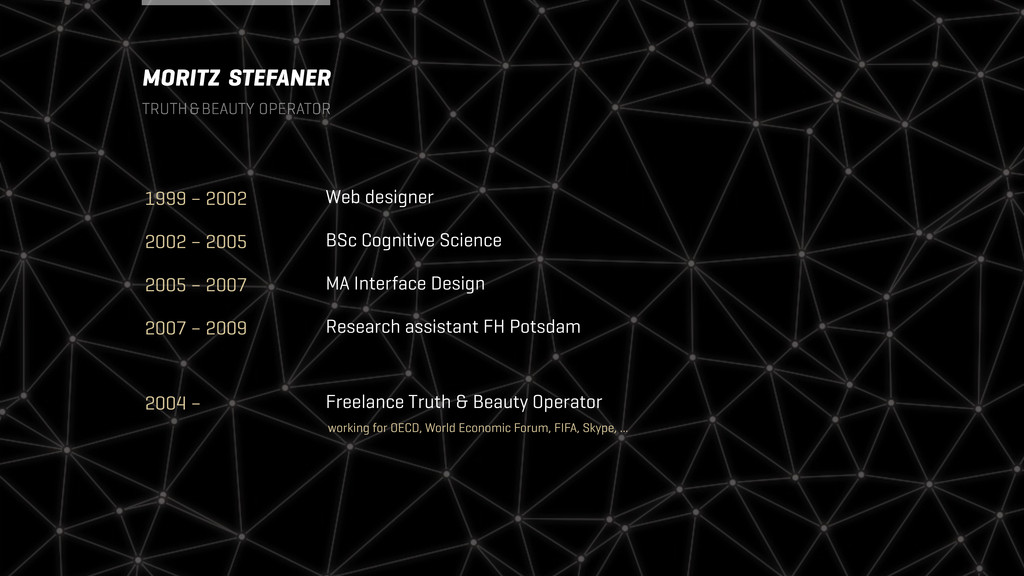
2005 – 2007 2007 – 2009 2004 – working for OECD, World Economic Forum, FIFA, Skype, ... Web designer BSc Cognitive Science MA Interface Design Research assistant FH Potsdam Freelance Truth & Beauty Operator
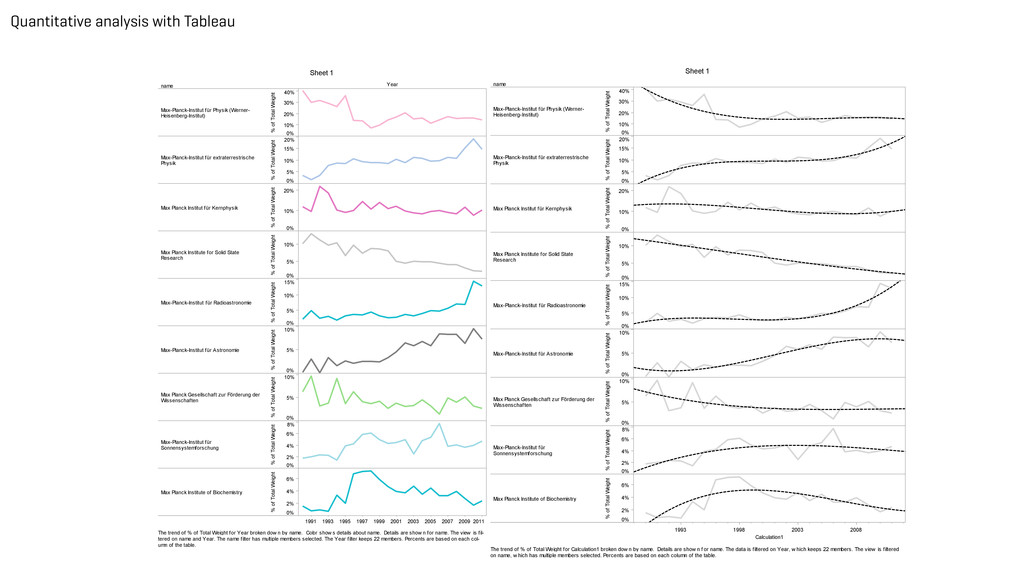
1999 2001 2003 2005 2007 2009 2011 Max-Planck-Institut für Physik (Werner- Heisenberg-Institut) Max-Planck-Institut für extraterrestrische Physik Max Planck Institut für Kernphysik Max Planck Institute for Solid State Research Max-Planck-Institut für Radioastronomie Max-Planck-Institut für Astronomie Max Planck Gesellschaft zur Förderung der Wissenschaften Max-Planck-Institut für Sonnensystemforschung Max Planck Institute of Biochemistry Max-Planck-Institut für Astrophysik 0% 10% 20% 30% 40% % of Total Weight 0% 5% 10% 15% 20% % of Total Weight 0% 10% 20% % of Total Weight 0% 5% 10% % of Total Weight 0% 5% 10% 15% % of Total Weight 0% 5% 10% % of Total Weight 0% 5% 10% % of Total Weight 0% 2% 4% 6% 8% % of Total Weight 0% 2% 4% 6% % of Total Weight Sheet 1 name Max-Planck-Institut für Physik (Werner-Heisenberg-Institut) Max-Planck-Institut für extraterrestrische Physik Max Planck Institut für Kernphysik Max Planck Institute for Solid State Research Max-Planck-Institut für Radioastronomie Max-Planck-Institut für Astronomie Max Planck Gesellschaft zur Förderung der Wissenschaften Max-Planck-Institut für Sonnensystemforschung Max Planck Institute of Biochemistry Max-Planck-Institut für Astrophysik Max Planck Institute for Chemistry (Otto Hahn Institute) Max Planck Institute for Molecular Genetics Max Planck Institute for Polymer Research Max-Planck-Institut für Plasmaphysik Max Planck Institute for Metals Research Fritz Haber Institute of the Max Planck Society Max Planck Institute for Biophysical Chemistry (Karl Friedrich Bonhoeffer Institute) Max-Planck-Institut für Quantenoptik Max-Planck-Institute for the Physics of Complex Systems Max-Planck-Institut für Psychiatrie The trend of % of Total Weight for Year broken dow n by name. Color show s details about name. Details are show n for name. The view is fil- tered on name and Year. The name filter has multiple members selected. The Year filter keeps 22 members. Percents are based on each col- umn of the table. name 1993 1998 2003 2008 Calculation1 Max-Planck-Institut für Physik (Werner- Heisenberg-Institut) Max-Planck-Institut für extraterrestrische Physik Max Planck Institut für Kernphysik Max Planck Institute for Solid State Research Max-Planck-Institut für Radioastronomie Max-Planck-Institut für Astronomie Max Planck Gesellschaft zur Förderung der Wissenschaften Max-Planck-Institut für Sonnensystemforschung Max Planck Institute of Biochemistry Max-Planck-Institut für Astrophysik 0% 10% 20% 30% 40% % of Total Weight 0% 5% 10% 15% 20% % of Total Weight 0% 10% 20% % of Total Weight 0% 5% 10% % of Total Weight 0% 5% 10% 15% % of Total Weight 0% 5% 10% % of Total Weight 0% 5% 10% % of Total Weight 0% 2% 4% 6% 8% % of Total Weight 0% 2% 4% 6% % of Total Weight Sheet 1 The trend of % of Total Weight for Calculation1 broken dow n by name. Details are show n f or name. The data is filtered on Year, w hich keeps 22 members. The view is filtered on name, w hich has multiple members selected. Percents are based on each column of the table.
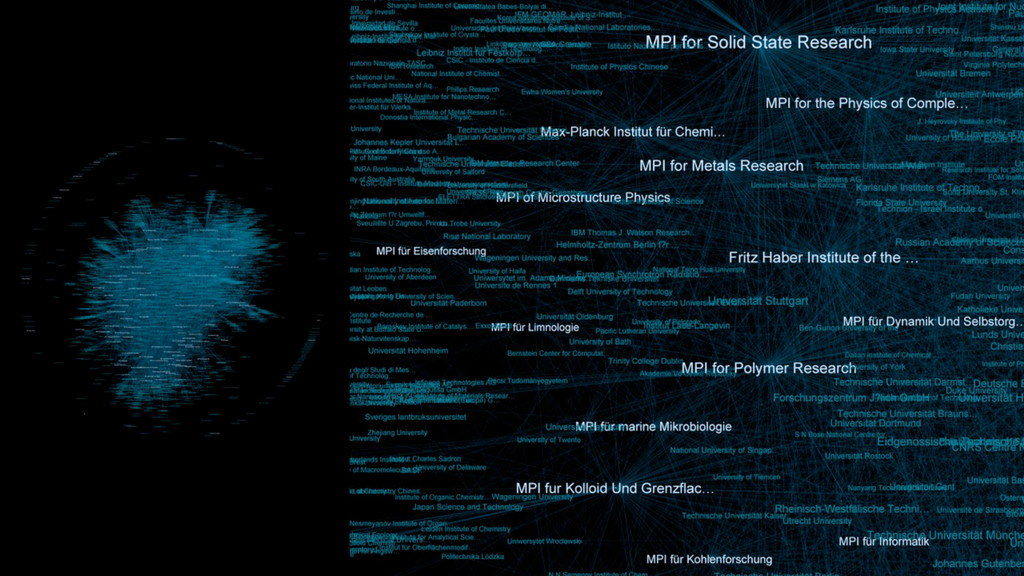
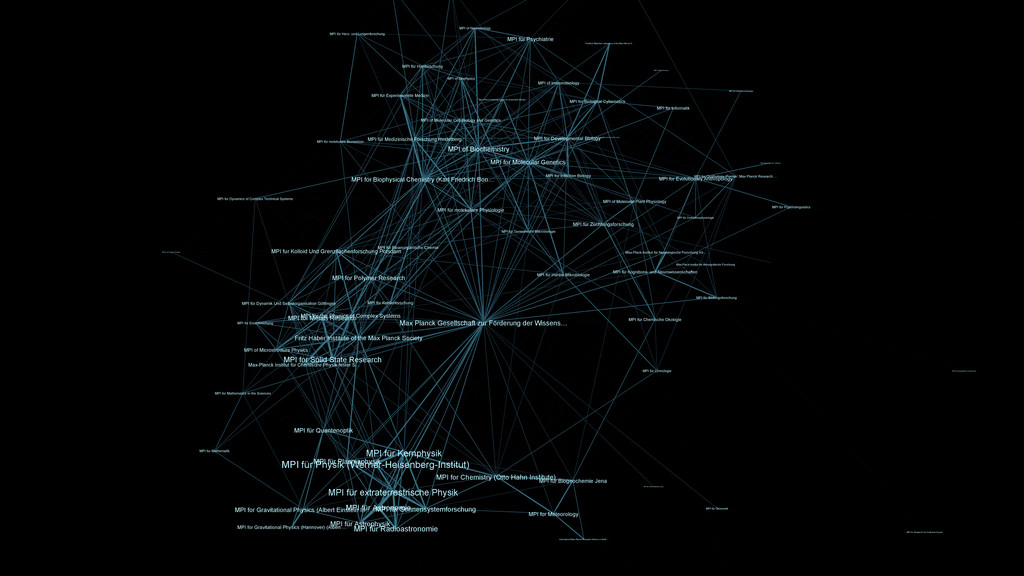
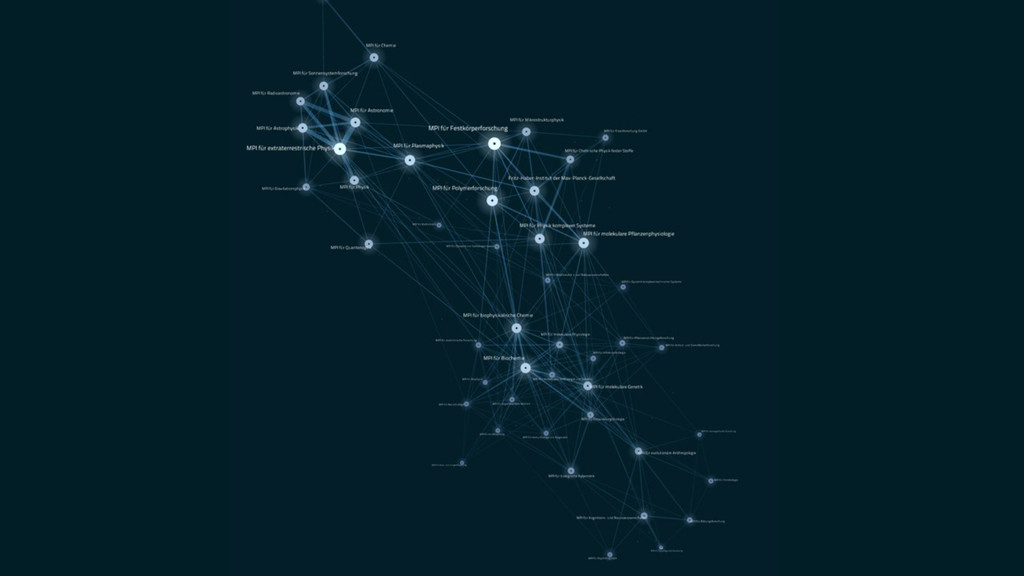
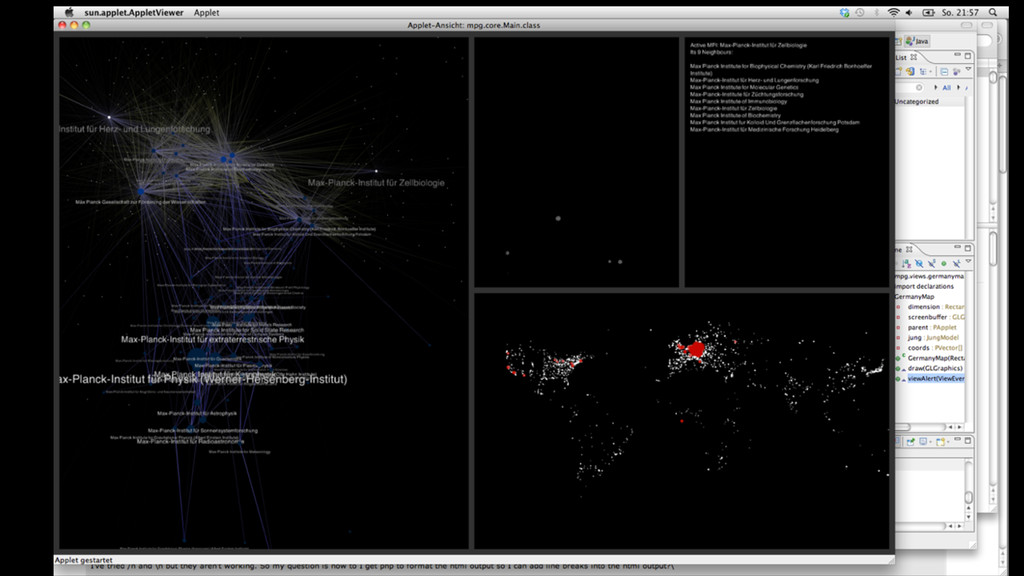
Kernphysik MPI für Radioastronomie MPI für Astronomie MPI for Solid State Research MPI für Astrophysik MPI für Sonnensystemforschung Max Planck Gesellschaft zur Förderung der Wissens… MPI für Plasmaphysik MPI for Chemistry (Otto Hahn Institute) MPI of Biochemistry MPI for Metals Research MPI for Molecular Genetics MPI for Polymer Research Fritz Haber Institute of the Max Planck Society MPI for Biophysical Chemistry (Karl Friedrich Bon… MPI für Quantenoptik MPI for Gravitational Physics (Albert Einstein In… MPI for the Physics of Complex Systems MPI fur Kolloid Und Grenzflachenforschung Potsdam MPI für Psychiatrie MPI for Meteorology MPI für Biogeochemie Jena MPI of Microstructure Physics MPI for Evolutionary Anthropology MPI for Developmental Biology MPI for Gravitational Physics (Hannover) (Albert … Max-Planck Institut für Chemische Physik fester S… MPI für molekulare Physiologie MPI für Medizinische Forschung Heidelberg MPI für Züchtungsforschung MPI für marine Mikrobiologie MPI für Dynamik Und Selbstorganisation Göttingen MPI für Experimentelle Medizin MPI of Immunobiology MPI für Informatik MPI für Kohlenforschung MPI für Kognitions- und Neurowissenschaften MPI for Biological Cybernetics MPI of Molecular Cell Biology and Genetics MPI für Hirnforschung MPI for Infection Biology MPI fur Chemische Okologie MPI für Bioanorganische Chemie MPI of Molecular Plant Physiology MPI of Neurobiology MPI of Biophysics MPI für Eisenforschung MPI für Bildungsforschung MPI for Ornithology (Former: Max Planck Research … MPI für Terrestrische Mikrobiologie MPI for Mathematics in the Sciences MPI für Herz- und Lungenforschung Max-Plack-Institut für Neurologische Forschung Kö… MPI für molekulare Biomedizin MPI fur Mathematik MPI for Psycholinguistics MPI for Dynamics of Complex Technical Systems MPI für Limnologie Max-Plack-Institut für demografische Forschung MPI für Verhaltensphysiologie MPI für Ökonomik Friedrich Miescher Laboratory of the Max Planck S… Max-Planck-Arbeitsgruppen für strukturelle Moleku… MPI für Evolutionsbiologie International Max Planck Research School on Earth… MPI for Research On Collective Goods MPI fur Neurologische Forschung Koln MPI for the History of Science MPI für Gesellschaftsforschung MPI für Virusforschung International Max Planck Research School for Comp… Max Planck Inst. Evol. Anthropol
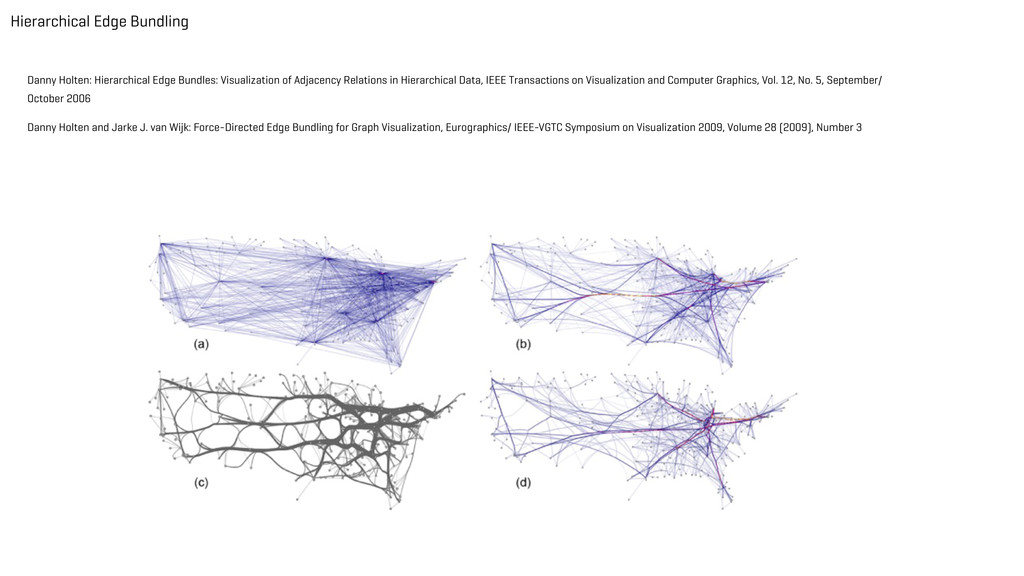
Adjacency Relations in Hierarchical Data, IEEE Transactions on Visualization and Computer Graphics, Vol. 12, No. 5, September/ October 2006 Danny Holten and Jarke J. van Wijk: Force-Directed Edge Bundling for Graph Visualization, Eurographics/ IEEE-VGTC Symposium on Visualization 2009, Volume 28 (2009), Number 3
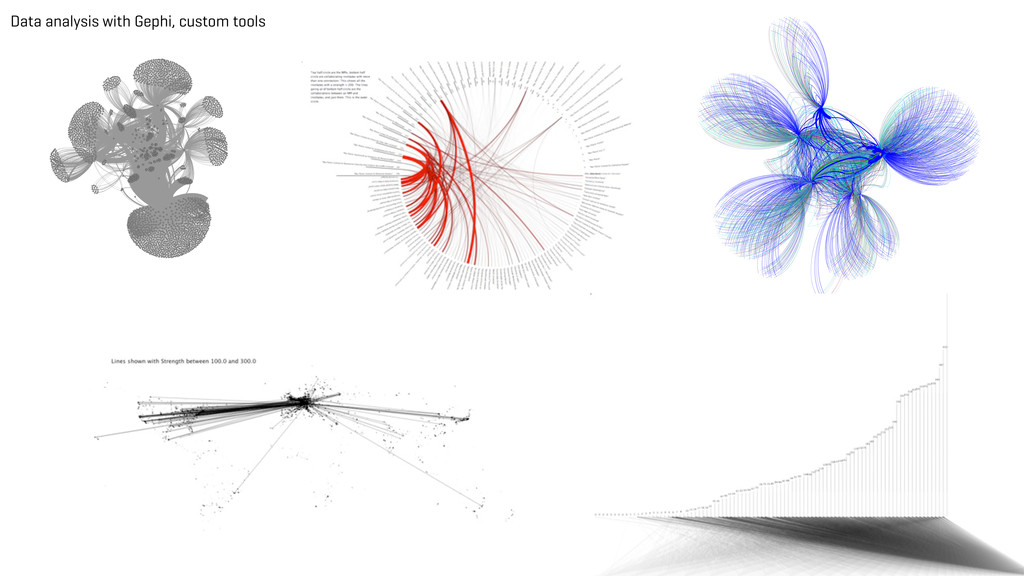
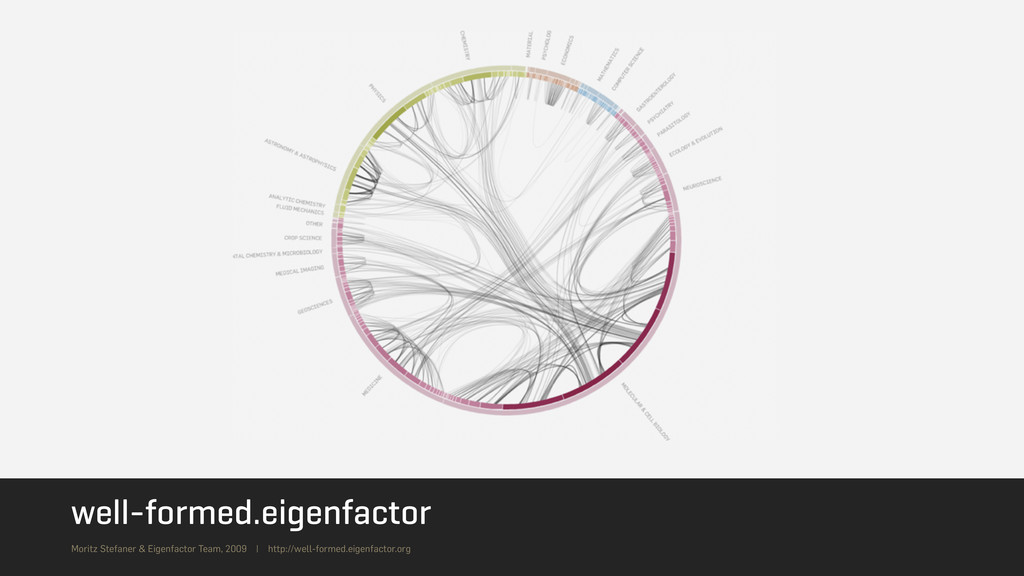
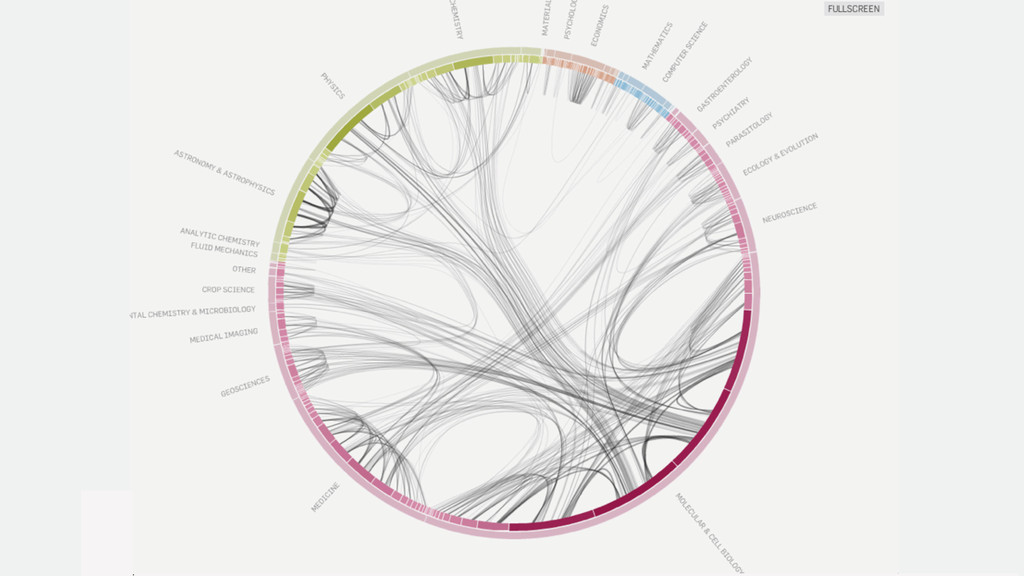
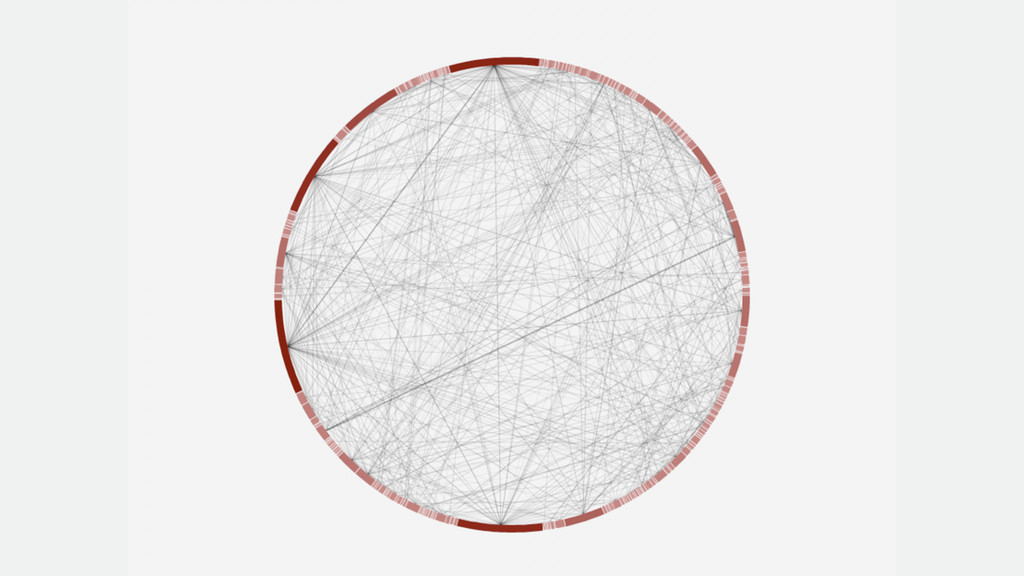
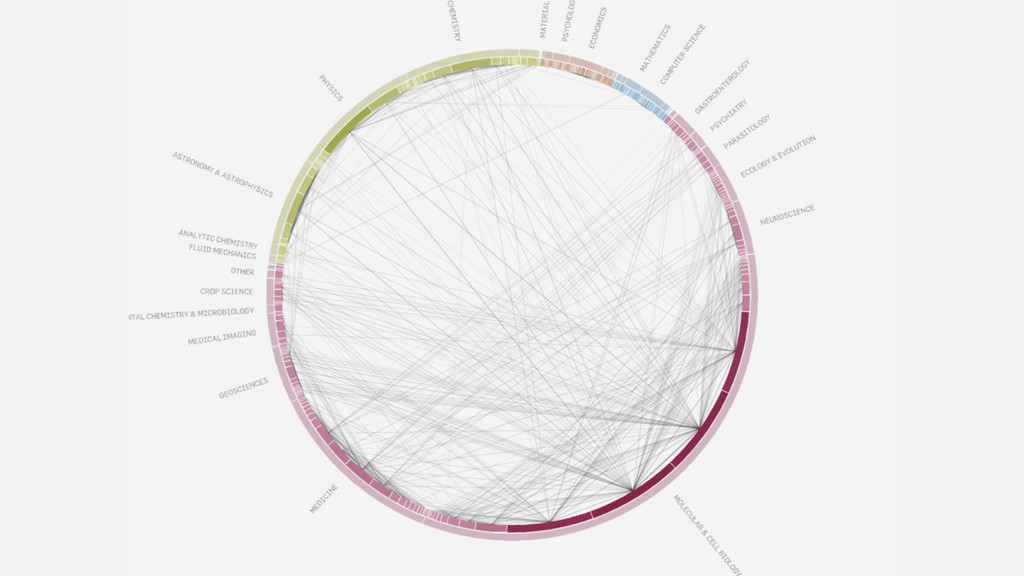
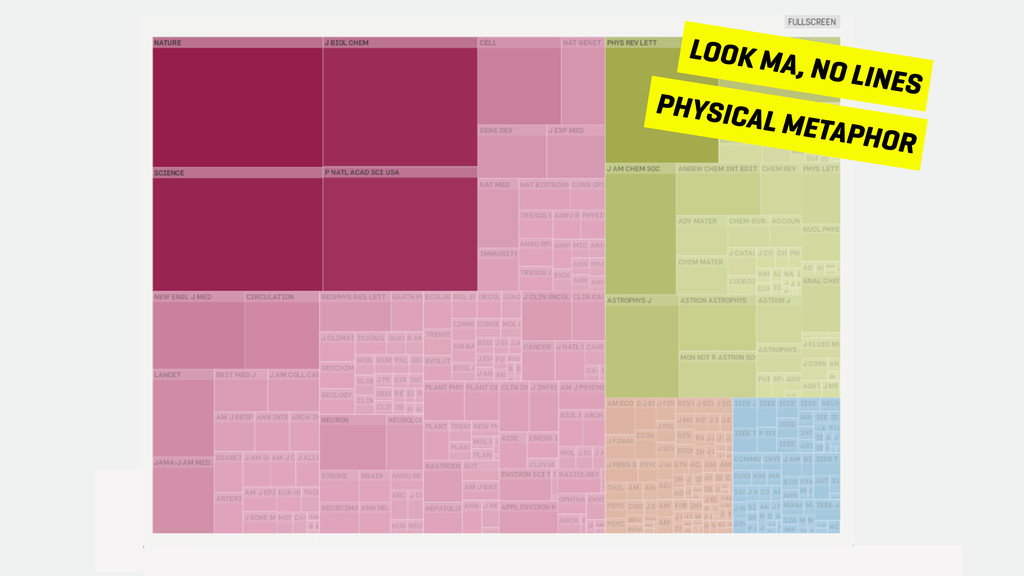
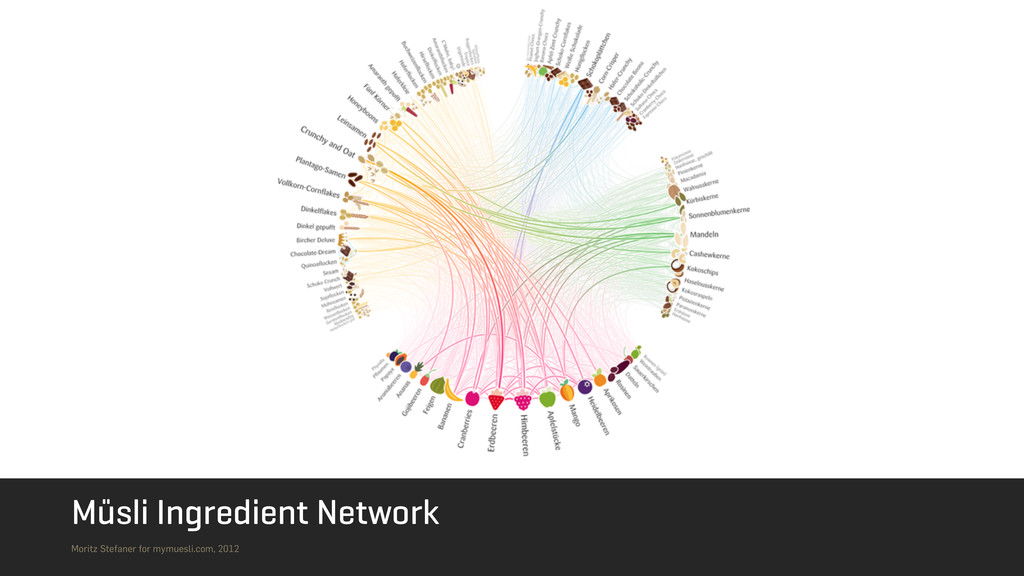
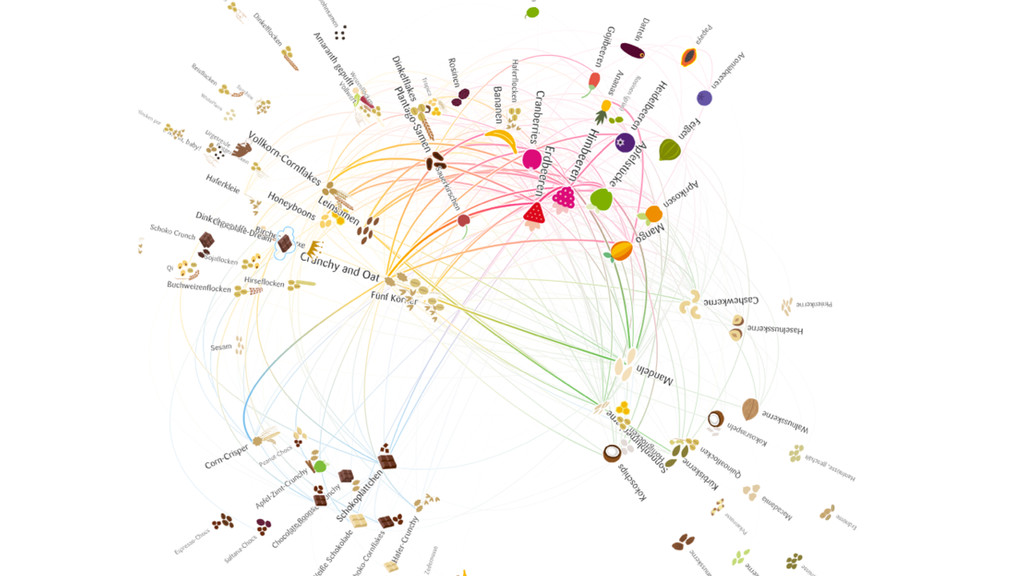
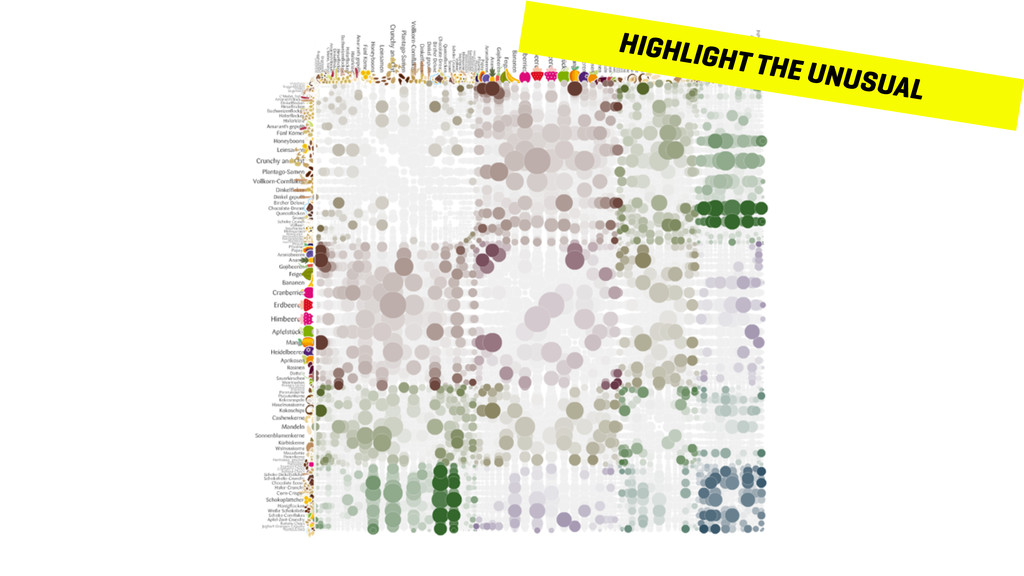
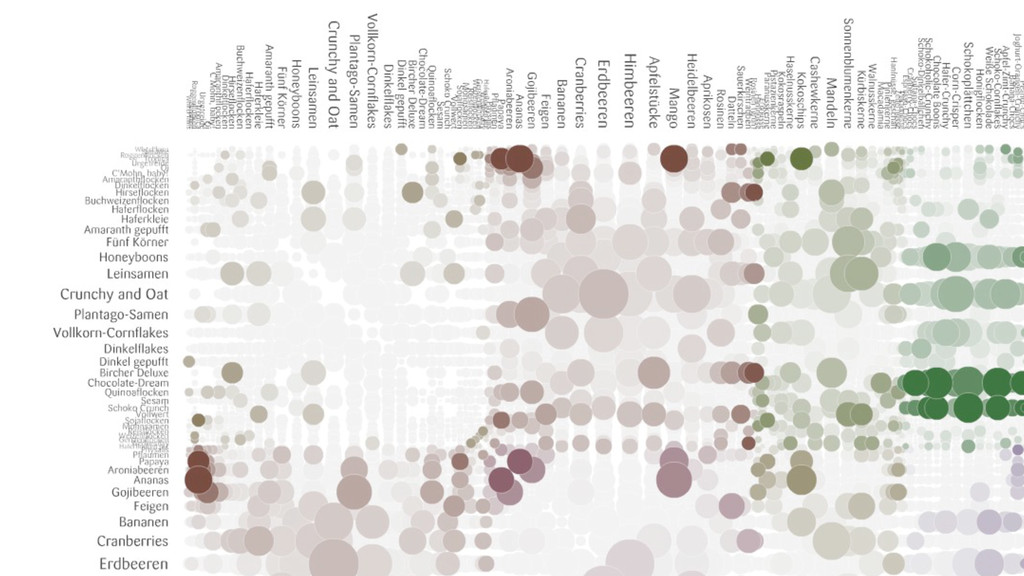
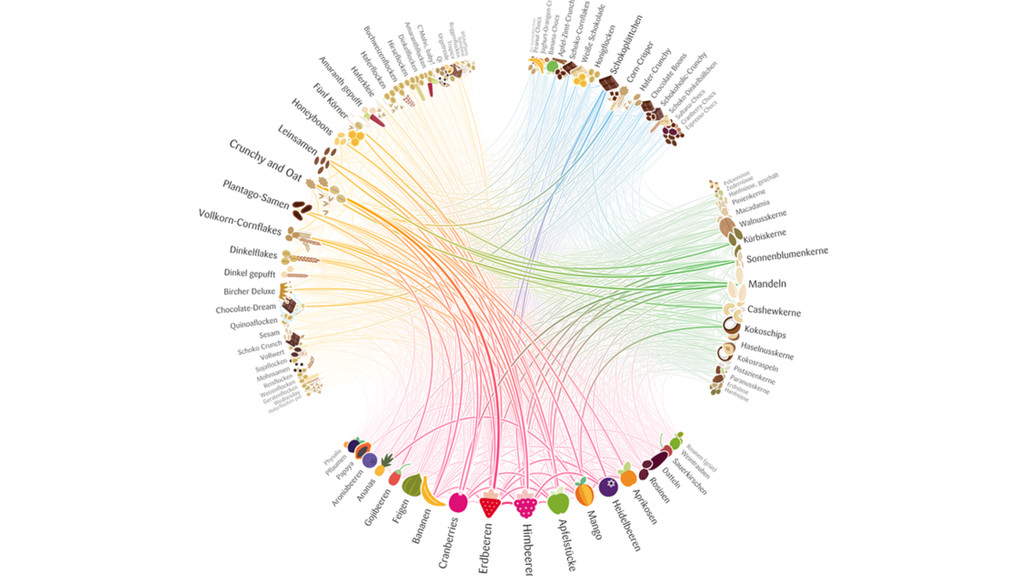
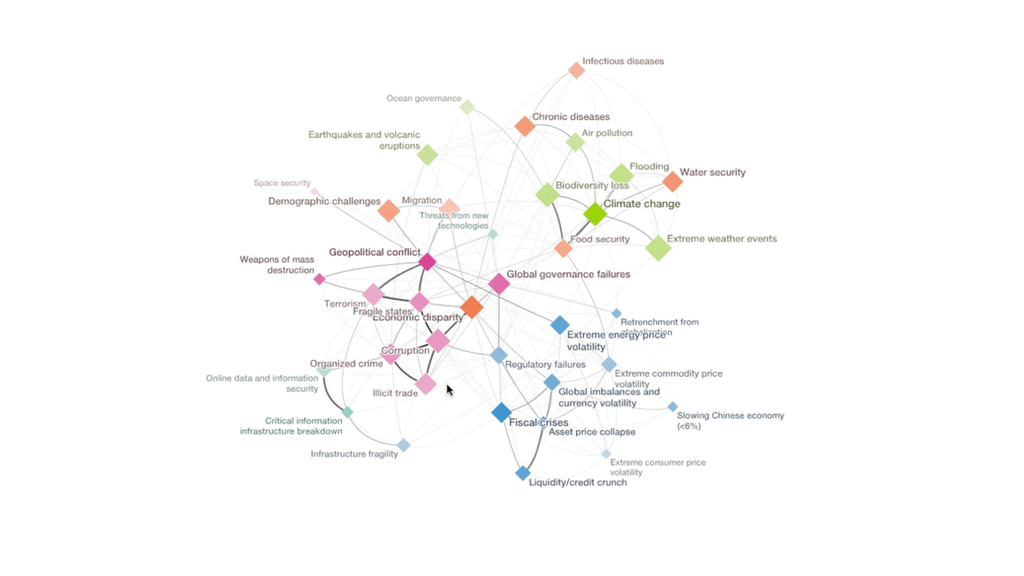
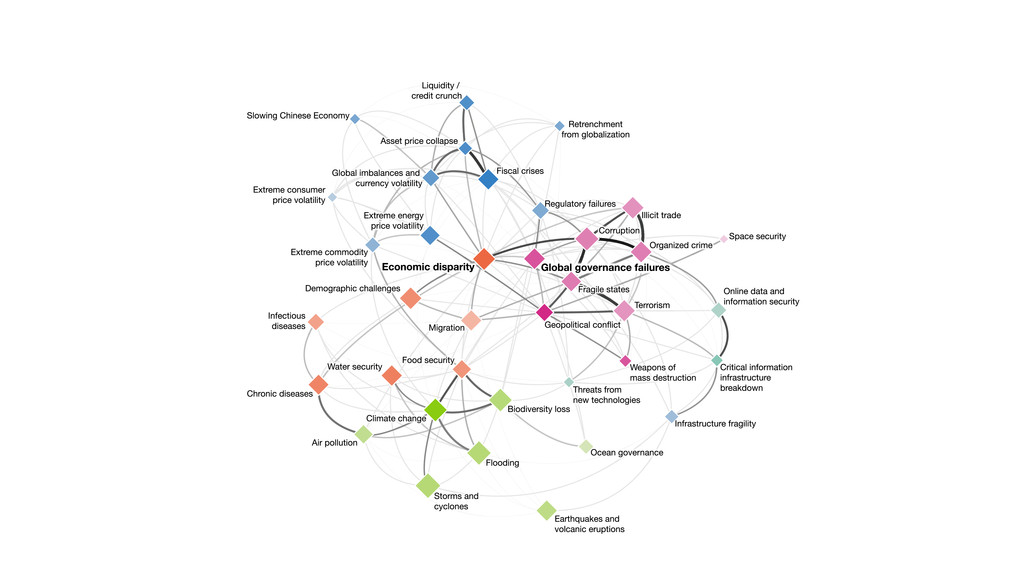
big mess Matrix Helps to see all links, identify link strengths ordering is crucial no perception of “gestalt” Radial layout Regular, aesthetic placement helps to identify individual nodes and links, ordering, grouping are crucial no relation between link length and strength CHOOSE THE RIGHT TRADE-OFF
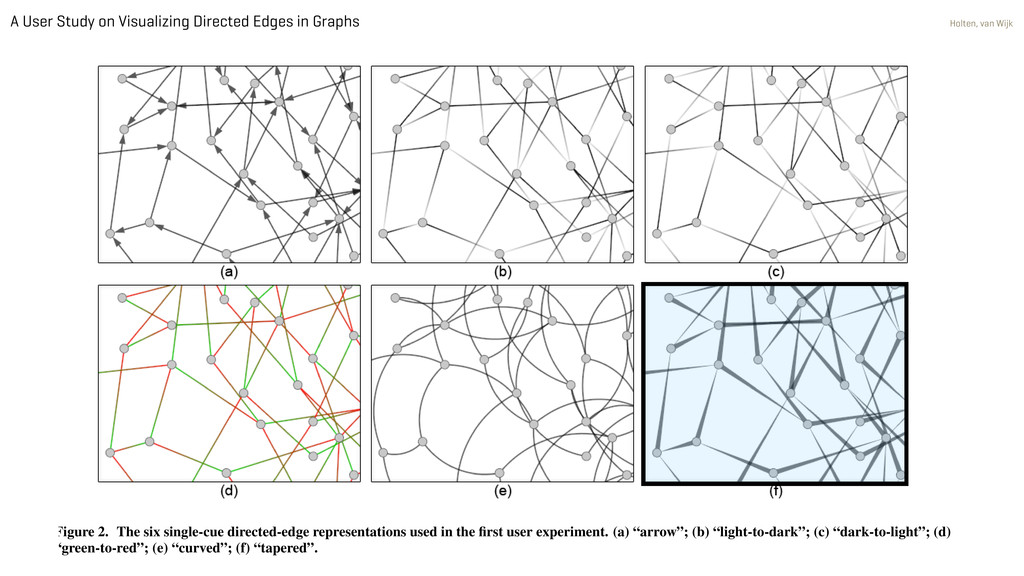
van Wijk Figure 2. The six single-cue directed-edge representations used in the first user experiment. (a) “arrow”; (b) “light-to-dark”; (c) “dark-to-light”; (d) “green-to-red”; (e) “curved”; (f) “tapered”.
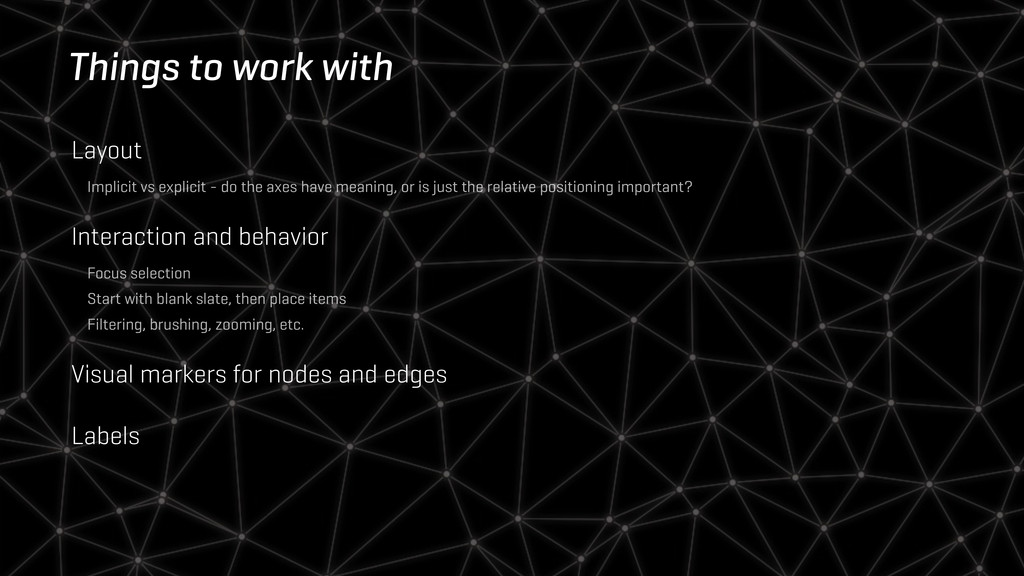
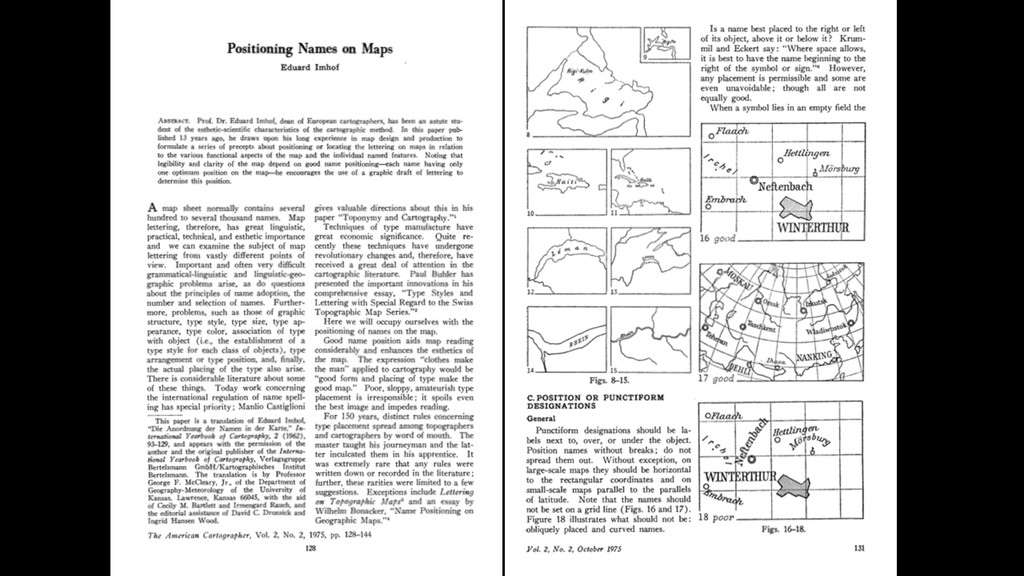
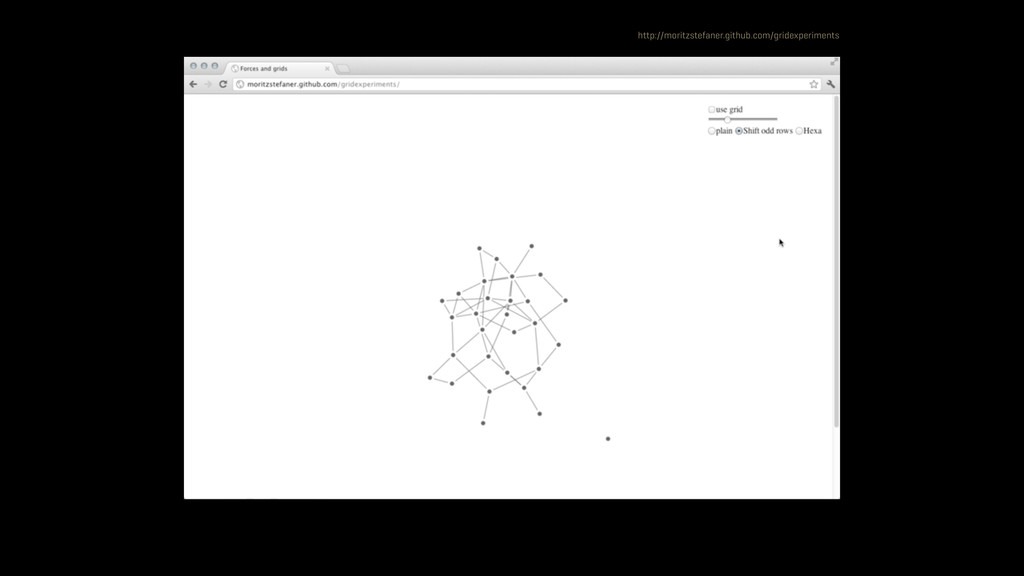
the axes have meaning, or is just the relative positioning important? Interaction and behavior Focus selection Start with blank slate, then place items Filtering, brushing, zooming, etc. Visual markers for nodes and edges Labels
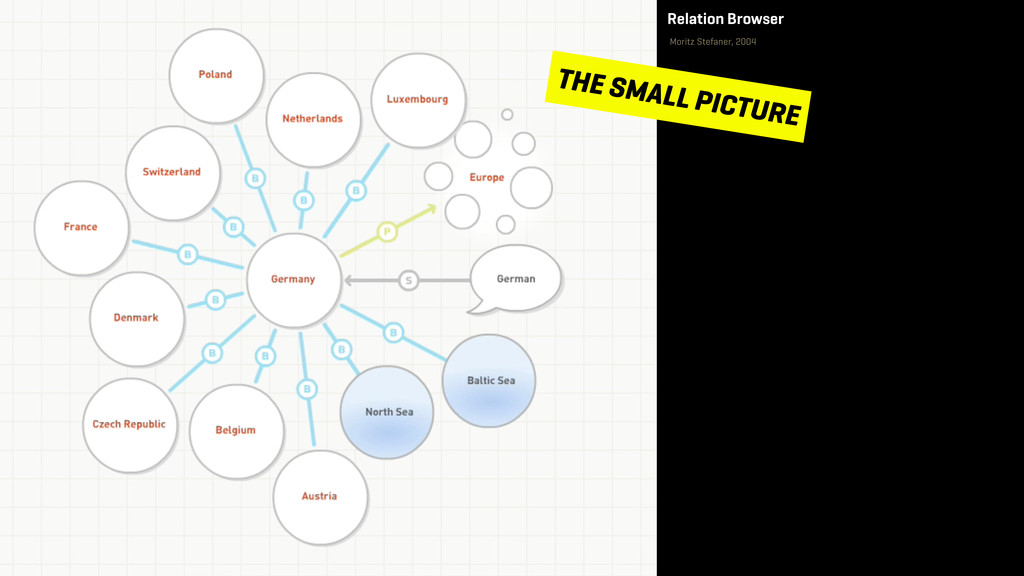
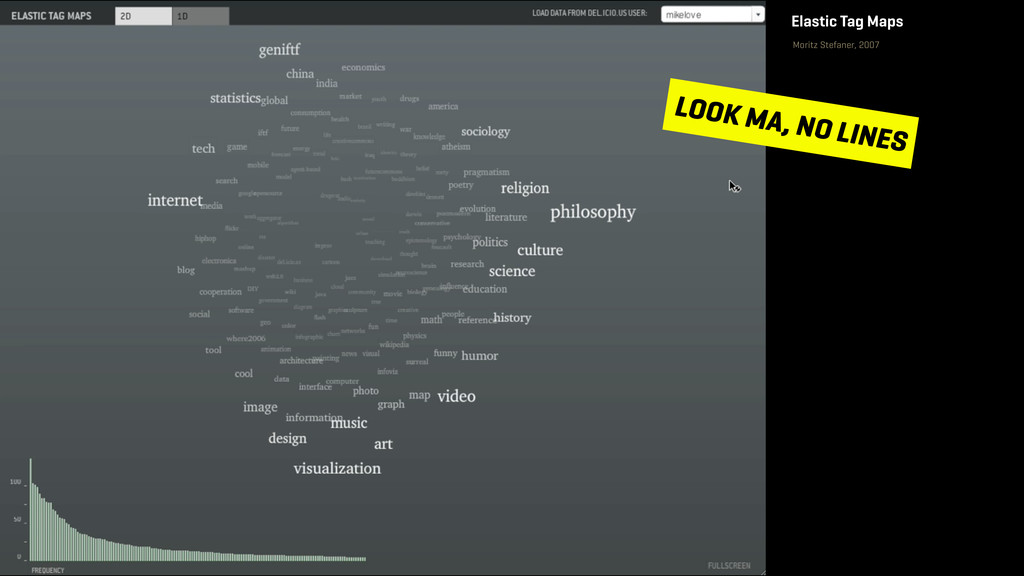
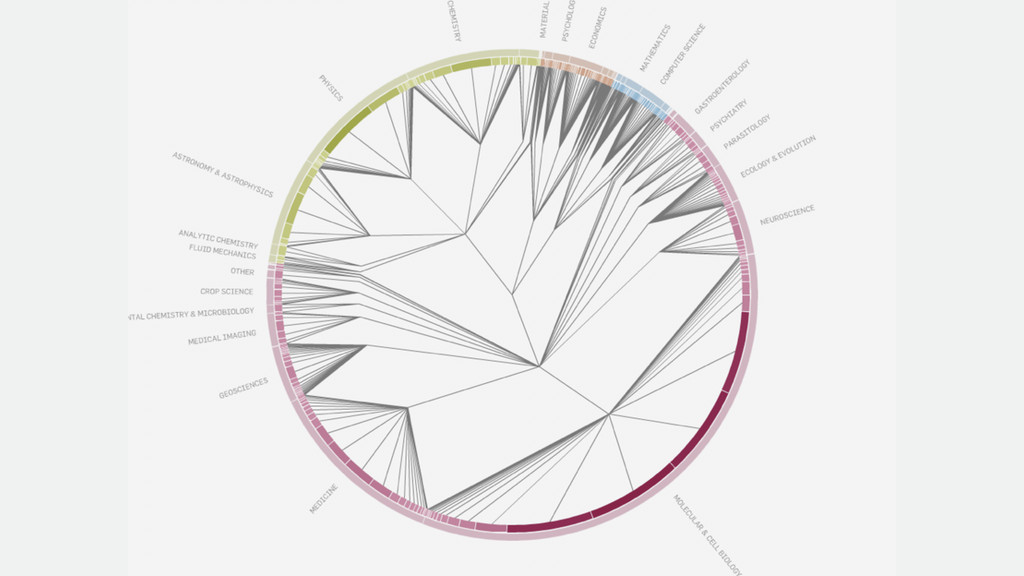
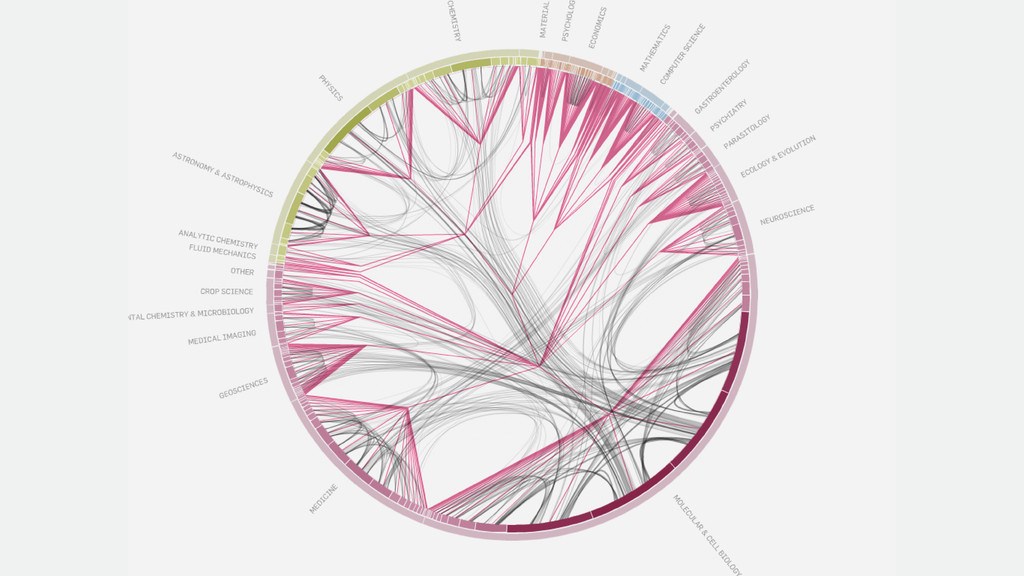
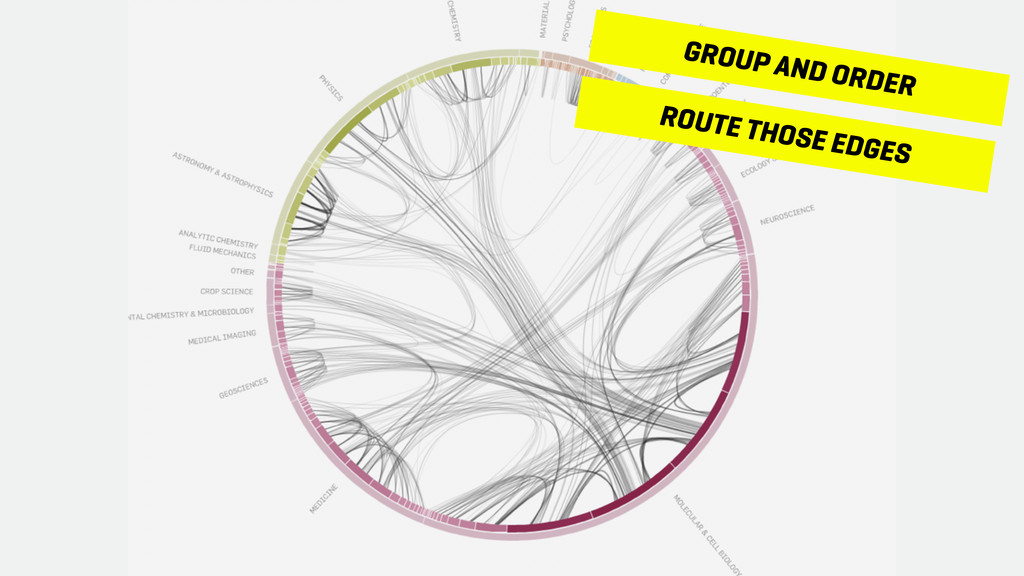
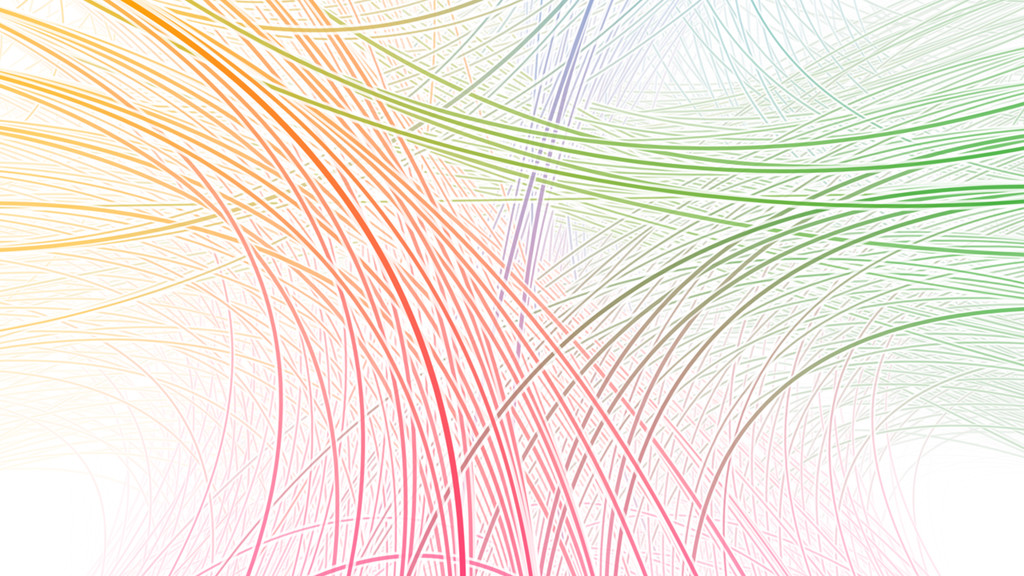
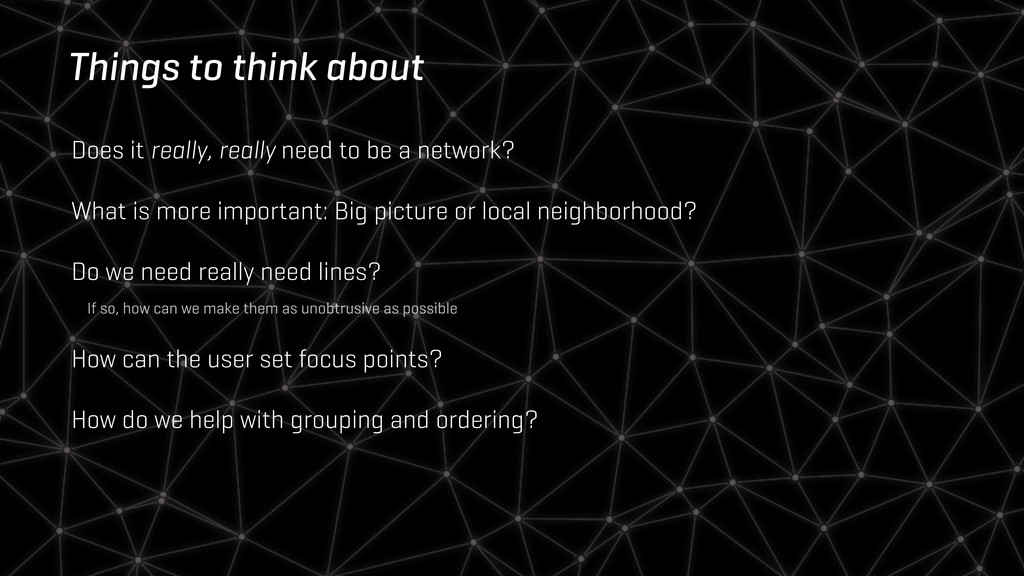
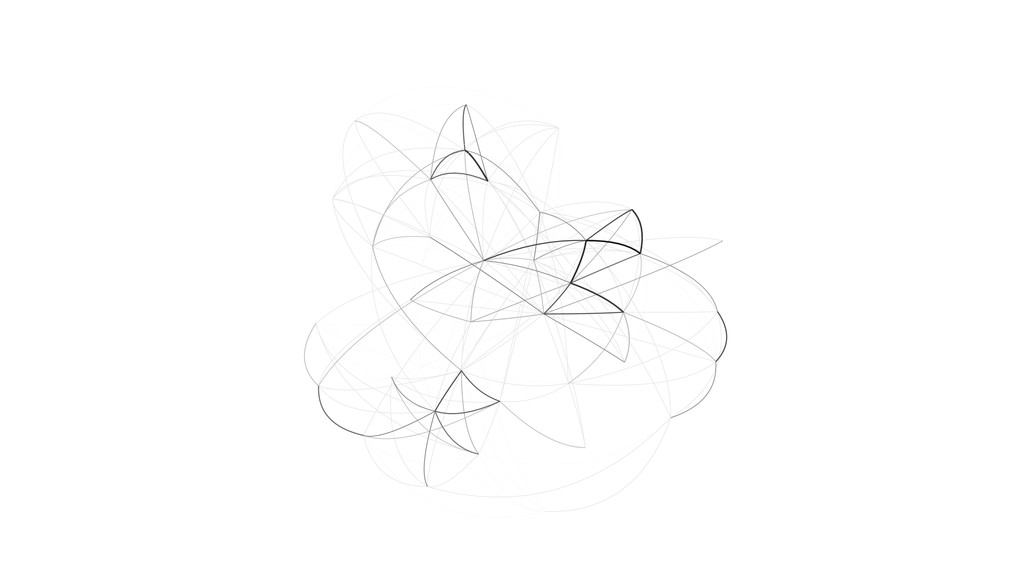
be a network? What is more important: Big picture or local neighborhood? Do we need really need lines? If so, how can we make them as unobtrusive as possible How can the user set focus points? How do we help with grouping and ordering?
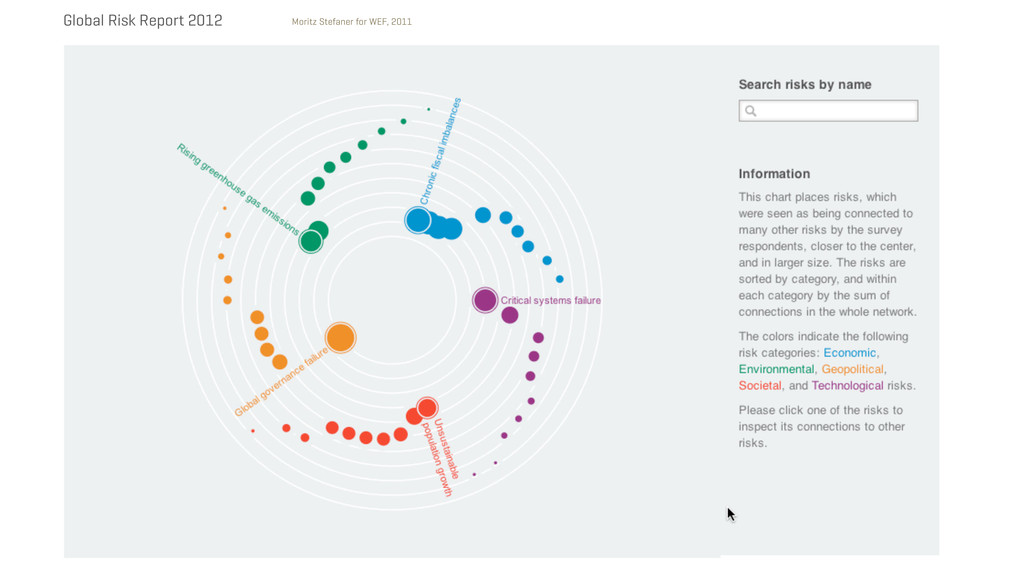
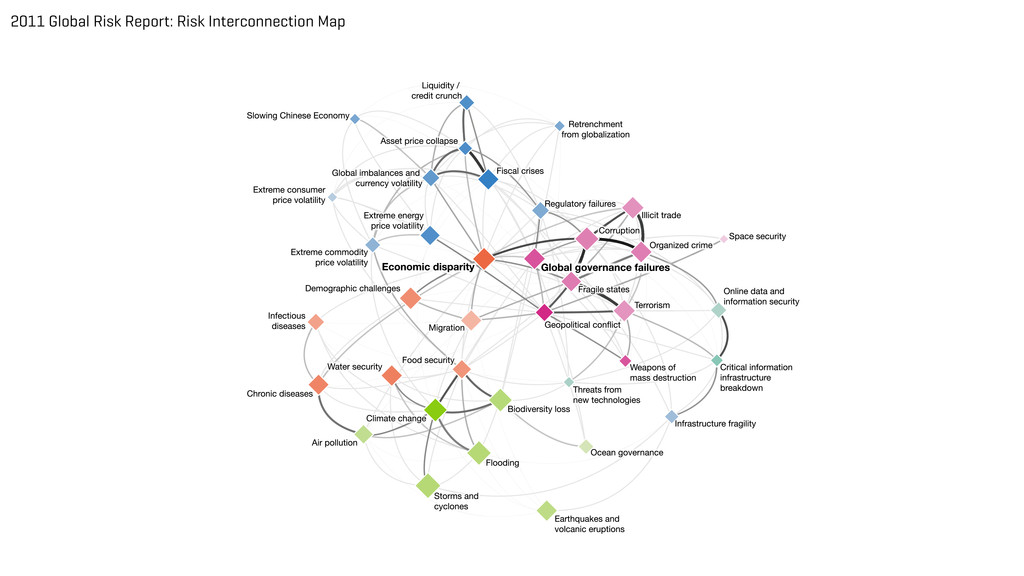
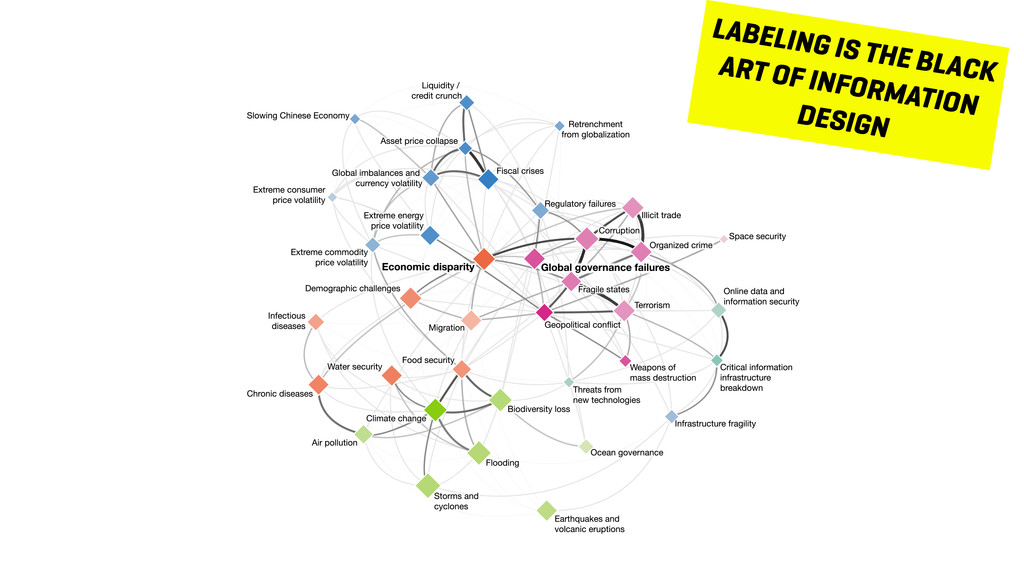
deflation Failure of climate change adaptation Irremediable pollution Mismanaged urbanization Persistent extreme weather Critical fragile states Pervasive entrenched corruption Terrorism Backlash against globalization Food shortage crises Unmanaged migration Cyber attacks Massive digital misinformation Massive incident of data fraud or theft Chronic labour market imbalances Land and waterway use mismanagement Prolonged infra– structure neglect Extreme volatility in energy and agriculture prices Severe income disparity Unforeseen negative con- sequences of regulations Major systemic financial failure Unsustainable population growth Critical systems failure Global governance failure Rising greenhouse gas emissions Chronic fiscal imbalances Mismanagement of population aging Failure of diplomatic conflict resolution
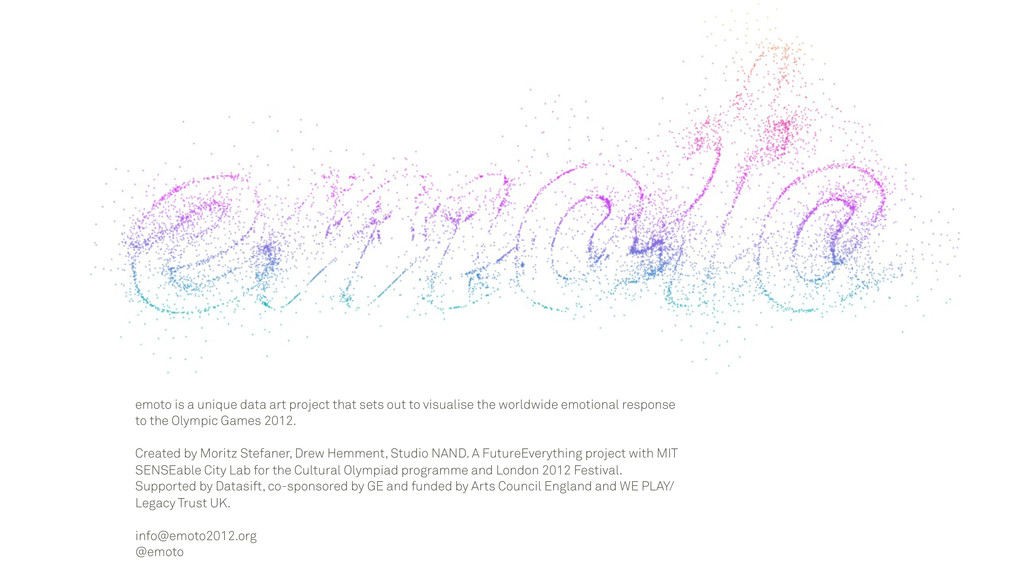
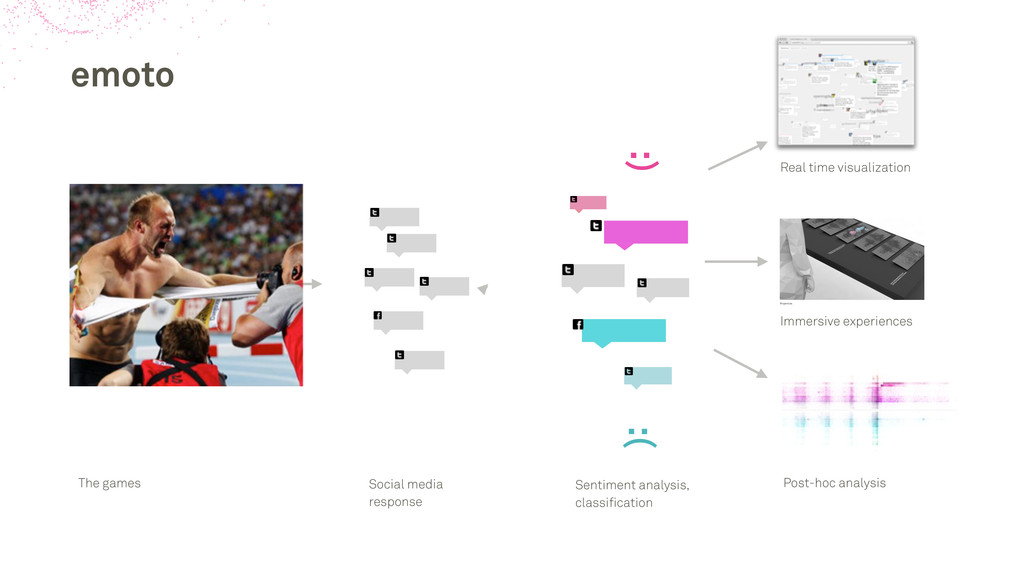
to visualise the worldwide emotional response to the Olympic Games 2012. Created by Moritz Stefaner, Drew Hemment, Studio NAND. A FutureEverything project with MIT SENSEable City Lab for the Cultural Olympiad programme and London 2012 Festival. Supported by Datasift, co-sponsored by GE and funded by Arts Council England and WE PLAY/ Legacy Trust UK. [email protected] @emoto