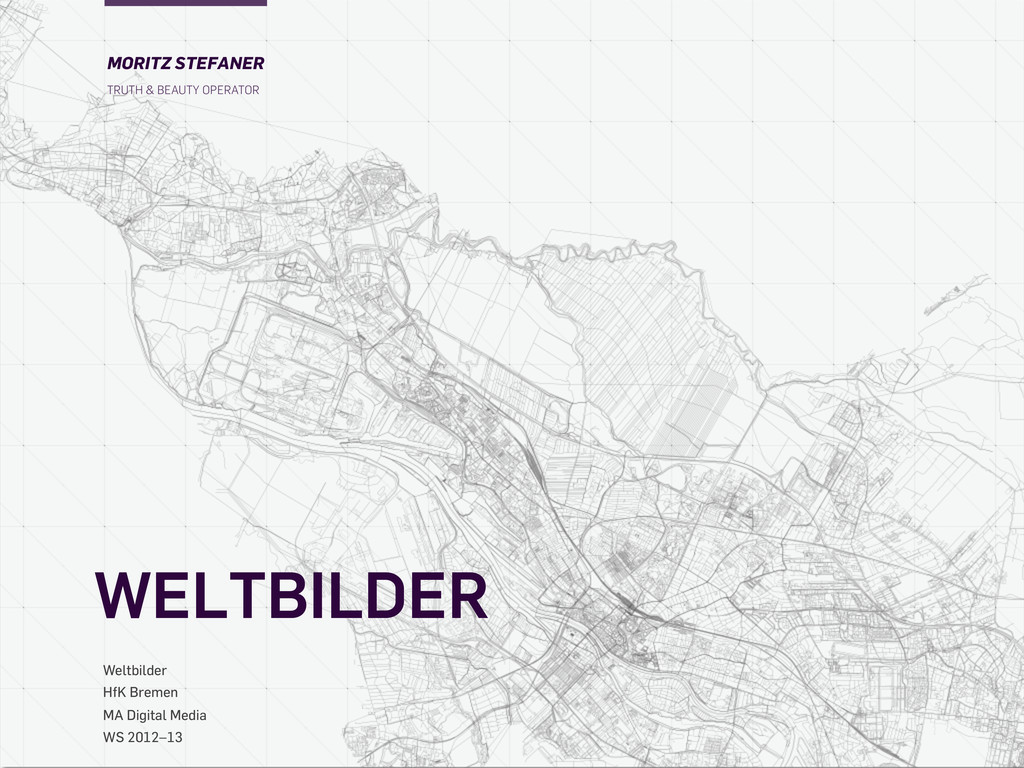
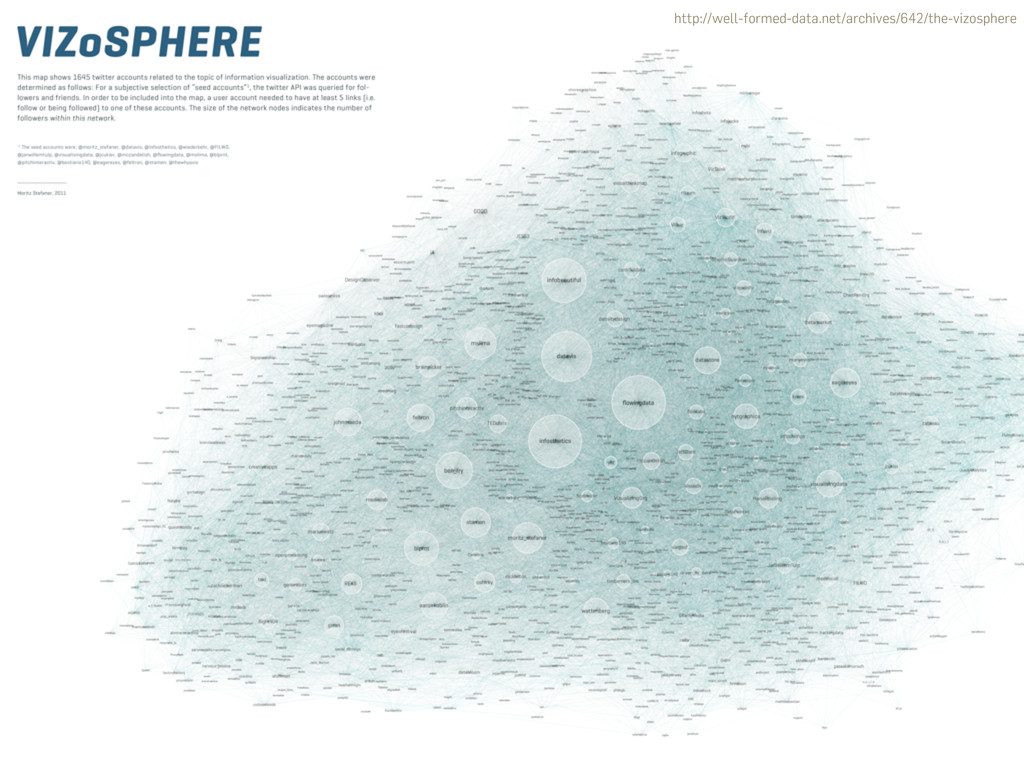
complex states of affairs in a sensual way. In this course, we will be concerned with the practice of data and information visualization: from data acquisition and manipulation over visual encoding to interaction patterns. From a design point of view, we will especially examine the cultural role of measuring and “picturing” the world: How do we create world views from data— and what is the designer’s role in this context?
presentation on a paper or person List will be made available A data visualization project Alone or in teams of up to three -- We meet in class on 8 full days in Feb and March 2013.
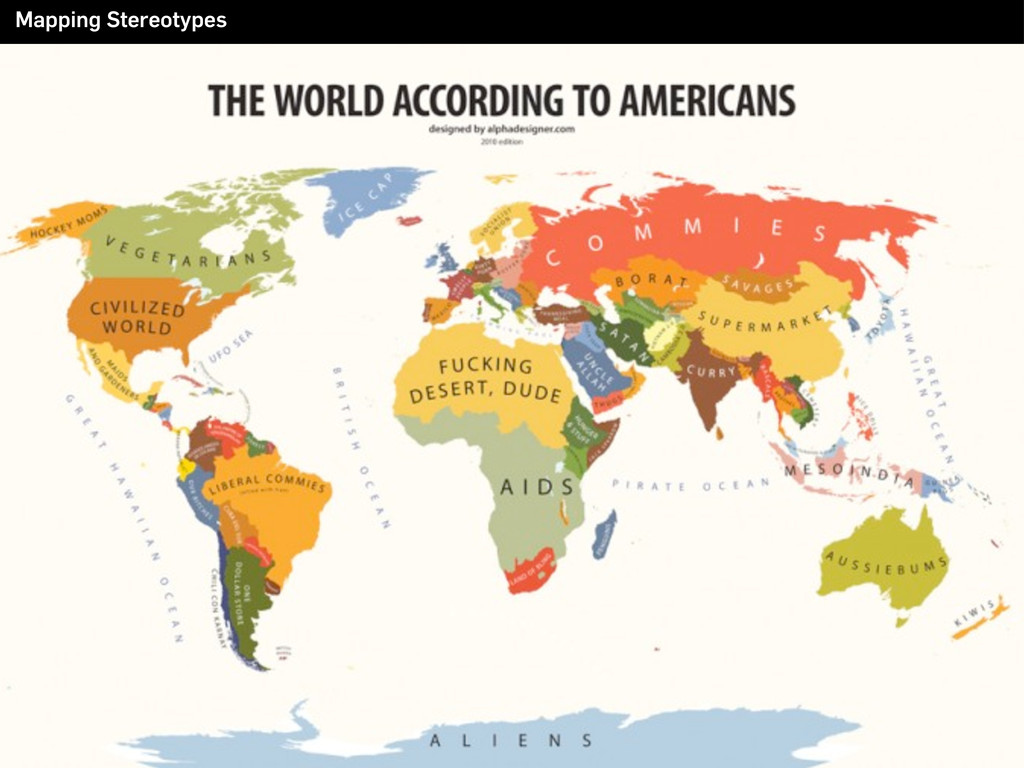
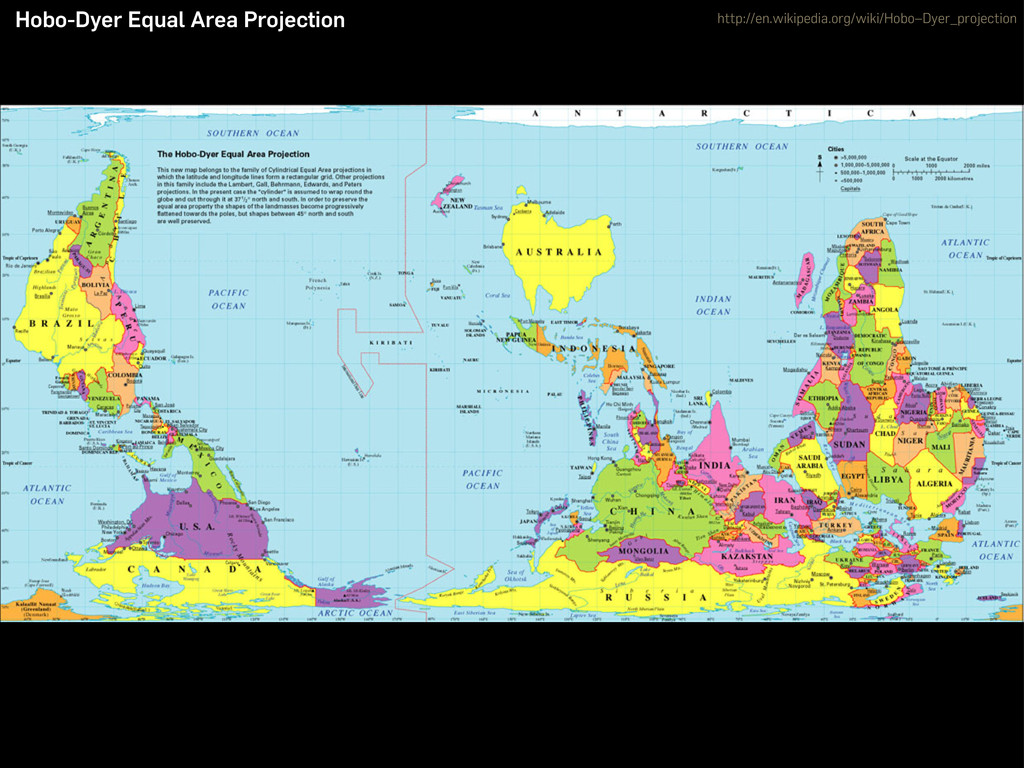
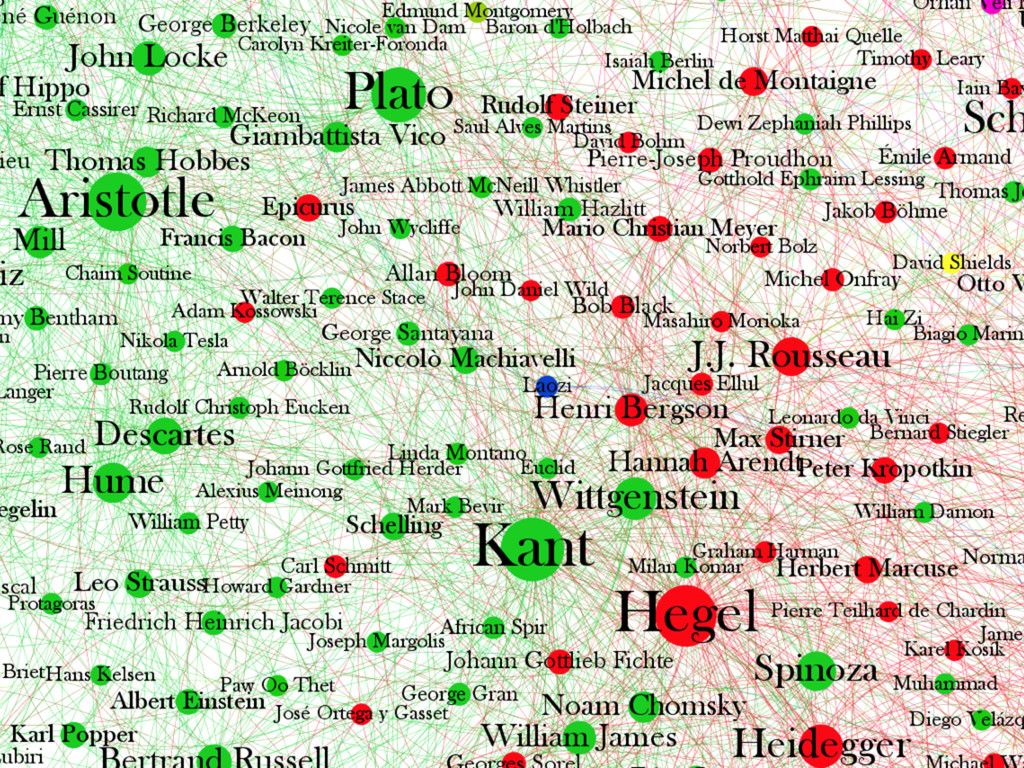
of…” Question visual conventions and the prejudices and implicit assumptions that come with them Map how people think about the world Make something that changes how people think about the world