Upgrade to Pro — share decks privately, control downloads, hide ads and more …

Connected Flipper

Connected Flipper

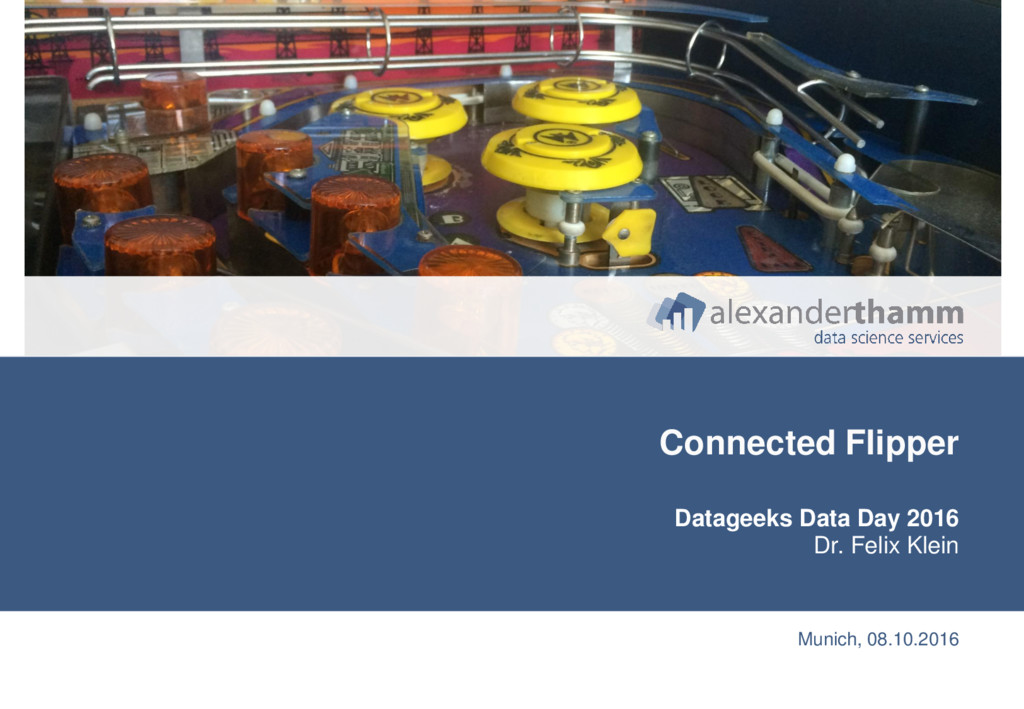
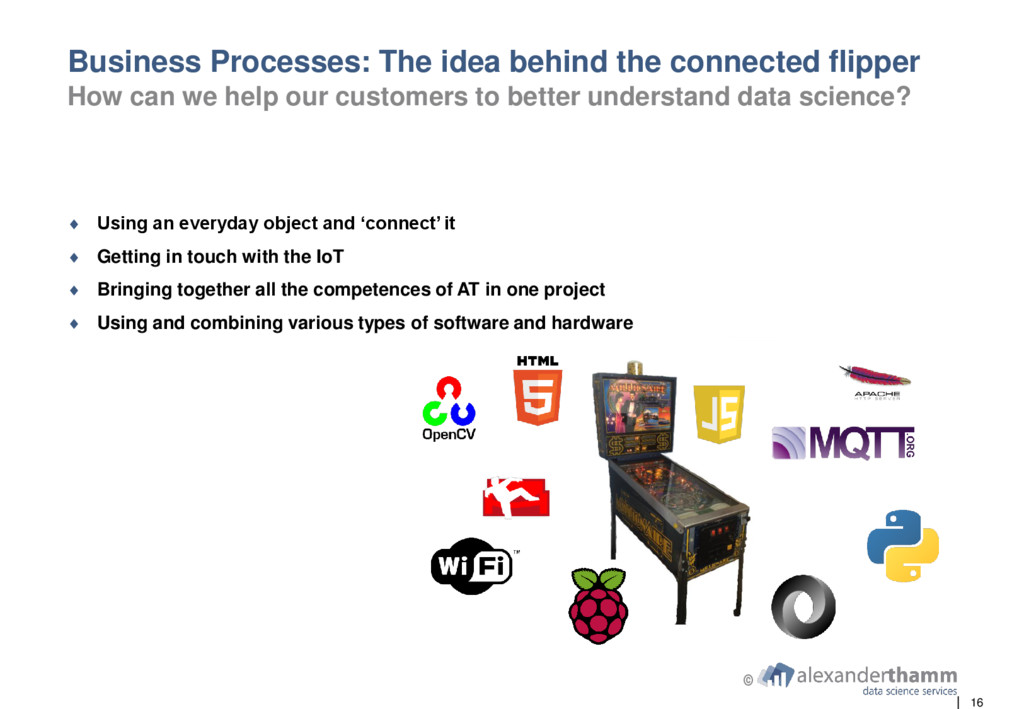
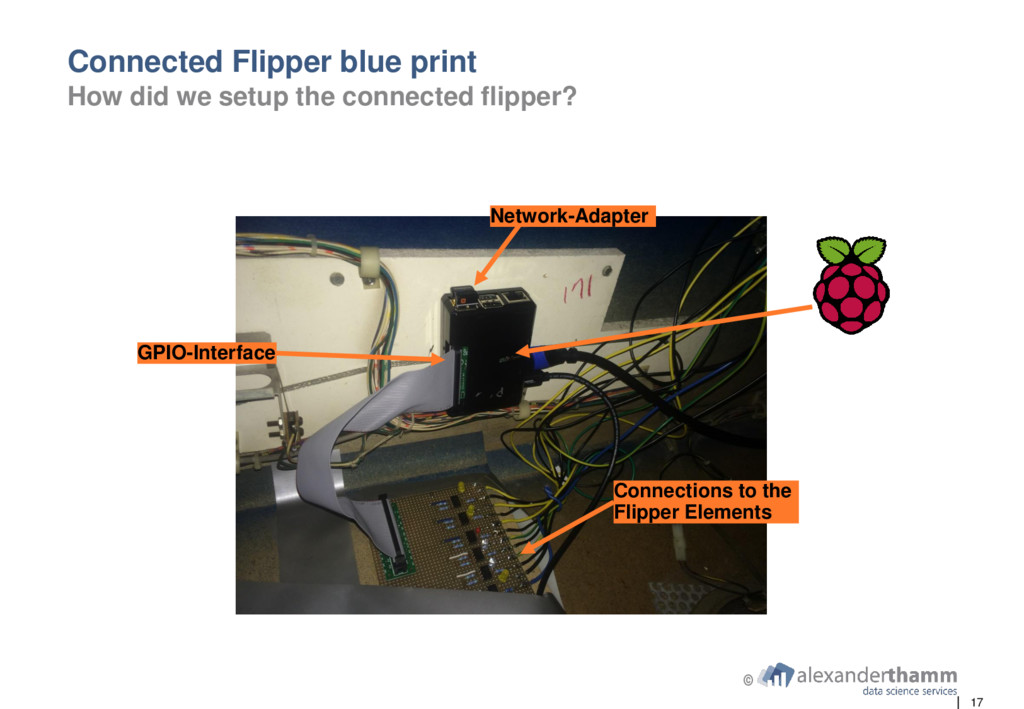
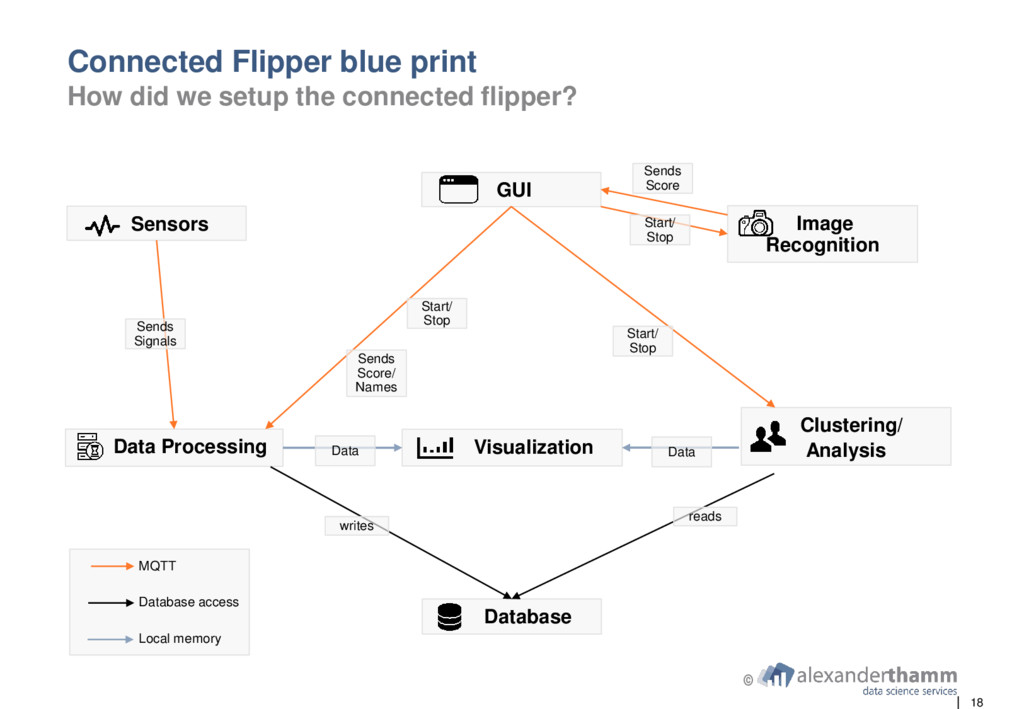
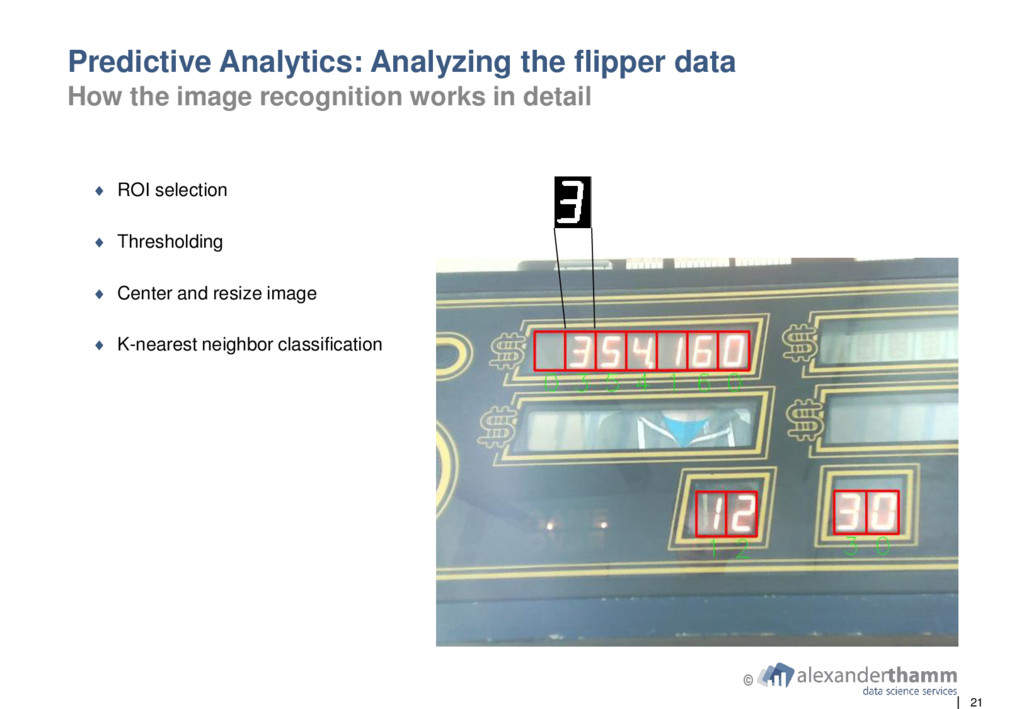
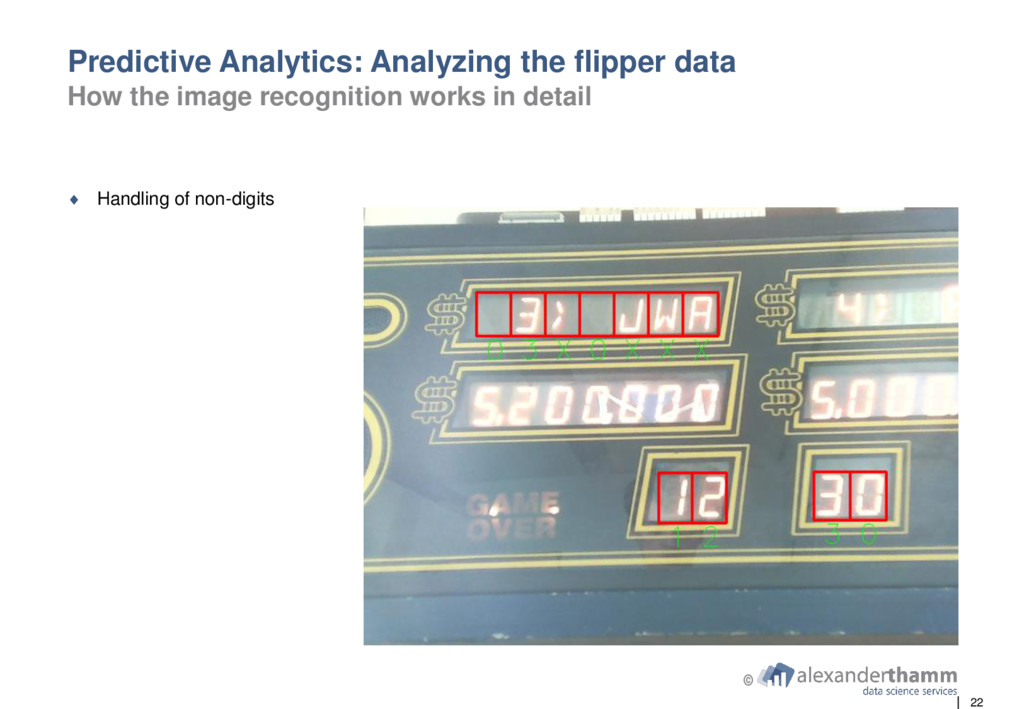
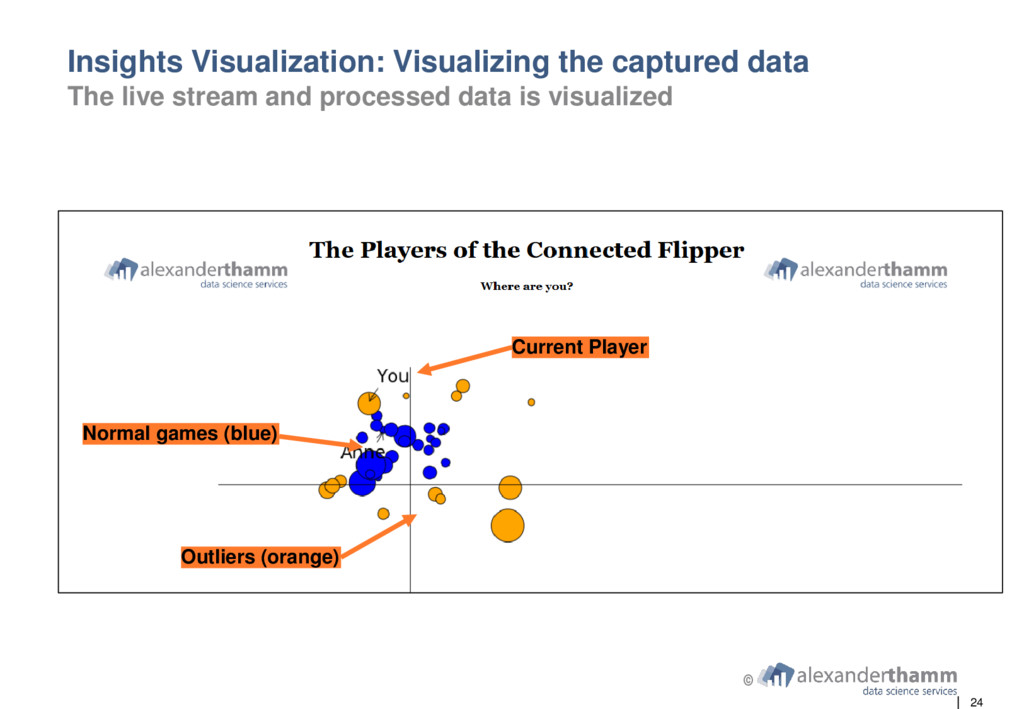
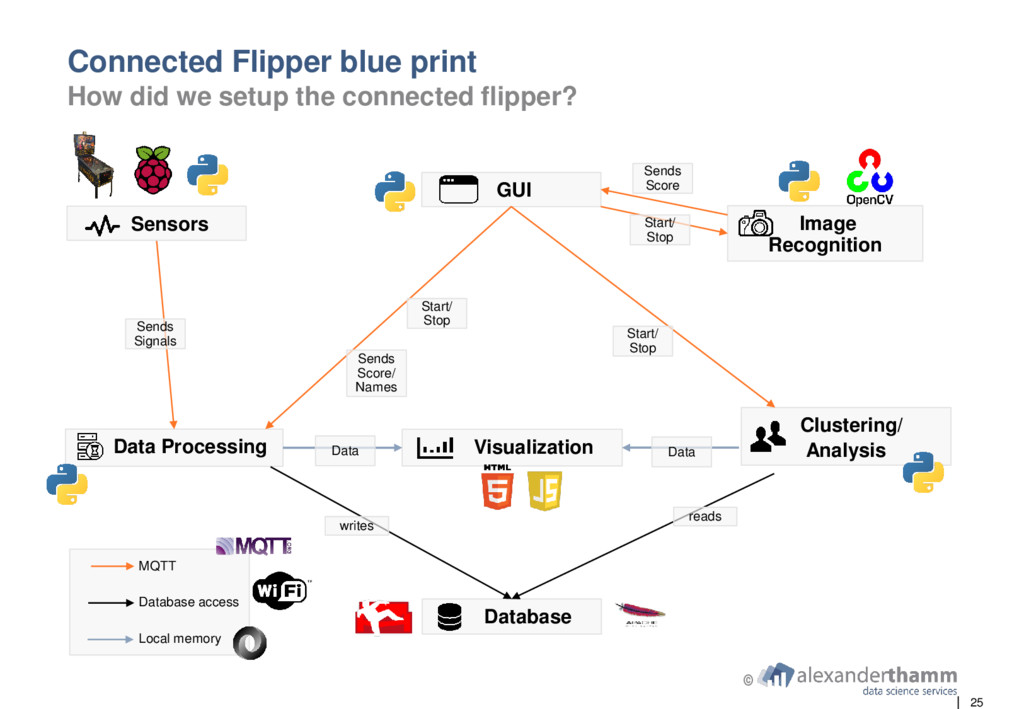
To make the Internet of Things and Big Data more tangible, we took a popular old analog product, a Pinball (Flipper) machine from 1987, equipped it with sensors and a raspberry pi and connected it to the internet. By processing the sensor data, it records individual player profiles, compares them with other players and, using machine learning algorithms, it separates different player types. To ease the recording of the highscore, a camera reads the score at the end of the match, which is then saved to a data base after confirmation.

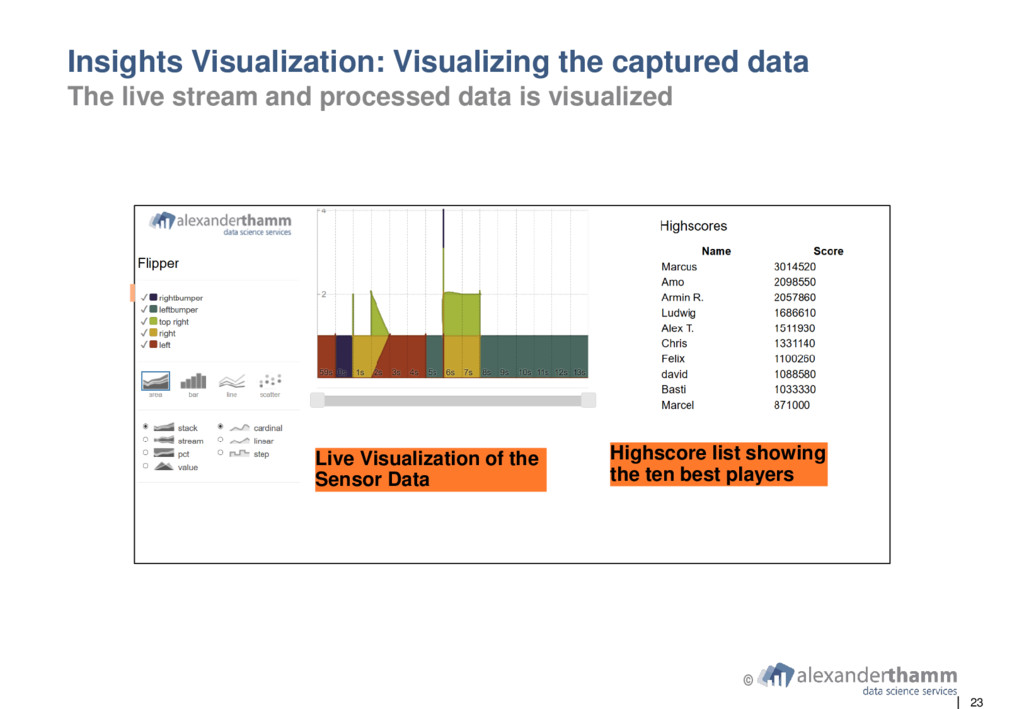
Connected to a display it can also show a live visualization of the sensor data, and of course a highscore list. Since it is configured as a webserver, the database is accessible from any other computer, so the data can be analyzed independently from the current location of the Flipper and of the compute power limits of the pi. And as you have to keep the players up-to- date, the Flipper can automatically send e-mails with information about current highscores or your own profile stats.

Of course this project wasn’t just for fun. The procedure pretty much covers all parts of a Data Science project and was used to train the skills of our trainees.

MunichDataGeeks

October 08, 2016
Tweet

More Decks by MunichDataGeeks

Other Decks in Technology

Transcript

  1. 1 Company presentation and trainee programm at Alexander Thamm GmbH

    Datageeks Data Day 2016 Kevin Risch – Alexander Thamm GmbH Munich, 08.10.2016
  2. 2 The idea: a perfect showcase Most Problems in Data

    Science are hard to grasp. So we created a showcase out of something everybody knows and loves. ©
  3. 3 The problem: lack of experience and methodology Big data

    analytics, data science, etc. is on everyone‘s lips – but it lacks professionals and successful methods. ©
  4. 4 The Flipper and the AT-Compass The data-compass as an

    instrument to project success of data science projects. ©
  5. 0 10 20 30 40 50 60 2012 2013 2014

    2015 Employee Development 0% 10% 20% 30% 40% Physics Mathematics Engineering Economics Informatics Statistics Professional Background That‘s us – data scientists of the Alexander Thamm GmbH With our internal trainee program we are unique in the education of data scientists in Germany. 5 ©
  6. Germany‘s first true data science consultancy: guiding for better business

    decisions. The Alexander Thamm GmbH at a glance 6 © An overview of facts and success figures Over 400 successfully realized analytics projects 90% of all pilot projects developed into full use tools Trainee Programm & Data Science Academy Profitable growth to 50 employees in 4 years Our awards Banking IT-Innovation Award 2014 University of St. Gallen Innovationspreis-IT: Best of Big Data 2015 Initiative Mittelstand Innovationspreis-IT: Best of Finance Initiative Mittelstand KfW-Award Gründer Champion Bayern 2015 KfW Bankengruppe, Bundesministerium für Wirtschaft und Energie Experton Big Data Rising Star Award 2016 Experton Big Data Vendor Benchmark European Business Awards 2016 / 2017 National Champion Germany 2016 / 2017
  7. 7 Cost-Down & Quality Analytics Internet of Things Predictive Maintenance

    Smart Reporting 360 Customer Journey Risk & Fraud Scoring We cluster our Big Data & Data Science Projects into six main subjects. Our Product Cluster ©
  8. With our origin in the autmotive industry we had the

    chance to transfer our AT-Approach into other industries. Our customers 8 ©
  9. © 2016 Alteryx, Inc. | Confidential Download a FREE Trial:

    alteryx.com/trial Share Alteryx-Platform for Self-Service Data Analytics Enrich Output All Popular Formats Prep & Blend Analyze Input All Relevant Data 10
  10. © Kevin Risch Consultant Data Scientist Wilhelm-Wagenfeld-Str. 20 80807 München

    T +49 89 307 60 880 M +49 176 568 817 85 [email protected] www.alexanderthamm.com
  11. 14 The idea: a perfect showcase Most Problems in Data

    Science are hard to grasp. So we created a showcase out of something everybody knows and loves. ©
  12. 15 The Flipper and the AT-Compass The data-compass as an

    instrument to project success of data science projects. ©
  13. 16 © Business Processes: The idea behind the connected flipper

    How can we help our customers to better understand data science?  Using an everyday object and ‘connect’ it  Getting in touch with the IoT  Bringing together all the competences of AT in one project  Using and combining various types of software and hardware
  14. 17 © Connected Flipper blue print How did we setup

    the connected flipper? Connections to the Flipper Elements GPIO-Interface Network-Adapter
  15. 18 © Sensors Database Visualization GUI Clustering/ Analysis Data Processing

    Image Recognition Sends Signals Sends Score/ Names Start/ Stop Start/ Stop Sends Score writes reads Start/ Stop MQTT Database access Local memory Connected Flipper blue print How did we setup the connected flipper? Data Data
  16. 19 © Data Intelligence: Building the data model Which data

    do we need to record and how is it stored?
  17. 20 © Predictive Analytics: Analyzing the flipper data Which analysis

    are performed on the flipper?  Clustering of player profiles  Goal: Show the player closest to the current player  Game KPI’s are calculated  The Euclidian distance between the current game and saved games is calculated  Outliers are detected with a mean shift algorithm
  18. 21 © Predictive Analytics: Analyzing the flipper data How the

    image recognition works in detail  ROI selection  Thresholding  Center and resize image  K-nearest neighbor classification
  19. 22 ©  Handling of non-digits Predictive Analytics: Analyzing the

    flipper data How the image recognition works in detail
  20. 23 © Insights Visualization: Visualizing the captured data The live

    stream and processed data is visualized Live Visualization of the Sensor Data Highscore list showing the ten best players
  21. 24 © Insights Visualization: Visualizing the captured data The live

    stream and processed data is visualized Normal games (blue) Outliers (orange) Current Player
  22. 25 © Database Visualization GUI Clustering/ Analysis Data Processing Image

    Recognition Sends Signals Sends Score/ Names Start/ Stop Start/ Stop Sends Score writes reads Start/ Stop MQTT Database access Local memory Connected Flipper blue print How did we setup the connected flipper? Data Data Sensors
  23. © Dr. Felix Klein Consultant Data Science Wilhelm-Wagenfeld-Str. 20 80807

    München T +49 89 307 60 880 M +49 176 473 372 24 [email protected] www.alexanderthamm.com