Upgrade to Pro — share decks privately, control downloads, hide ads and more …

When less can be more

When less can be more

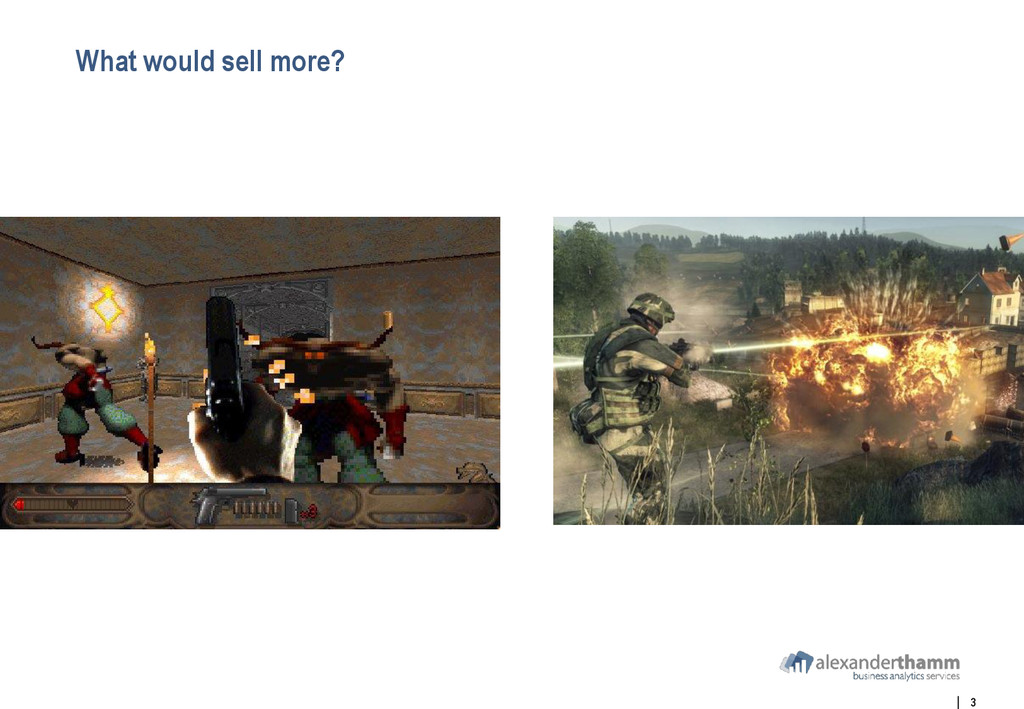
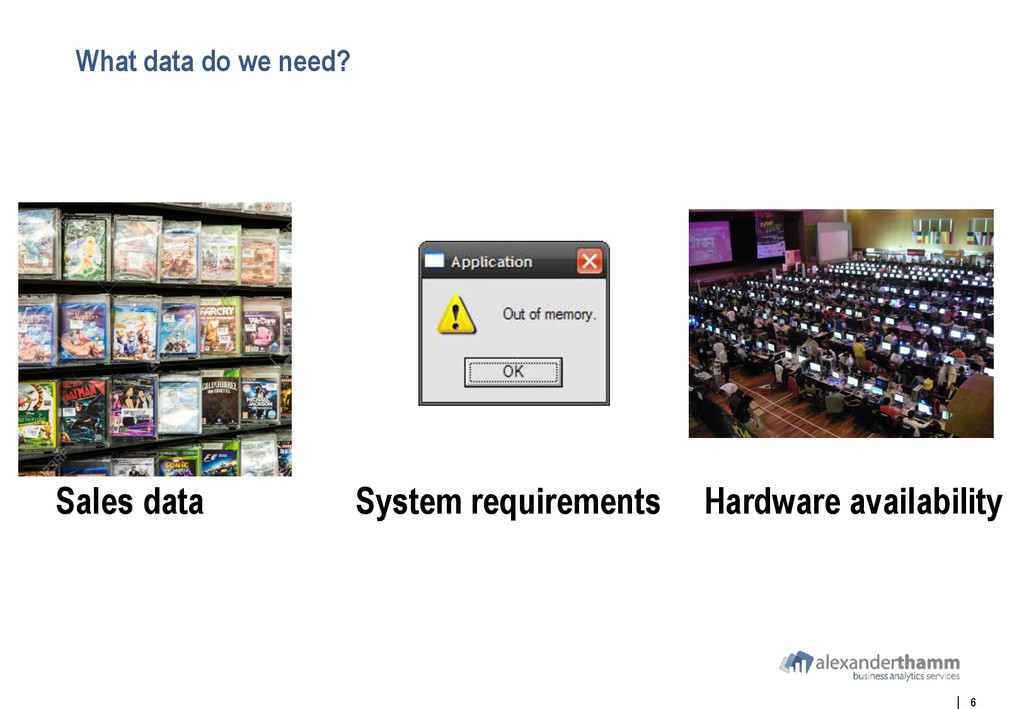
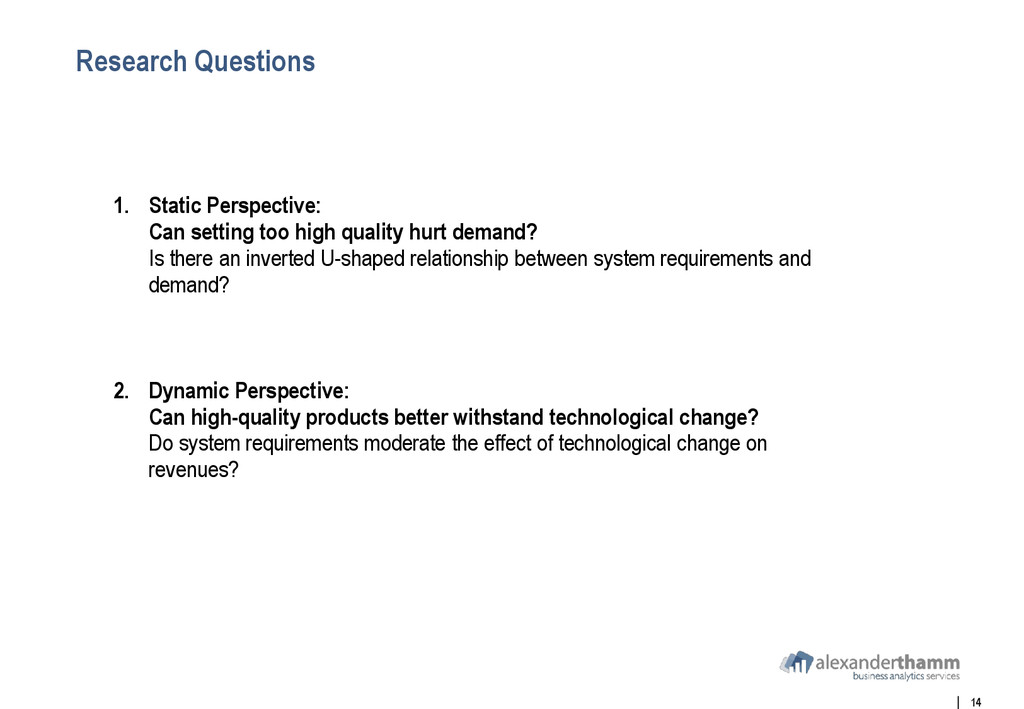
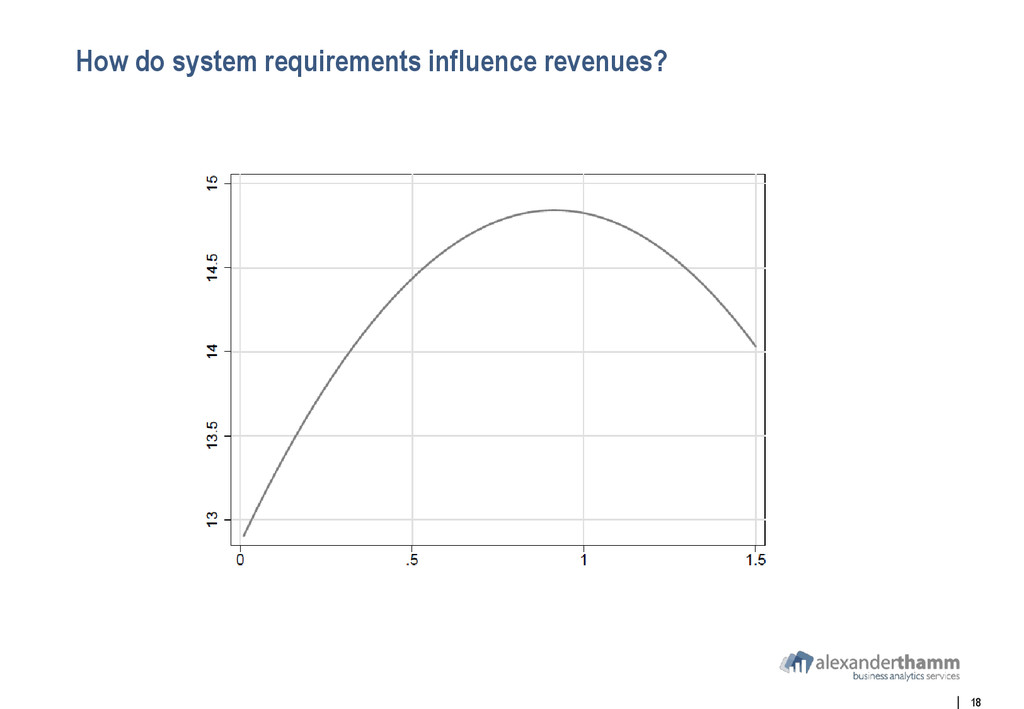
This presentation is essentially about the economics of computer games. Particularly, their technological sophistication. Games with realistic physial effects and fancy graphics might be more attractive (which means more gamers would like to buy it) but come with higher system requirements (which means that fewer gamers can play it). This research shows how the trade-off should (economically) be solved and what role time and technological progress play.

MunichDataGeeks

July 22, 2015
Tweet

More Decks by MunichDataGeeks

Other Decks in Science

Transcript

  1. 1 When less can be more München, Juli 2015 Christian

    Essling joint with Jörg Claussen and Tobias Kretschmer
  2. 4 AT-Standard-Template--01-12-2013-AT-Präsentationelemente.pptx Trade-off between attractiveness and market potential. A position

    closer to the technological frontier  increases product attractiveness  Increases the likelihood of people buying the product  increases also the requirements for the complementary good  Exclude all those potential consumers whose complementary good cannot satisfy the requirements, which limits market potential  When choosing closeness to the technological frontier, a firm has to trade-off market potential with product attractiveness
  3. 5 AT-Standard-Template--01-12-2013-AT-Präsentationelemente.pptx Also, time matters! Once the product is released

    on the market, its quality (usually) cannot be changed anymore Absolute quality remains constant for the rest of the product life cycle Technological Change then has two effects:  A negative one as more attractive substitutes are introduced  A positive one as complementary goods improve Products close to the technological frontier can withstand competitive pressure for a longer time, but are also more costly to produce
  4. 11 AT-Standard-Template--01-12-2013-AT-Präsentationelemente.pptx NPD • Market Research Company • Tracks PoS-Data

    • Data accounts for 66% of overall generated revenue • Monthly revenue data for 20,000 video games between 1990 and 2010
  5. 14 AT-Standard-Template--01-12-2013-AT-Präsentationelemente.pptx Research Questions 1. Static Perspective: Can setting too

    high quality hurt demand? Is there an inverted U-shaped relationship between system requirements and demand? 2. Dynamic Perspective: Can high-quality products better withstand technological change? Do system requirements moderate the effect of technological change on revenues?
  6. 15 AT-Standard-Template--01-12-2013-AT-Präsentationelemente.pptx Variables • Closeness to the Frontier • Technological

    Change Deviation from the average monthly technological progress • Age Months since introduction • Critics‘s score Rating a game gets from gaming websites and magazines • Teamsize Size of the developer team (log) • Dummies Calendar Month, Genre, Licensed Content, Part of a Series
  7. 16 AT-Standard-Template--01-12-2013-AT-Präsentationelemente.pptx Empirical strategy We estimate two regressions: 1. The

    effect of Closeness to the frontier on total revenues  We use the cross-section to identify the effect of CTF on the total success of a game 2. Disentangling the two effects of technological change  We estimate technological change in a linear version and as an interaction term with closeness to the frontier  The use of game fixed effects accounts for unobserved game heterogeneity
  8. 17 AT-Standard-Template--01-12-2013-AT-Präsentationelemente.pptx How do system requirements influence revenues?  Closeness

    to the frontier increases sales  Decreasing marginal effect of closeness to the frontier
  9. 19 AT-Standard-Template--01-12-2013-AT-Präsentationelemente.pptx How does technological change influence revenues?  Negative

    effect due to better substitutes  Positive effect due to increasing market potential