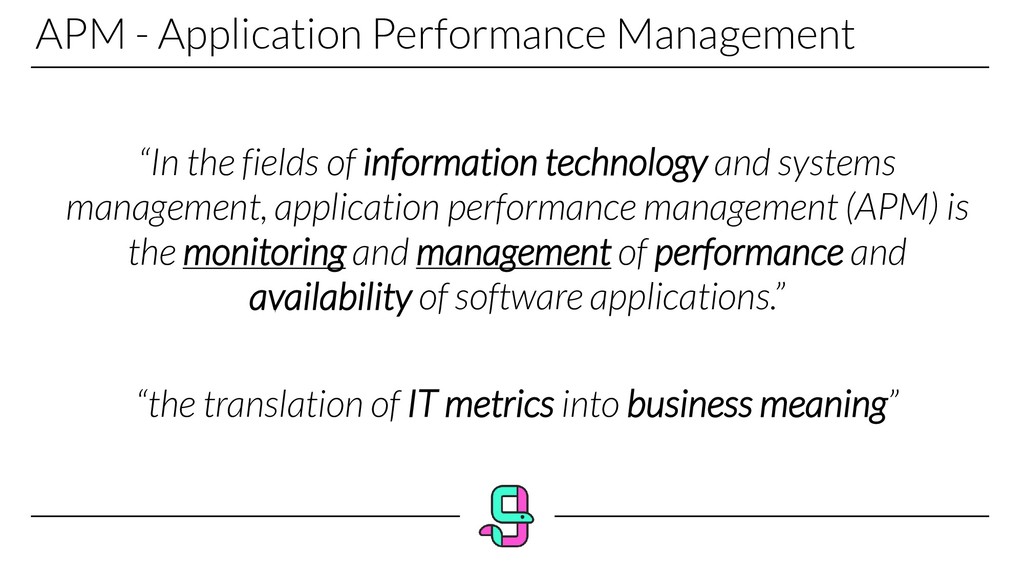
technology and systems management, application performance management (APM) is the monitoring and management of performance and availability of software applications.” “the translation of IT metrics into business meaning”
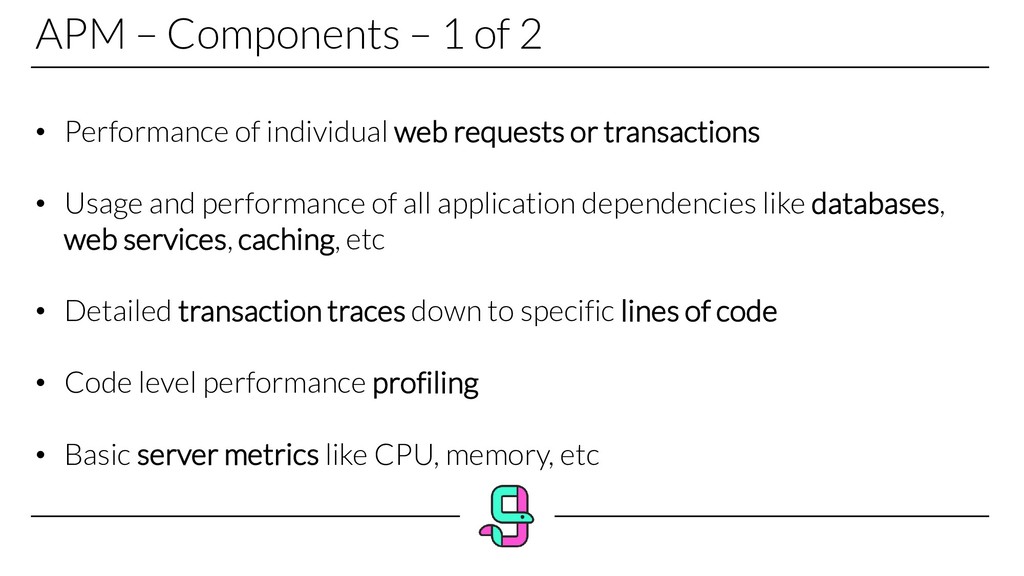
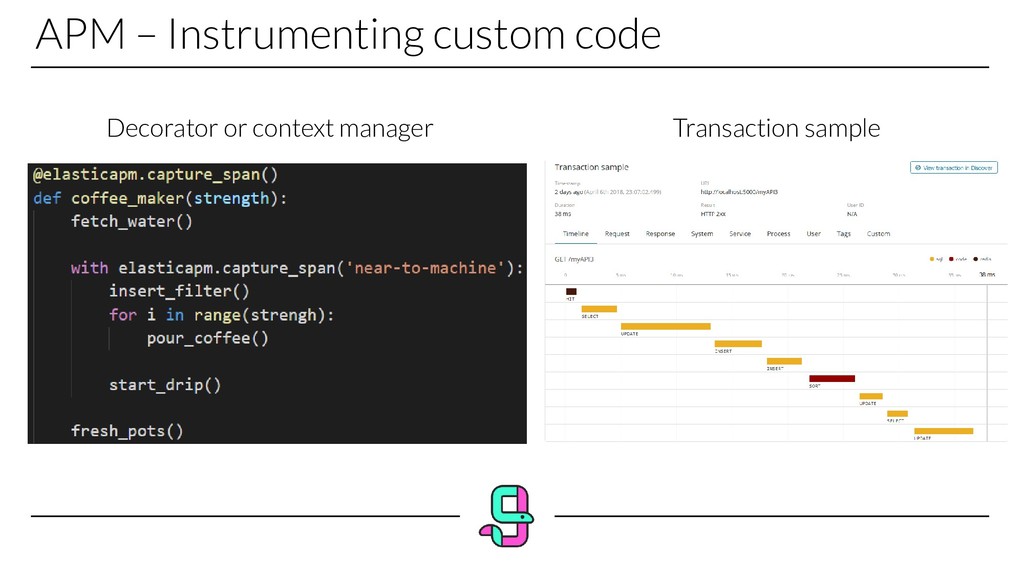
individual web requests or transactions • Usage and performance of all application dependencies like databases, web services, caching, etc • Detailed transaction traces down to specific lines of code • Code level performance profiling • Basic server metrics like CPU, memory, etc
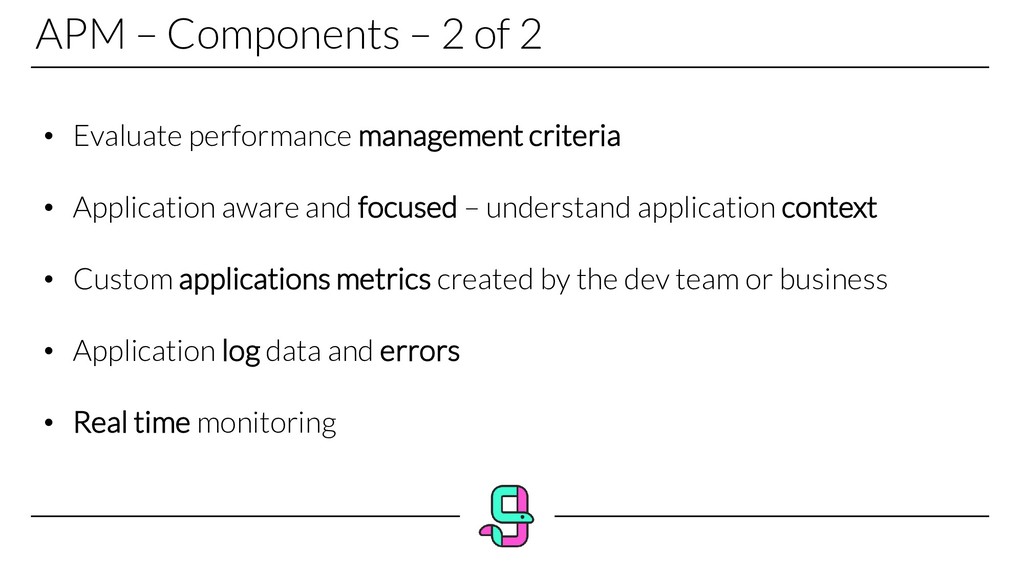
management criteria • Application aware and focused – understand application context • Custom applications metrics created by the dev team or business • Application log data and errors • Real time monitoring
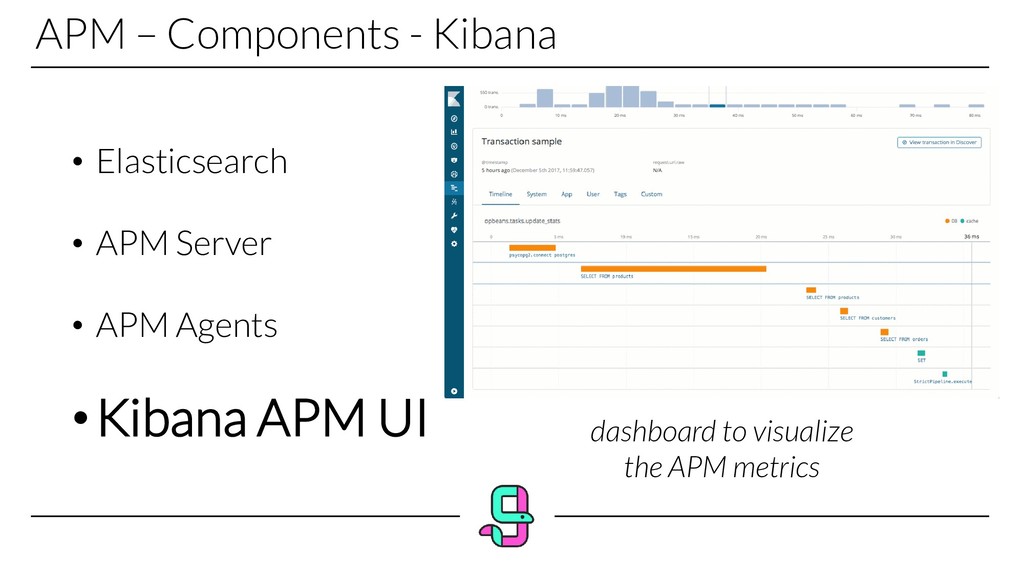
analytics engine, heart of the Elastic Stack, it centrally stores your data. Kibana lets you visualize your Elasticsearch data and navigate the Elastic Stack
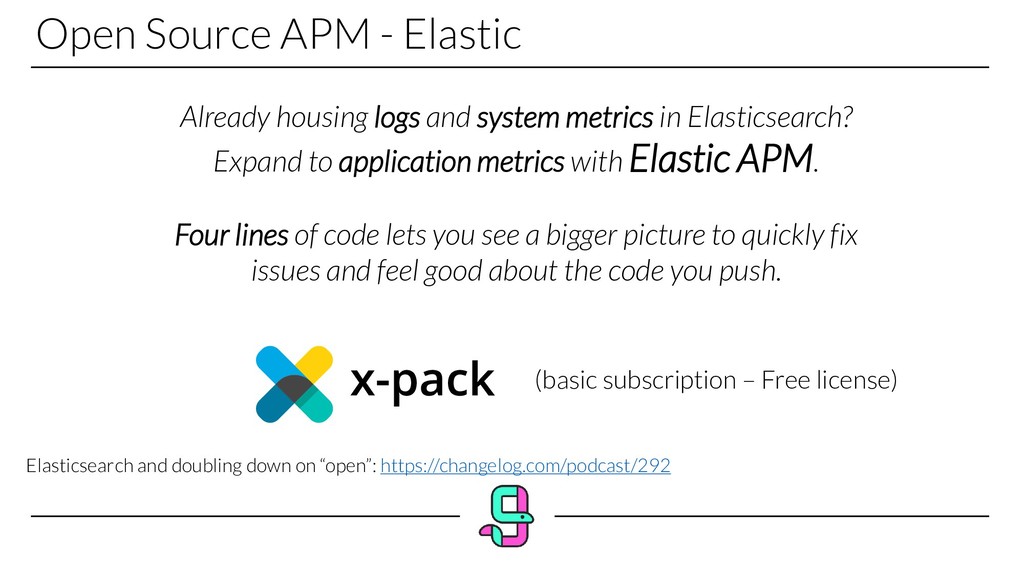
metrics in Elasticsearch? Expand to application metrics with Elastic APM. Four lines of code lets you see a bigger picture to quickly fix issues and feel good about the code you push. (basic subscription – Free license) Elasticsearch and doubling down on “open”: https://changelog.com/podcast/292
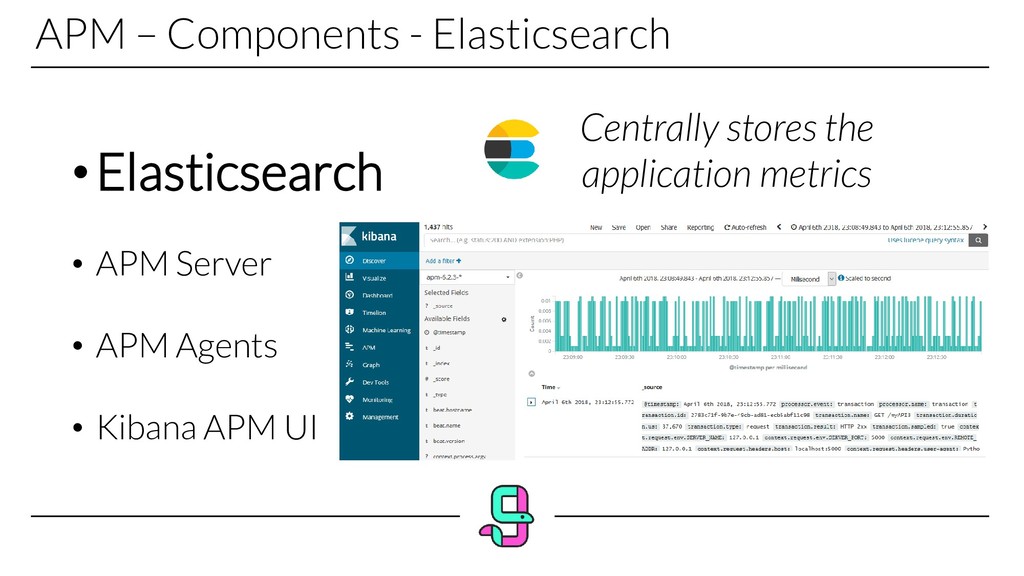
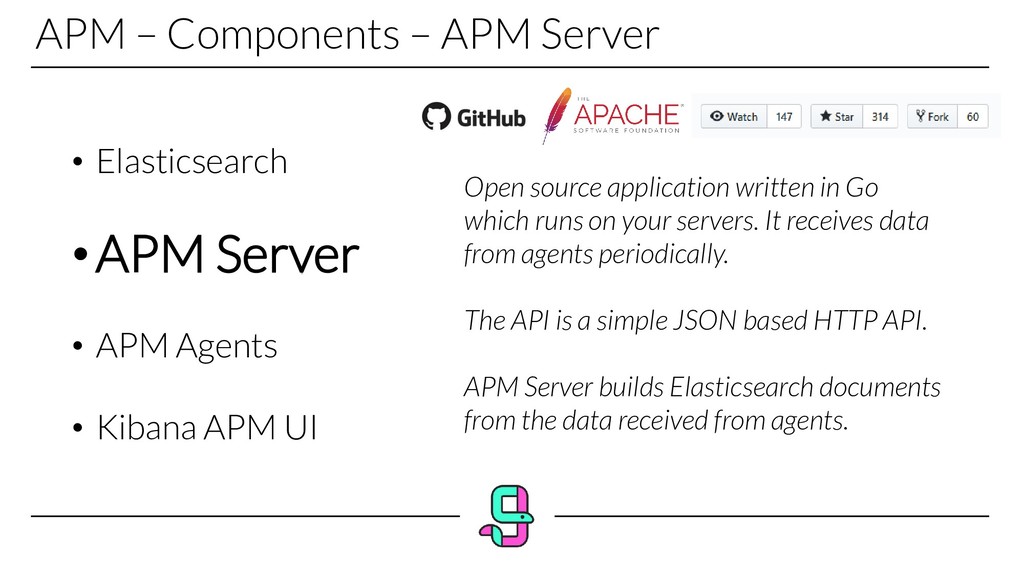
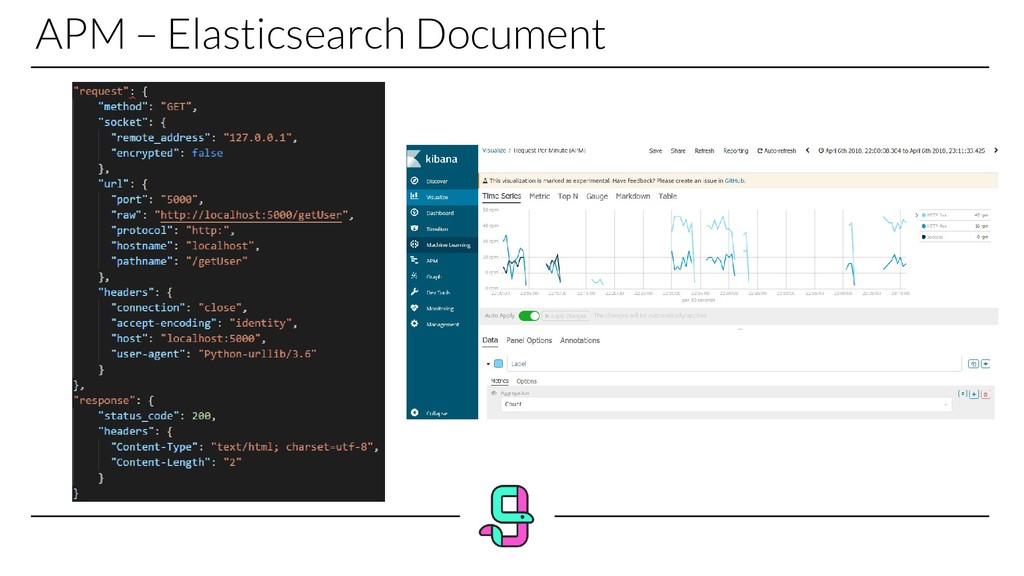
• APM Agents • Kibana APM UI Open source application written in Go which runs on your servers. It receives data from agents periodically. The API is a simple JSON based HTTP API. APM Server builds Elasticsearch documents from the data received from agents.
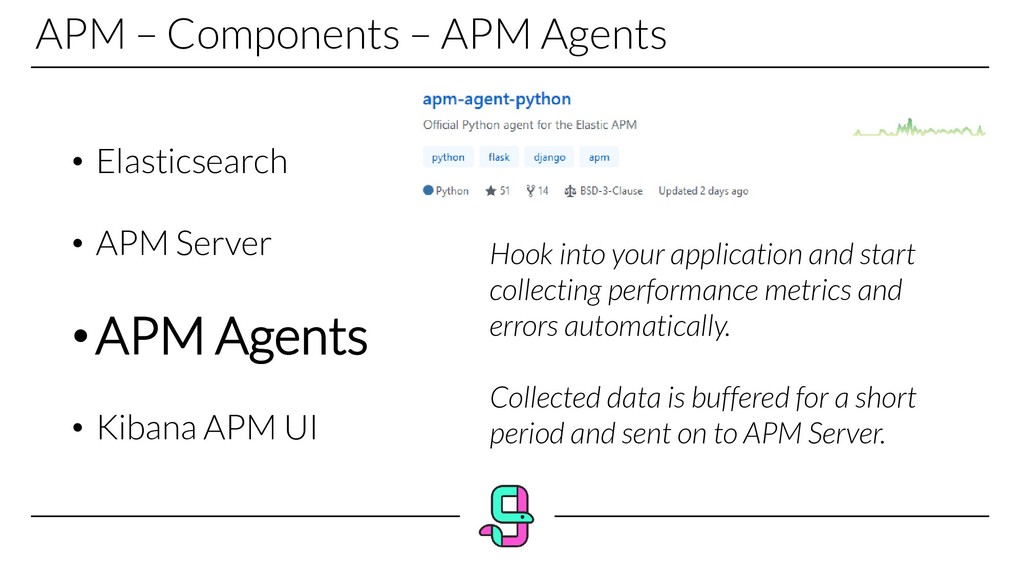
Server •APM Agents • Kibana APM UI Hook into your application and start collecting performance metrics and errors automatically. Collected data is buffered for a short period and sent on to APM Server.
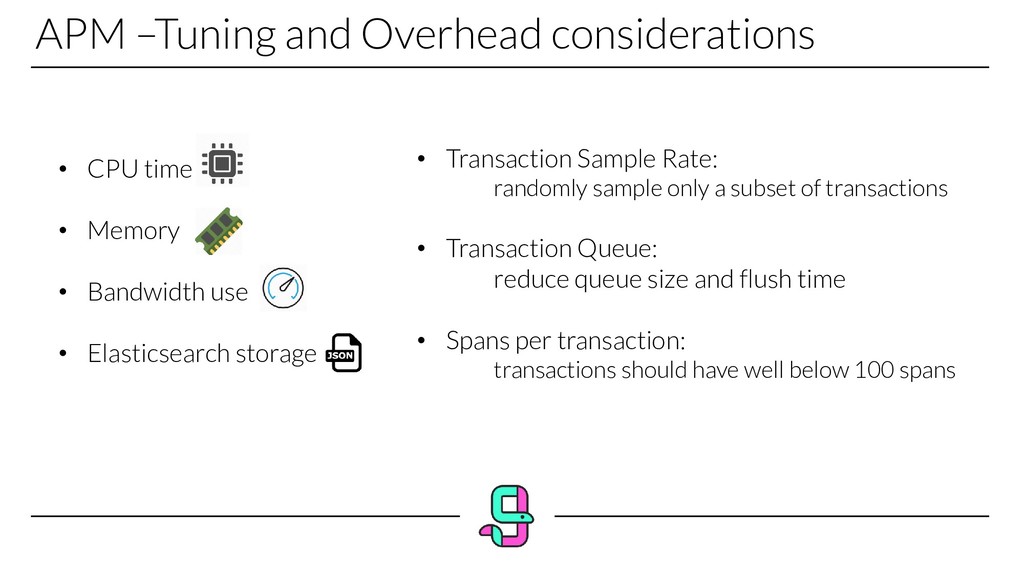
• Bandwidth use • Elasticsearch storage • Transaction Sample Rate: randomly sample only a subset of transactions • Transaction Queue: reduce queue size and flush time • Spans per transaction: transactions should have well below 100 spans
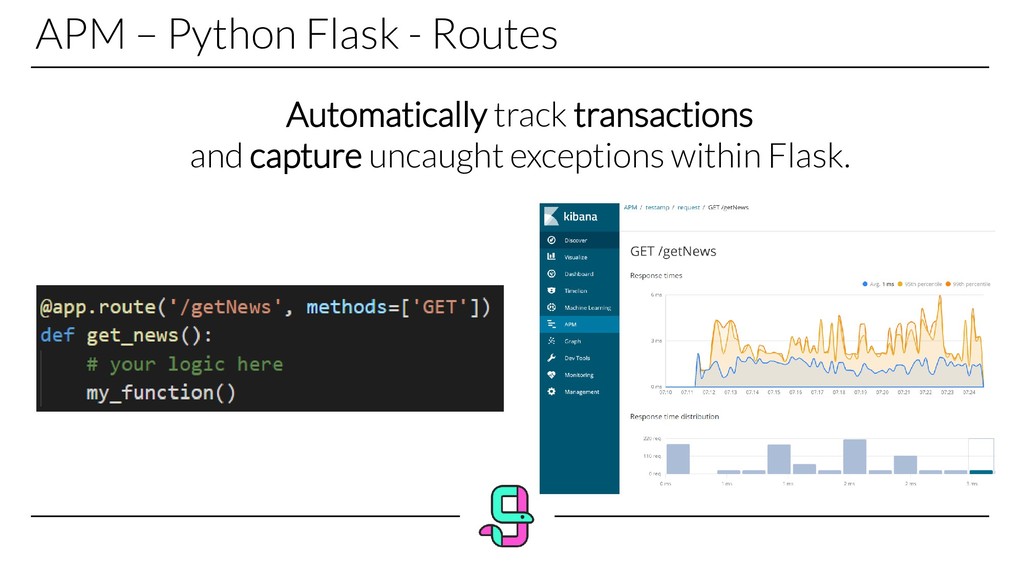
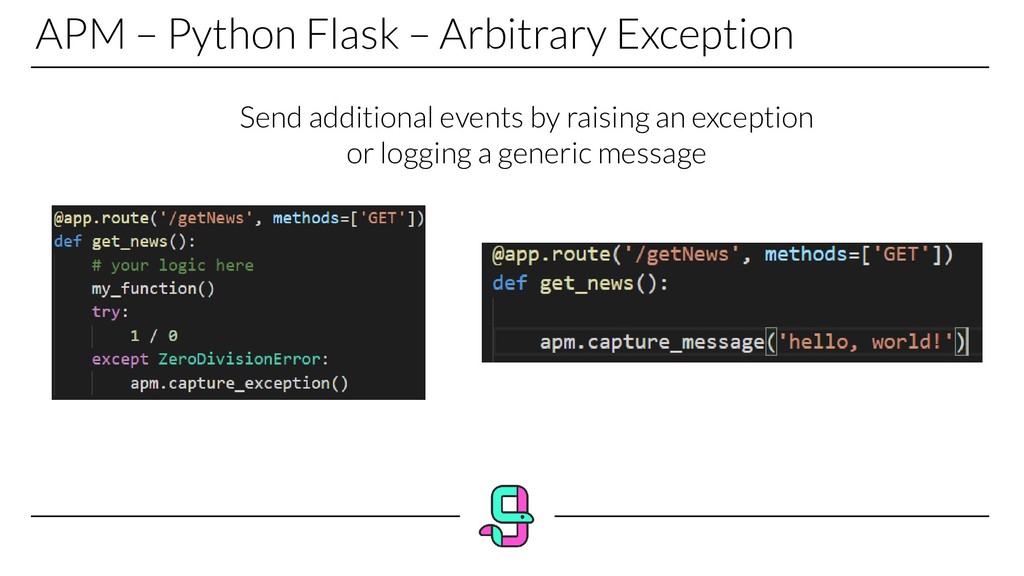
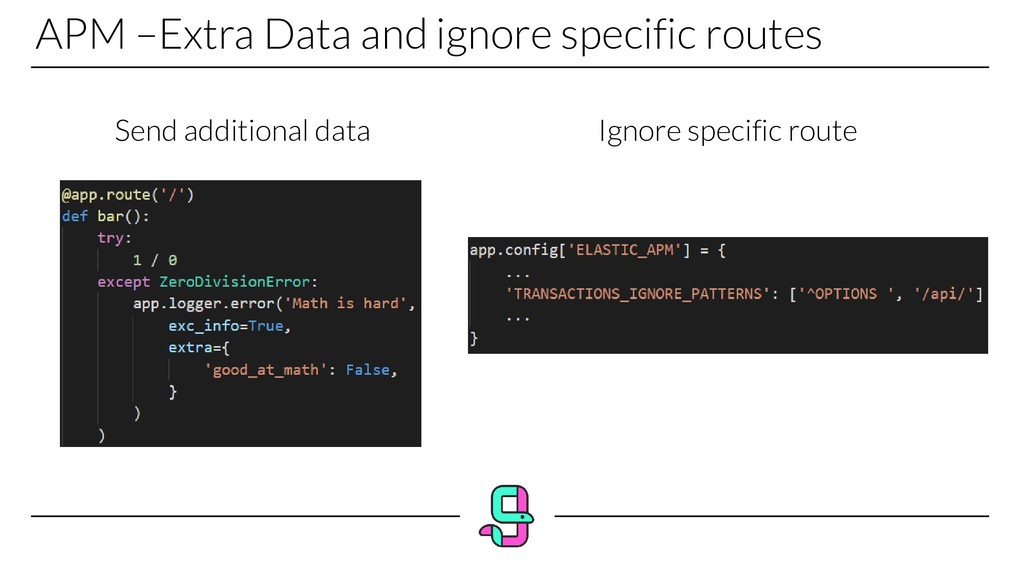
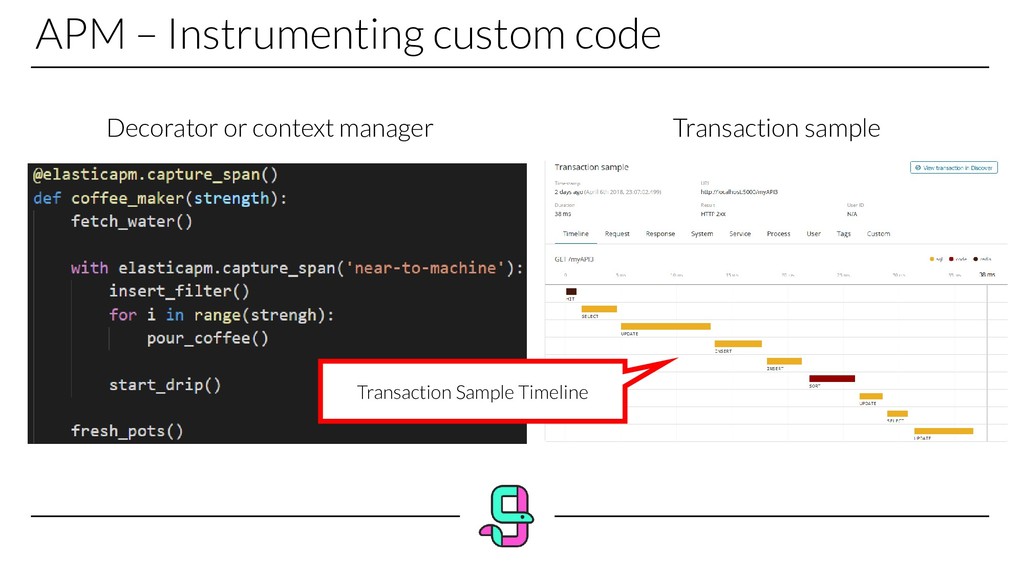
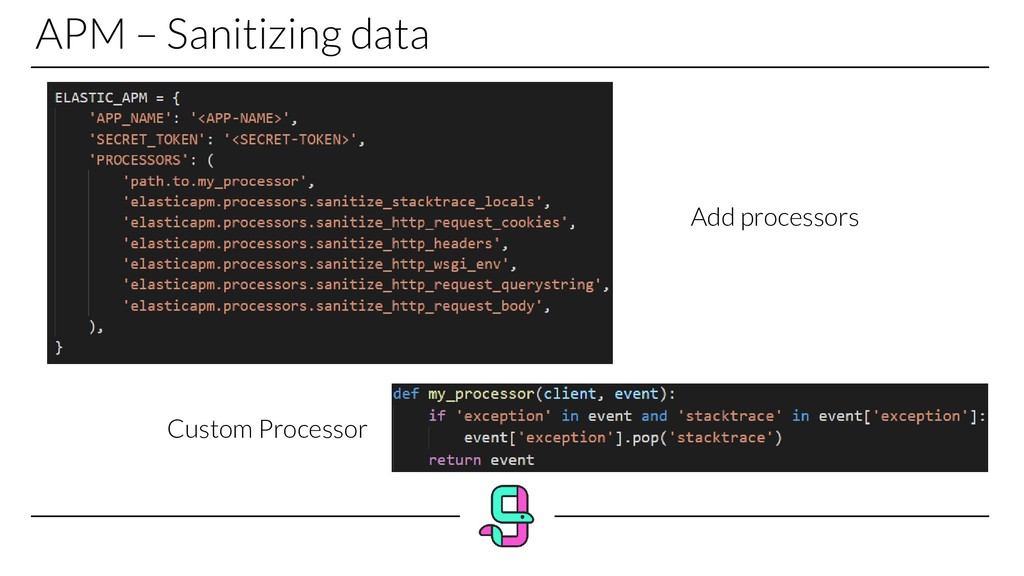
(Flask and Django) • Few lines of code • Custom exceptions and messages • Transactions and requests • Exclude route and sanitize data • APM Server public API
![About me MATTEO ZUCCON @matteo_zuccon [email protected] https://whiletrue.run Solution Developer |](https://files.speakerdeck.com/presentations/61909937d78f41cdaa56a1ef9e85118d/slide_1.jpg)
![APM – Python Flask - Configuration pip install elastic-apm[flask] For](https://files.speakerdeck.com/presentations/61909937d78f41cdaa56a1ef9e85118d/slide_27.jpg)
![APM – Elastic - Python Thank you Questions? @matteo_zuccon [email protected]](https://files.speakerdeck.com/presentations/61909937d78f41cdaa56a1ef9e85118d/slide_43.jpg)