was a poster boy for continuous deployment, in particular, for security. • Here's some context on how this came to be • It's unlikely you'll have anything like the environment at Right Media, and remember there is no right way to do deployments or "devops".
City • Started doing 10k transactions a day in 2005 • Left when acquired by Yahoo in 2007 • Billion+ transactions a day • 1200+ machines • 3 datacenters
code. Slight changes can have big impact… days later. • Publishers and Advertisers get really cranky when their ads don't run, displayed incorrectly, or blow out their budgets too quickly • Mistakes cost real money
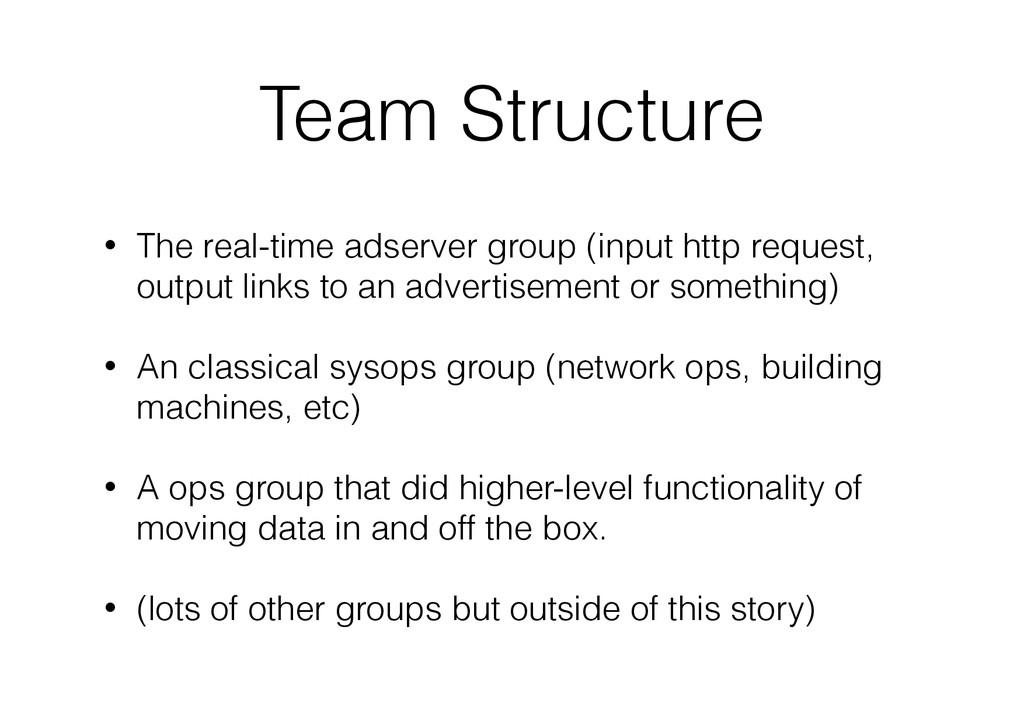
output links to an advertisement or something) • An classical sysops group (network ops, building machines, etc) • A ops group that did higher-level functionality of moving data in and off the box. • (lots of other groups but outside of this story)
Meaning its very difficult to determine a server is exploding due to poor code, poor algorithms/ product or bad data. • This make is very hard to make a 'run book' for problems as its very likely not directly an operations problem (maybe a customer lit up a new ad campaign that is causing CPU problems).
the server team's responsibility to rule out other issues, and escalate. • Made sense as really no one else understood how the server worked. • And the server was constantly under going changes. • Unrealistic to ask for anyone else to debug it. • (also one of those teams was remote)
metrics (CPU, etc) and application metrics. • And metrics specific to certain large customers (adserving is sorta a Platform-as-Service - a adserver might be handling requests for 1000s of publishers).
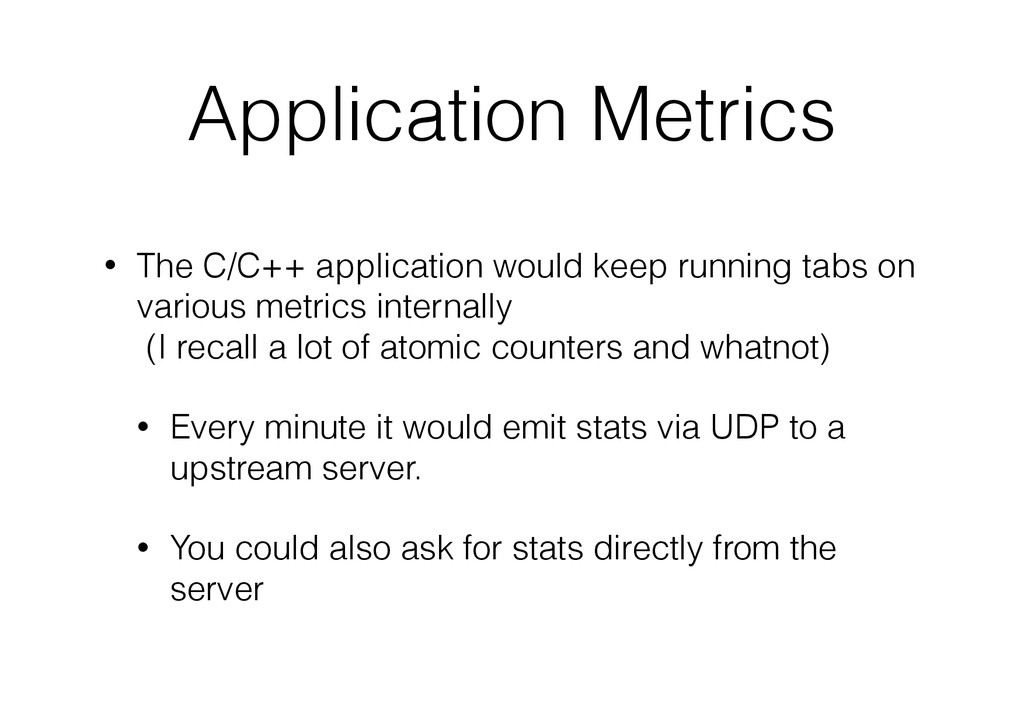
on various metrics internally (I recall a lot of atomic counters and whatnot) • Every minute it would emit stats via UDP to a upstream server. • You could also ask for stats directly from the server
that emits a single statistic via UDP to a server. • https://code.google.com/p/embeddedgmetric/ • First commit in 2007! • It's still around and I think is used by many.
metrics for each server. • You could can query gmond directly for latest stats of a single machine or all machines. • XML output • Single thread (like node.js) Very fast
You'd be correct! Very similar. • Both used UDP. Both used a single-threaded server to collect statistics and dump to storage. • Except our servers did some pre-aggregation on a per-minute basis. • StatsD uses sampling.
very easy to ask gnomd for all current stats for a box or all machines. • Don't need to root around in graphite files to get all stats. • Really easy to do real time displays.
displaying data for many machines at the same time • We wrote a number of tools that would display a quasi- heat-map of statistics. • Each machine was a box and coloured according to the value a stat • Super easy to find outliers and boxes where on fire. • Sorry no pictures :-(
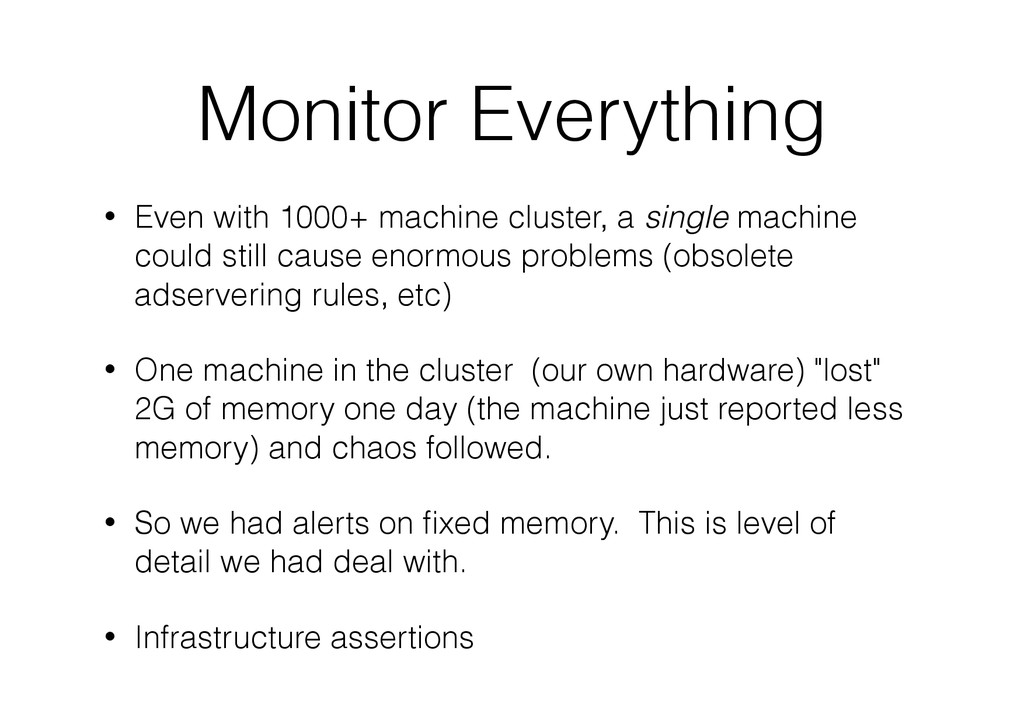
machine could still cause enormous problems (obsolete adservering rules, etc) • One machine in the cluster (our own hardware) "lost" 2G of memory one day (the machine just reported less memory) and chaos followed. • So we had alerts on fixed memory. This is level of detail we had deal with. • Infrastructure assertions
way, to do only little changes, or isolated changes to production. • There was no other way debug. • With big changes were completely impossible to understand what happened. • Rollback would cause features to go away, making customers insane, and caused other problems.
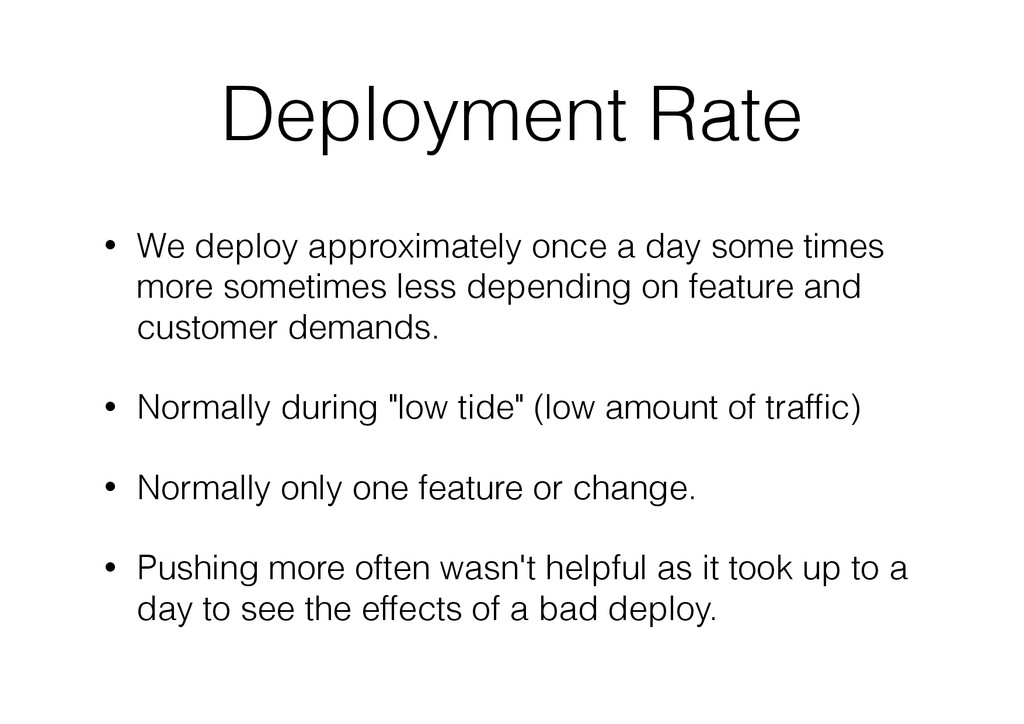
times more sometimes less depending on feature and customer demands. • Normally during "low tide" (low amount of traffic) • Normally only one feature or change. • Pushing more often wasn't helpful as it took up to a day to see the effects of a bad deploy.
C/C++ where every line could cause a big disaster. Actually every character. • Code coverage was crucial. • But also as a way of self-documenting the code. • A large number of "features" were undocumented and the customers using them was unknown. We had to unit test, just to make sure we didn't change anything.
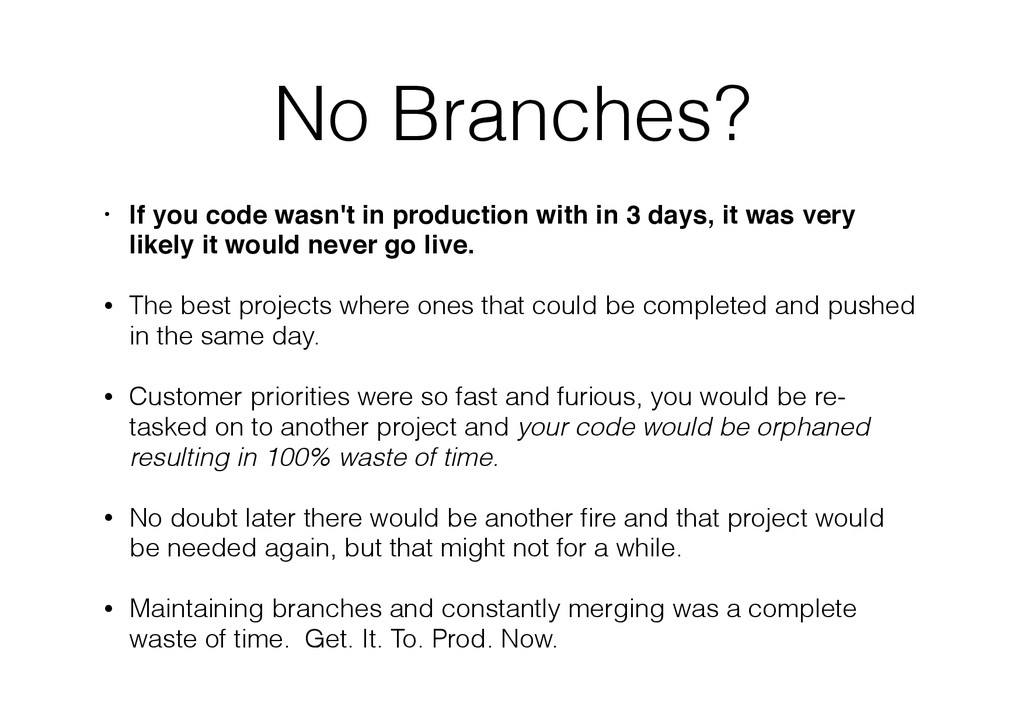
in 3 days, it was very likely it would never go live. • The best projects where ones that could be completed and pushed in the same day. • Customer priorities were so fast and furious, you would be re- tasked on to another project and your code would be orphaned resulting in 100% waste of time. • No doubt later there would be another fire and that project would be needed again, but that might not for a while. • Maintaining branches and constantly merging was a complete waste of time. Get. It. To. Prod. Now.
your old code to prod doing poor-man's Feature Flags: • #ifdef or if (0) out anything critical • Let it run through all code quality checks • push it to prod, where it won't actually cause problems. • Any one can now review it easily, no need to merge or branch, since it's in mainline.
was perhaps CruiseControl http://cruisecontrol.sourceforge.net • It built a debug and production version • code coverage reports using lcov http://ltp.sourceforge.net/coverage/lcov.php • and automatic documentation via doxygen http://www.stack.nl/~dimitri/doxygen/
packaging and deployment. • It was a single binary so not that complicated • Not sure how the bits got moved to all machines. • But our upgrade process was command line based. • Here's how it worked:
turned off the health check and the load balancer would remove the machine. • One machine was upgraded and put back in rotation. • And then gmond was queried for stats on the cluster • a script then looked for outliers to see if the box acted differently than any others (CPU, various other stats) • This had a hot text graphics with bar graphs
upgrade continued to 10% of the cluster. • Same statistical check as before • Nothing too fancy, just looked to see if some machines were above or below some standard deviation. • If we got scared we could undo.