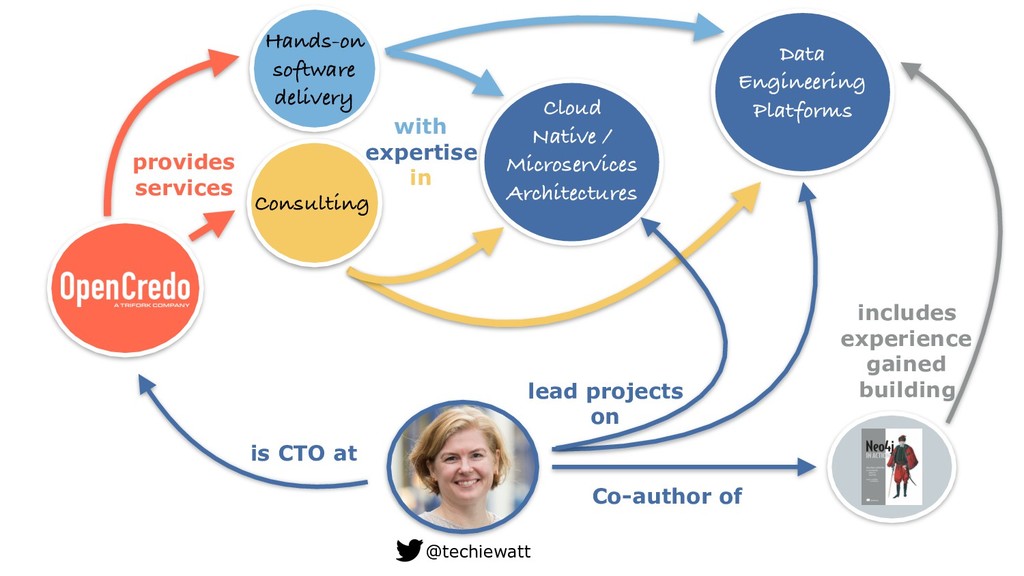
Cloud Native / Microservices Architectures Data Engineering Platforms Co-author of with expertise in lead projects on includes experience gained building
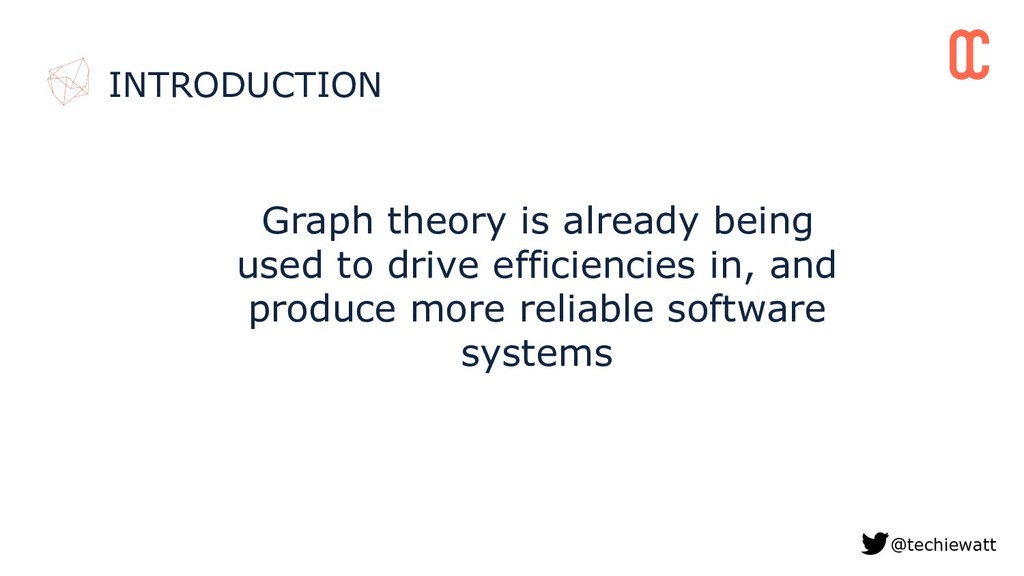
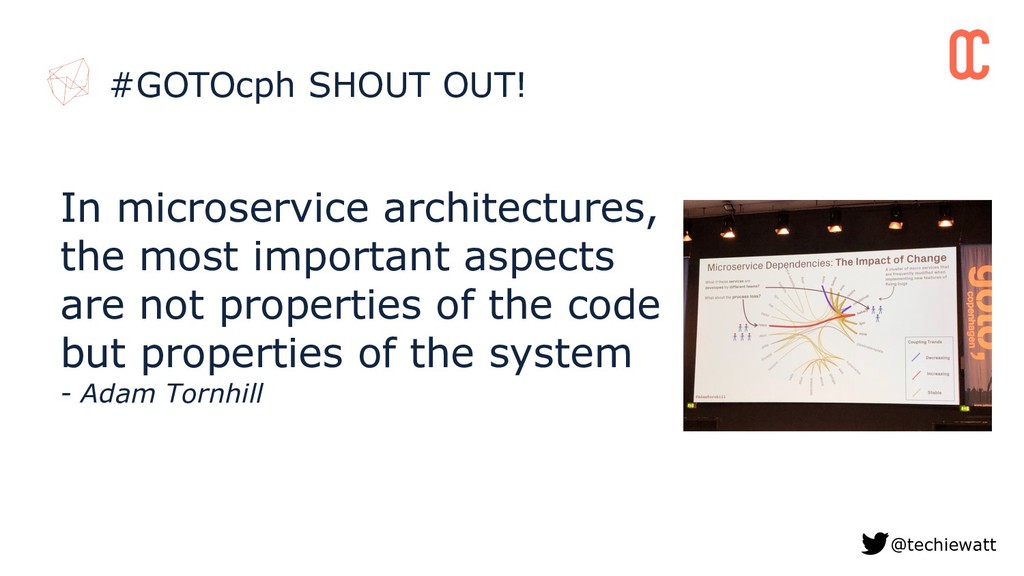
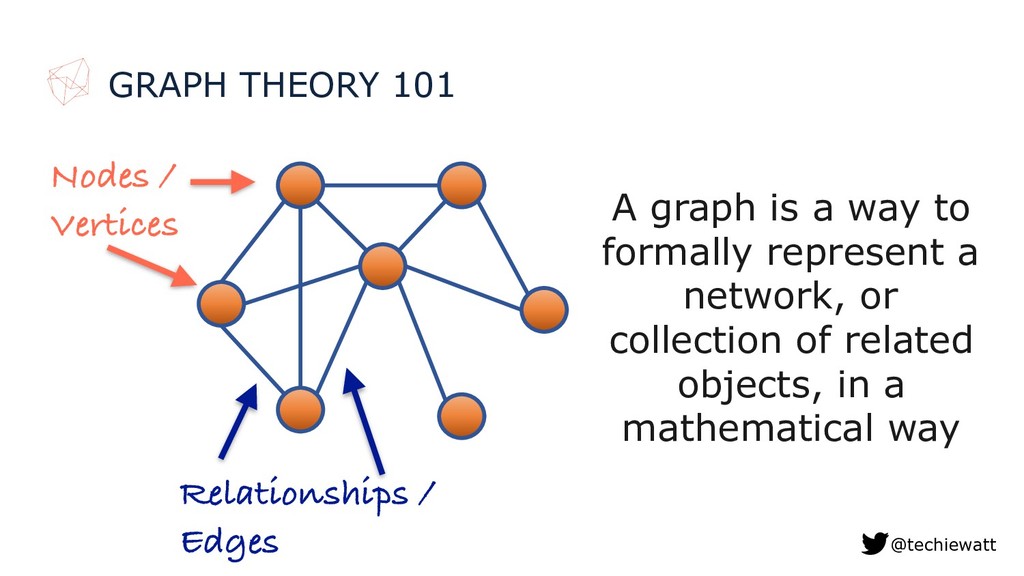
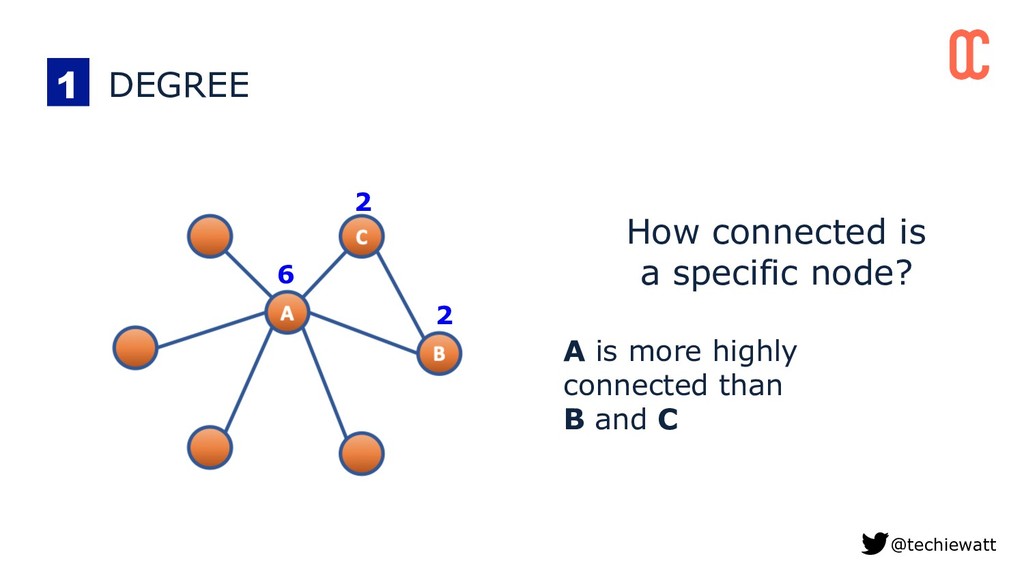
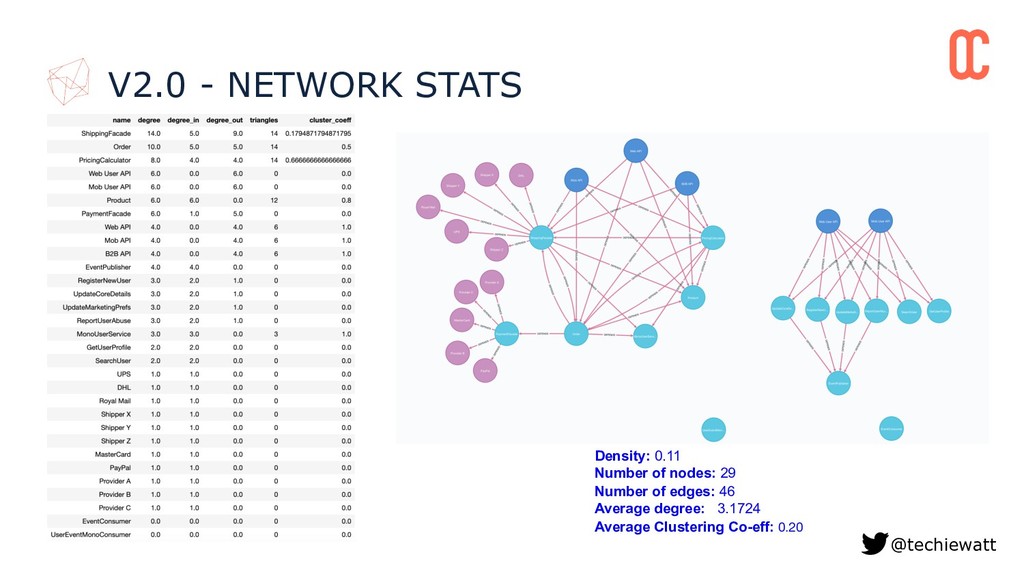
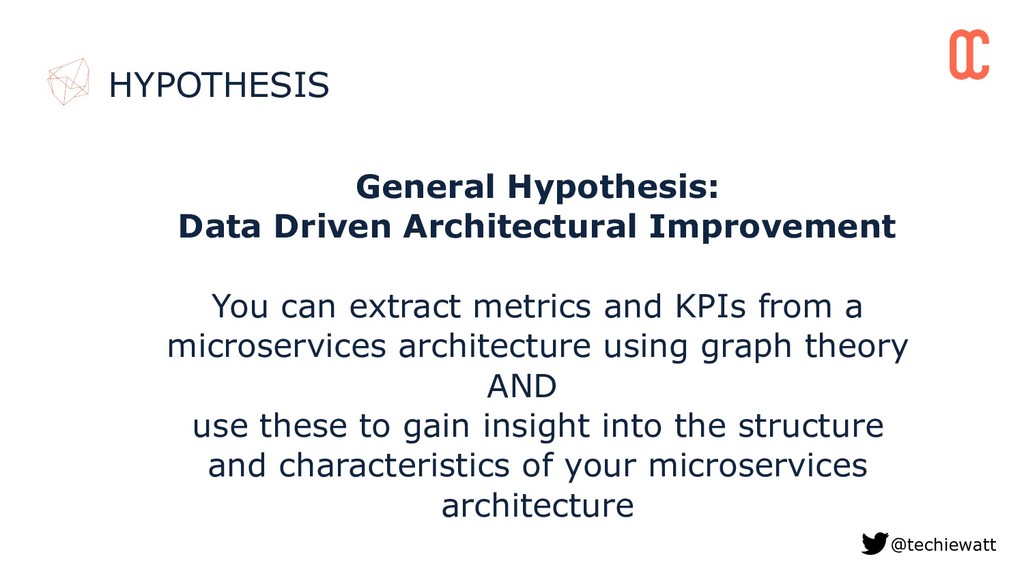
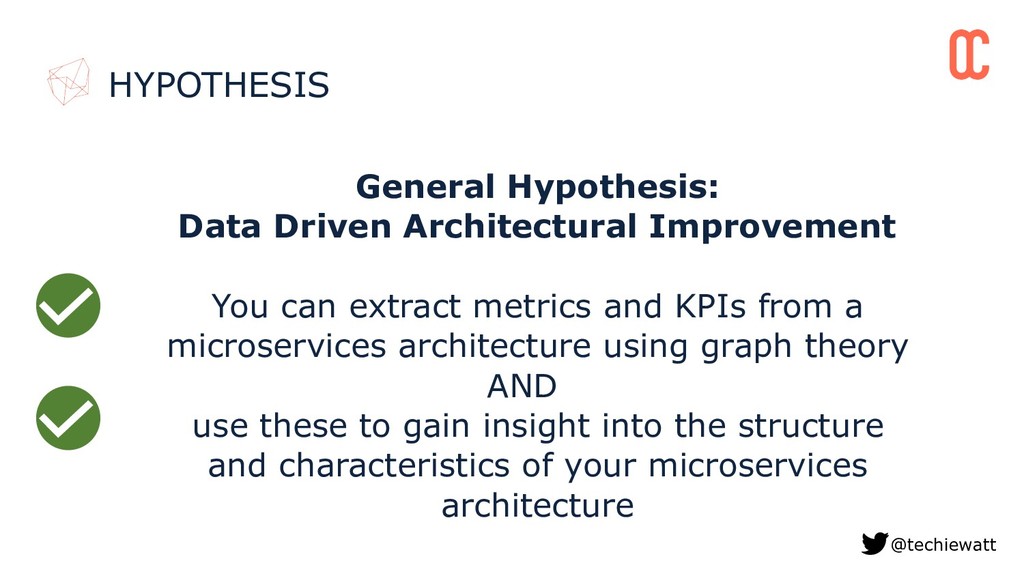
can extract metrics and KPIs from a microservices architecture using graph theory AND use these to gain insight into the structure and characteristics of your microservices architecture
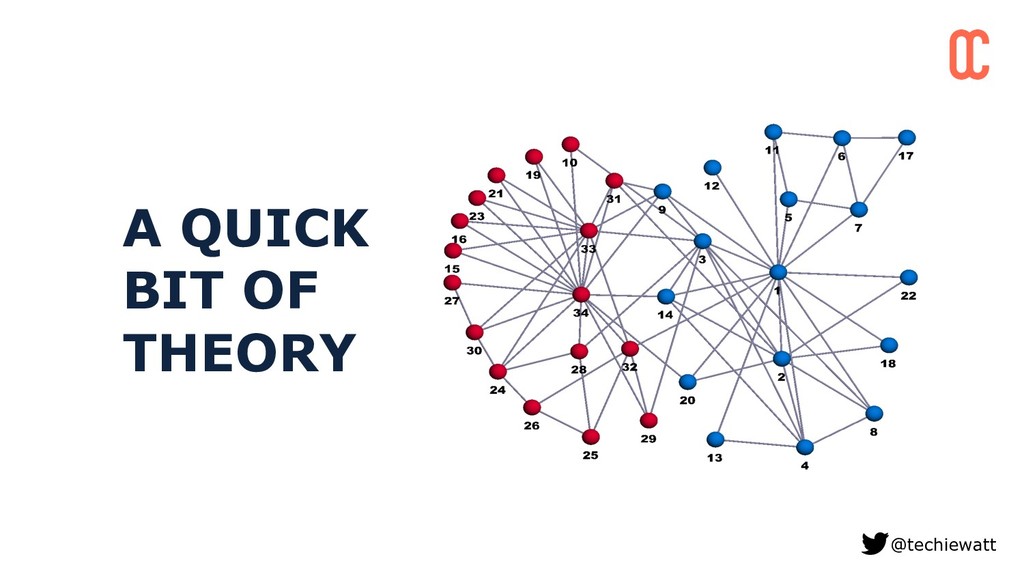
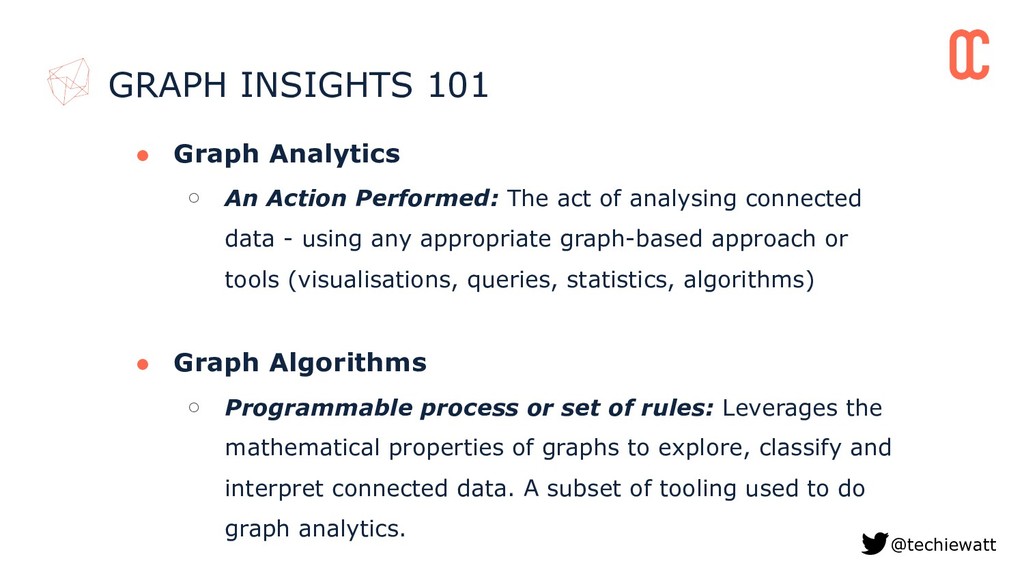
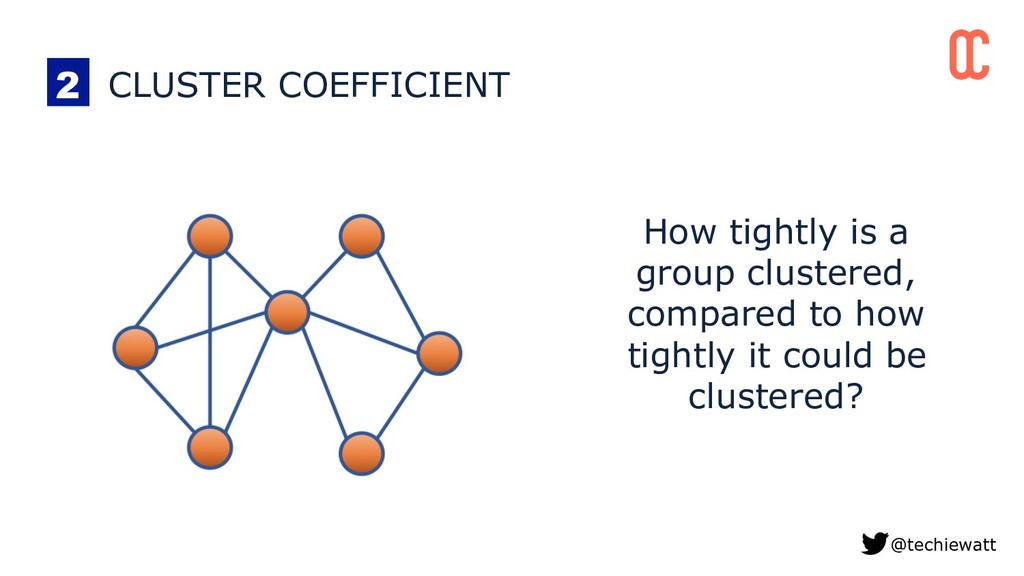
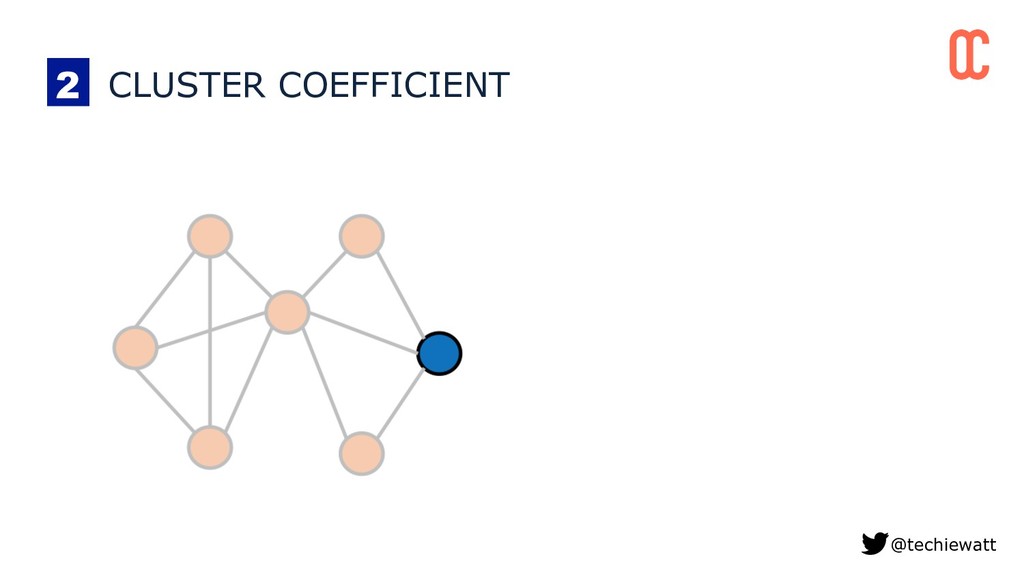
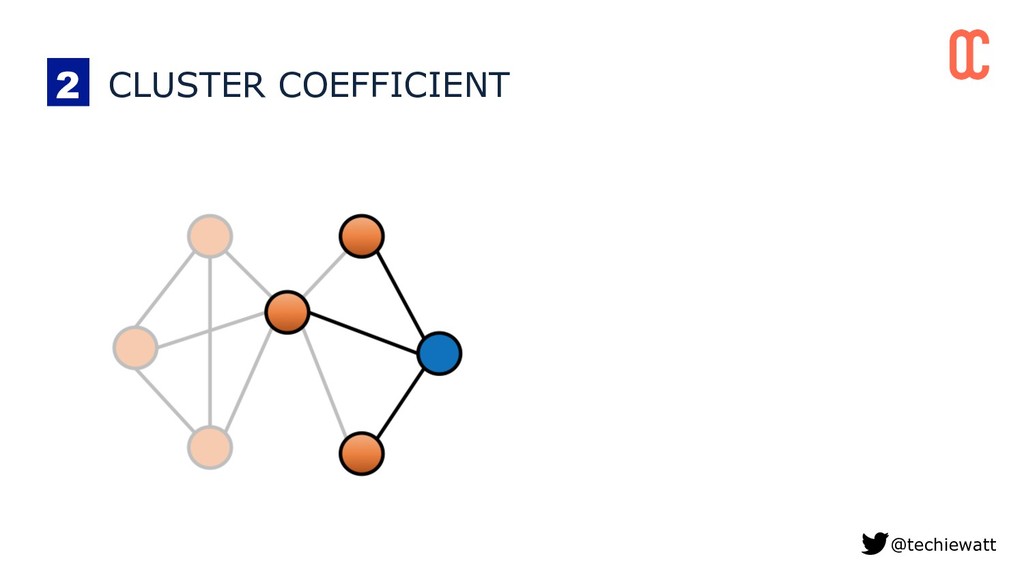
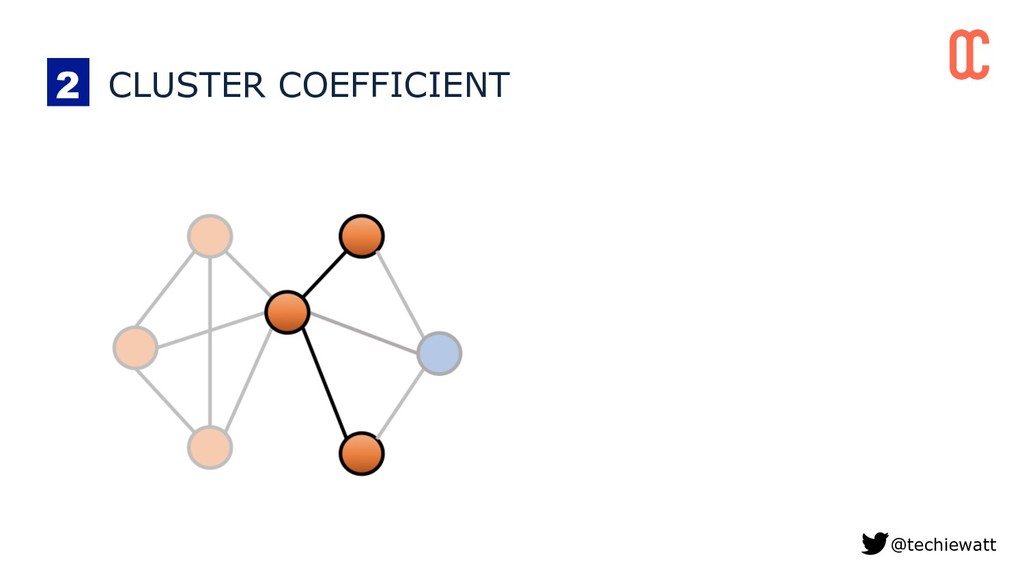
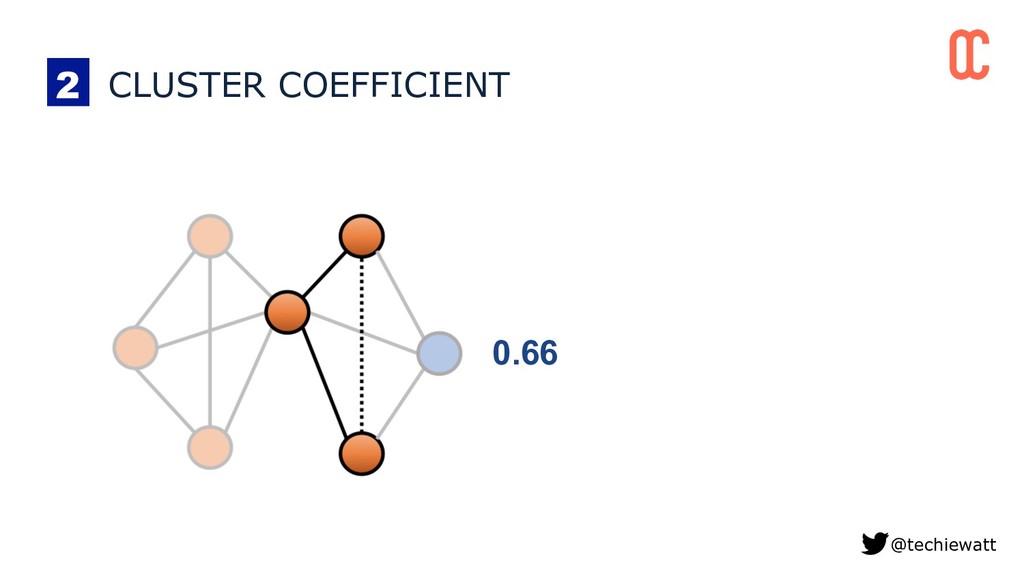
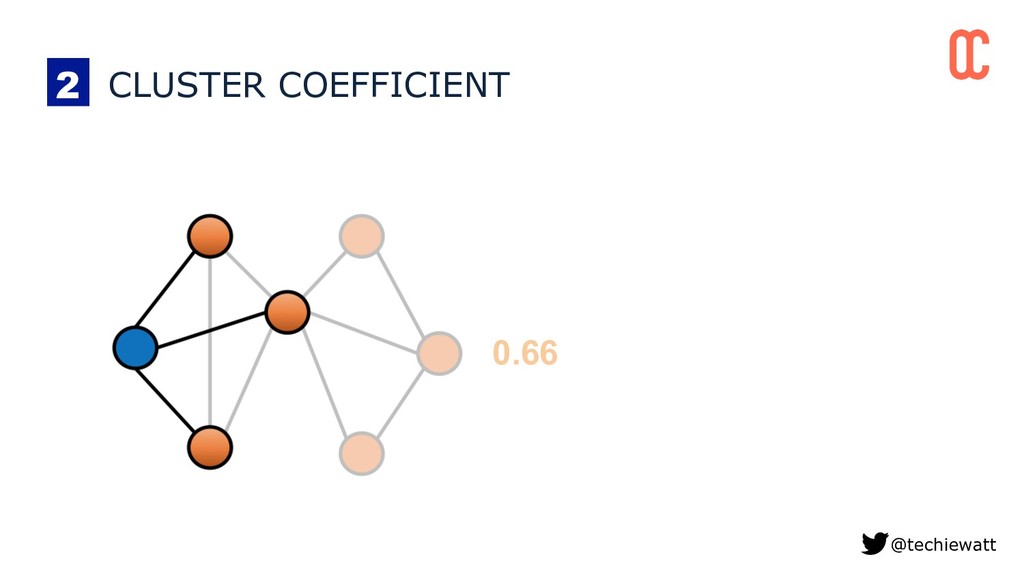
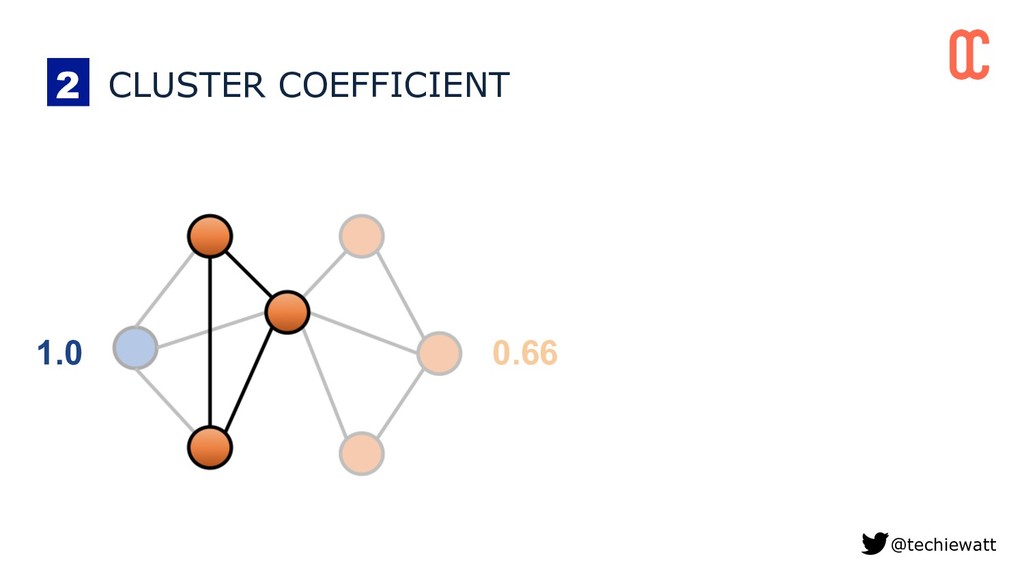
analysing connected data - using any appropriate graph-based approach or tools (visualisations, queries, statistics, algorithms) • Graph Algorithms ◦ Programmable process or set of rules: Leverages the mathematical properties of graphs to explore, classify and interpret connected data. A subset of tooling used to do graph analytics. @techiewatt GRAPH INSIGHTS 101
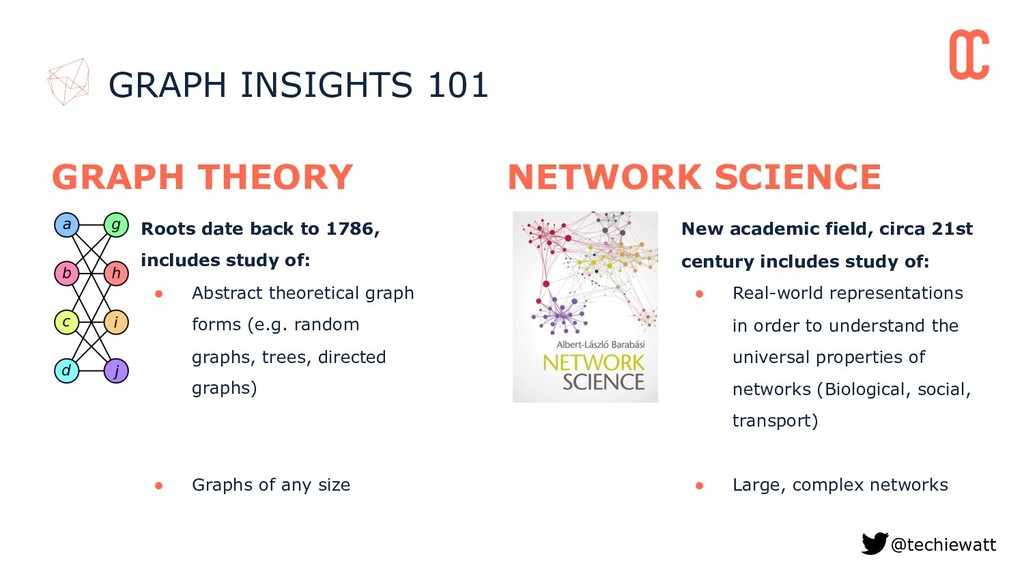
includes study of: • Real-world representations in order to understand the universal properties of networks (Biological, social, transport) • Large, complex networks Roots date back to 1786, includes study of: • Abstract theoretical graph forms (e.g. random graphs, trees, directed graphs) • Graphs of any size NETWORK SCIENCE GRAPH THEORY
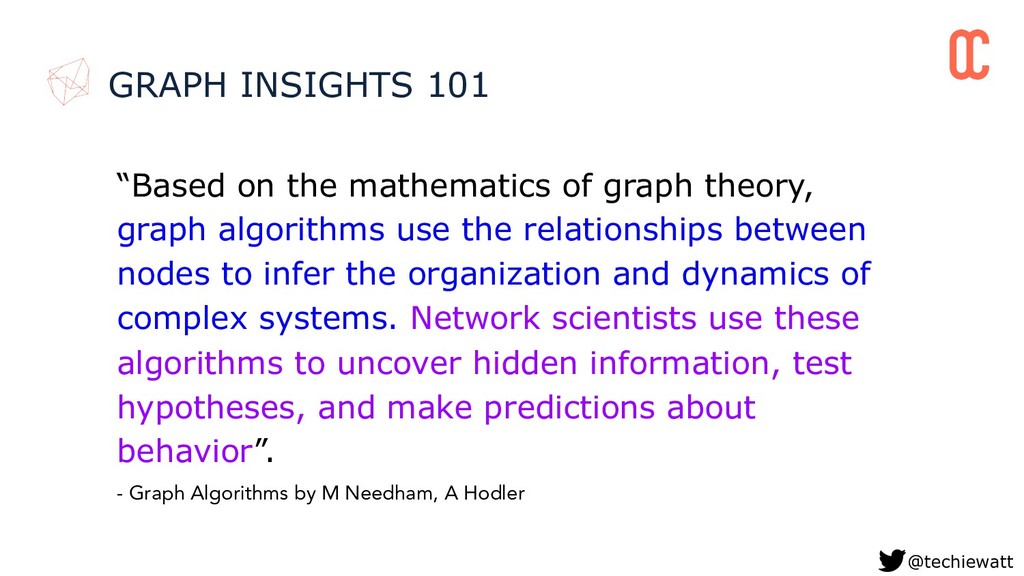
the relationships between nodes to infer the organization and dynamics of complex systems. Network scientists use these algorithms to uncover hidden information, test hypotheses, and make predictions about behavior”. - Graph Algorithms by M Needham, A Hodler @techiewatt GRAPH INSIGHTS 101
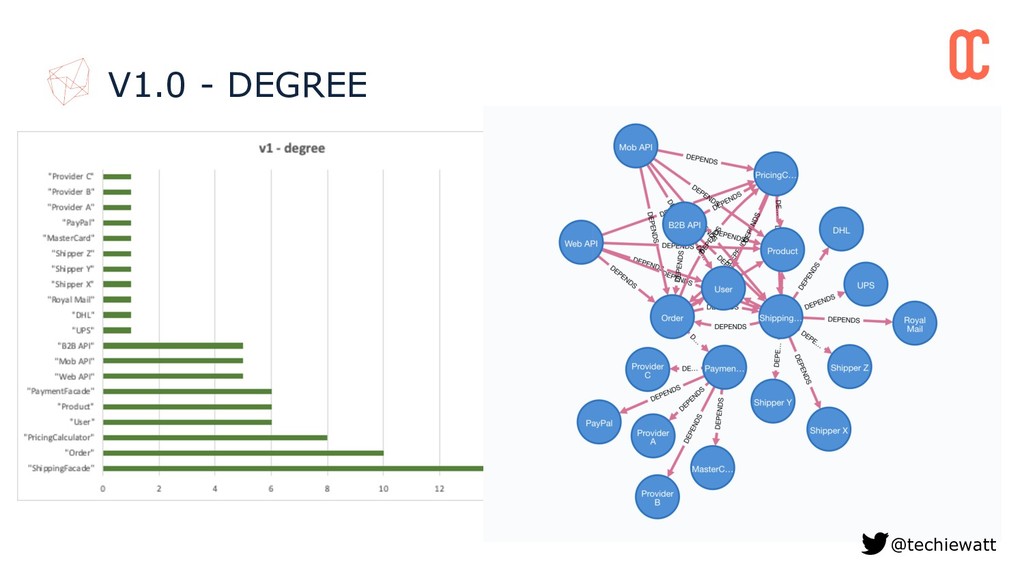
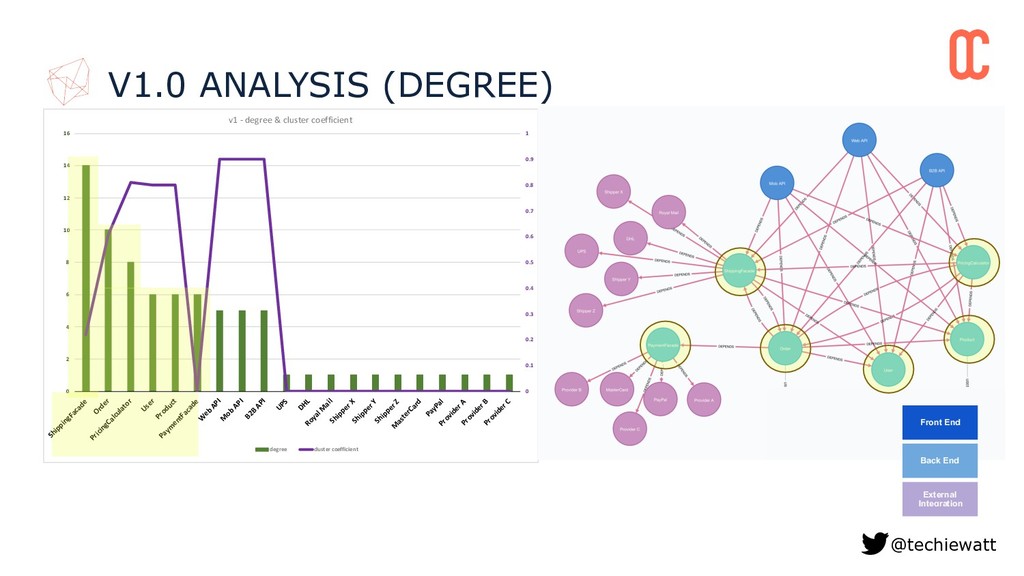
1 0 2 4 6 8 10 12 14 16 ShippingFacade Order PricingCalculator User Product Paym entFacade W eb API M ob API B2B API UPS DHL Royal M ail Shipper X Shipper Y Shipper Z M asterCard PayPal Provider A Provider B Provider C v1 - degree & cluster coefficient degree cluster coefficient V1.0 ANALYSIS (DEGREE) @techiewatt Front End Back End External Integration
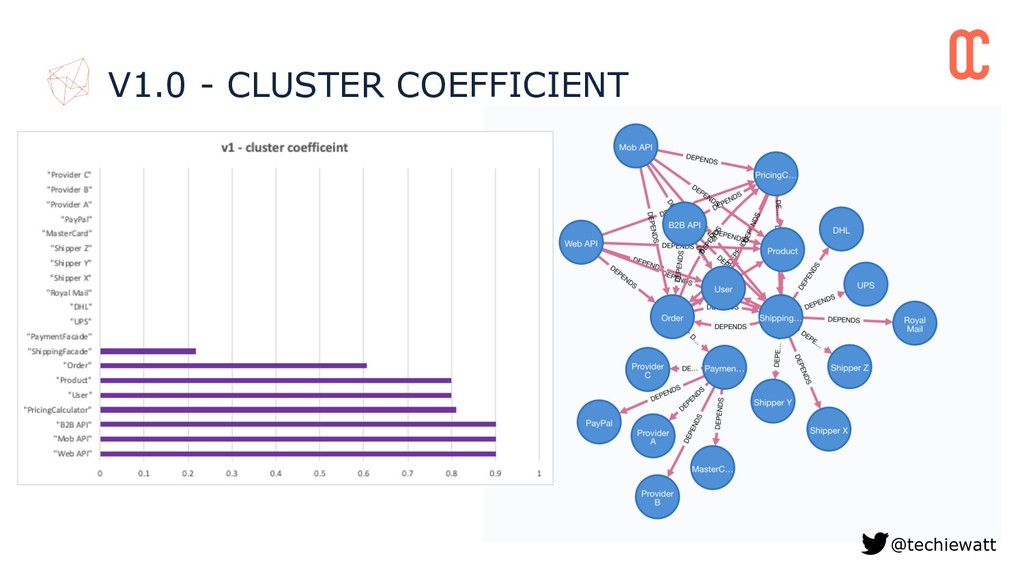
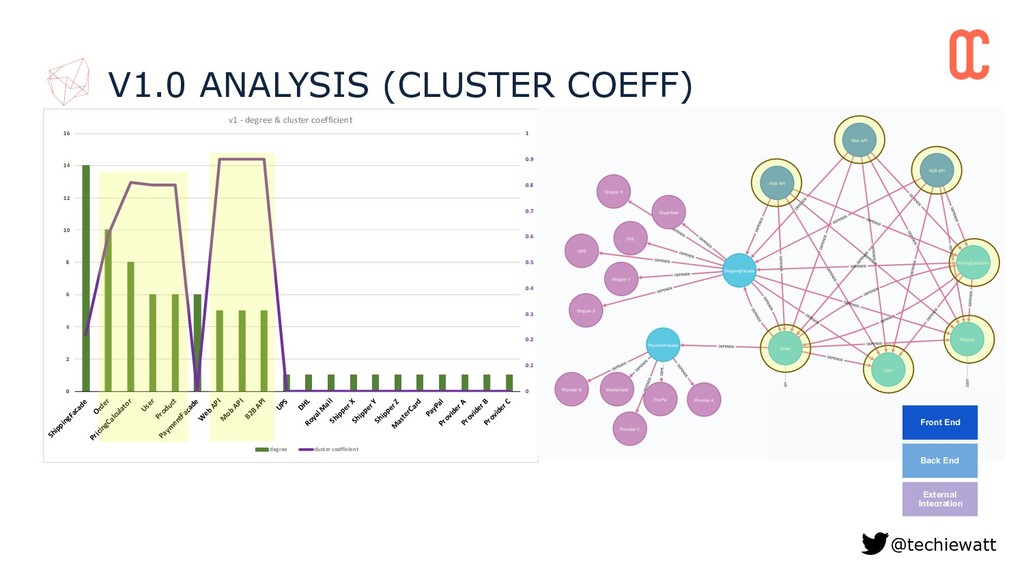
1 0 2 4 6 8 10 12 14 16 ShippingFacade Order PricingCalculator User Product Paym entFacade W eb API M ob API B2B API UPS DHL Royal M ail Shipper X Shipper Y Shipper Z M asterCard PayPal Provider A Provider B Provider C v1 - degree & cluster coefficient degree cluster coefficient V1.0 ANALYSIS (CLUSTER COEFF) @techiewatt Front End Back End External Integration
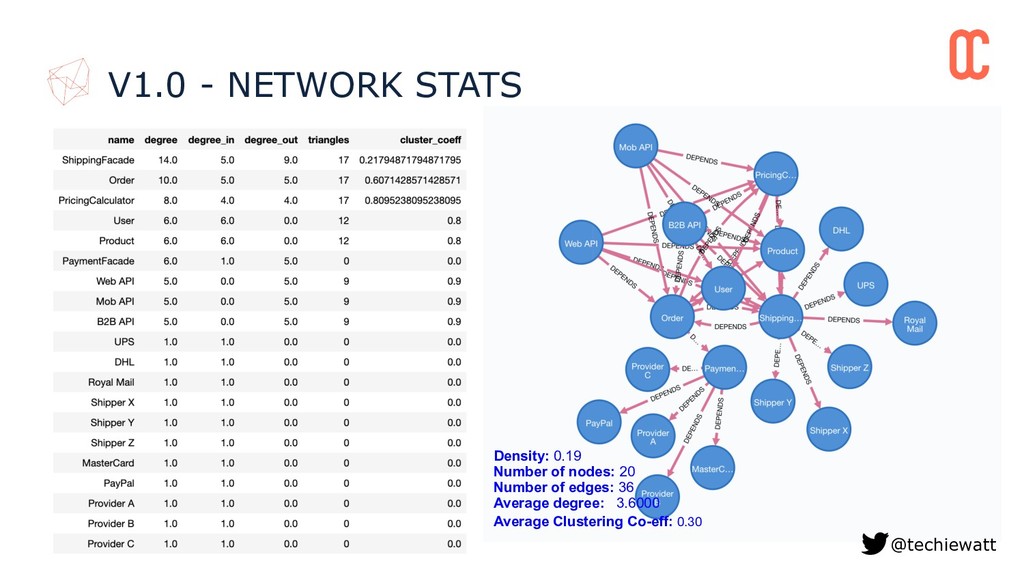
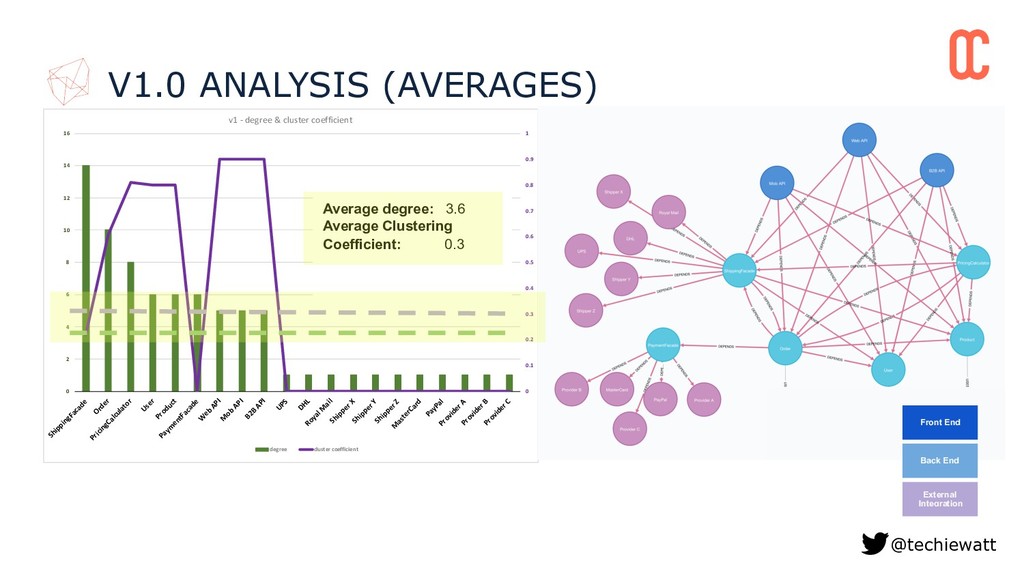
1 0 2 4 6 8 10 12 14 16 ShippingFacade Order PricingCalculator User Product Paym entFacade W eb API M ob API B2B API UPS DHL Royal M ail Shipper X Shipper Y Shipper Z M asterCard PayPal Provider A Provider B Provider C v1 - degree & cluster coefficient degree cluster coefficient V1.0 ANALYSIS (AVERAGES) @techiewatt Average degree: 3.6 Average Clustering Coefficient: 0.3 Front End Back End External Integration
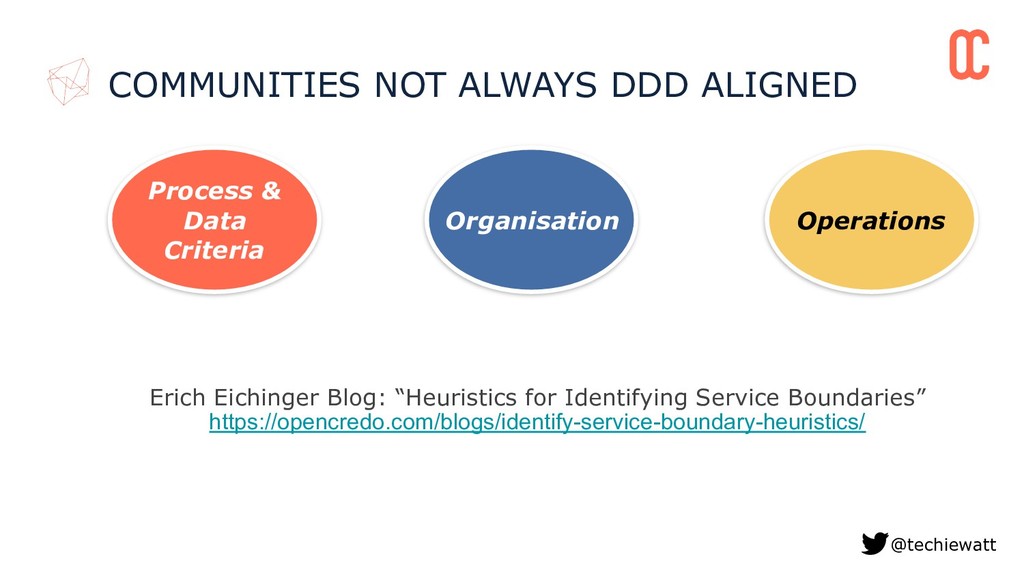
Organisation Operations Erich Eichinger Blog: “Heuristics for Identifying Service Boundaries” https://opencredo.com/blogs/identify-service-boundary-heuristics/
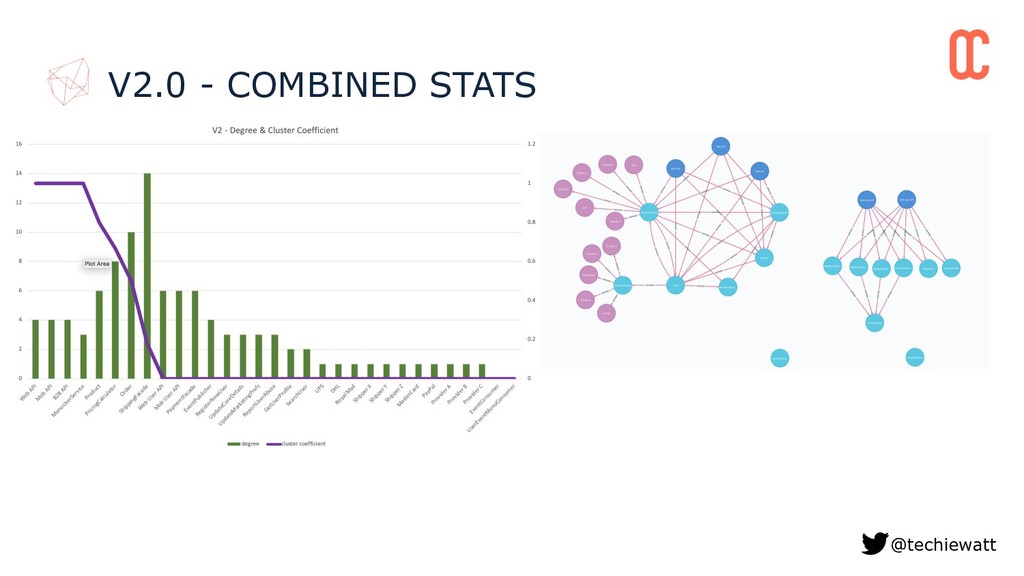
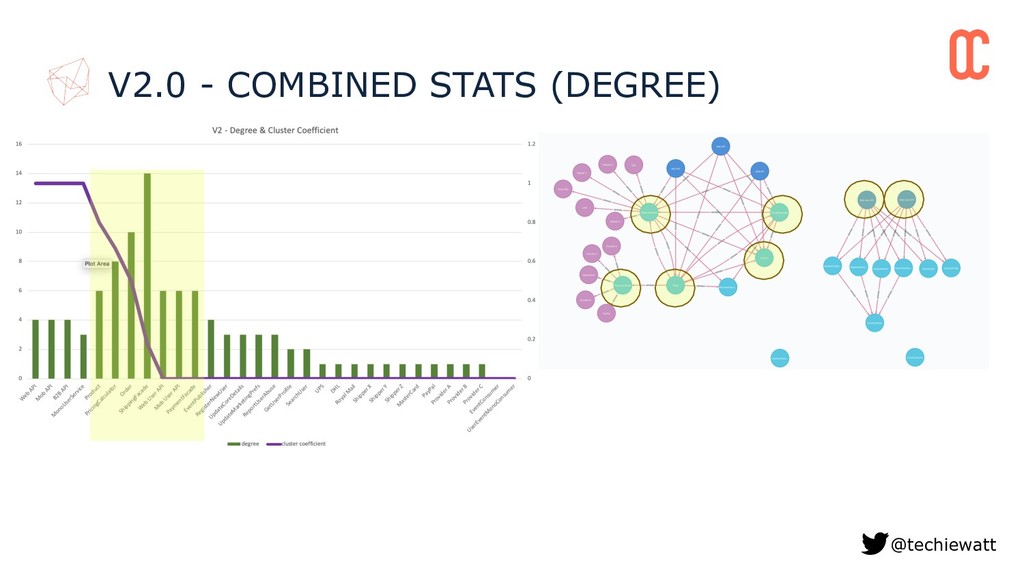
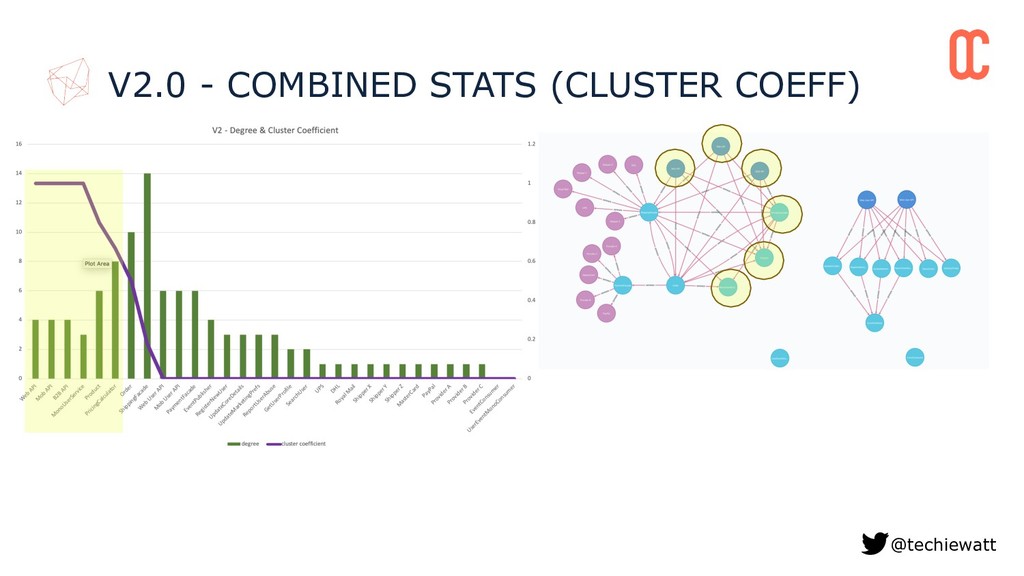
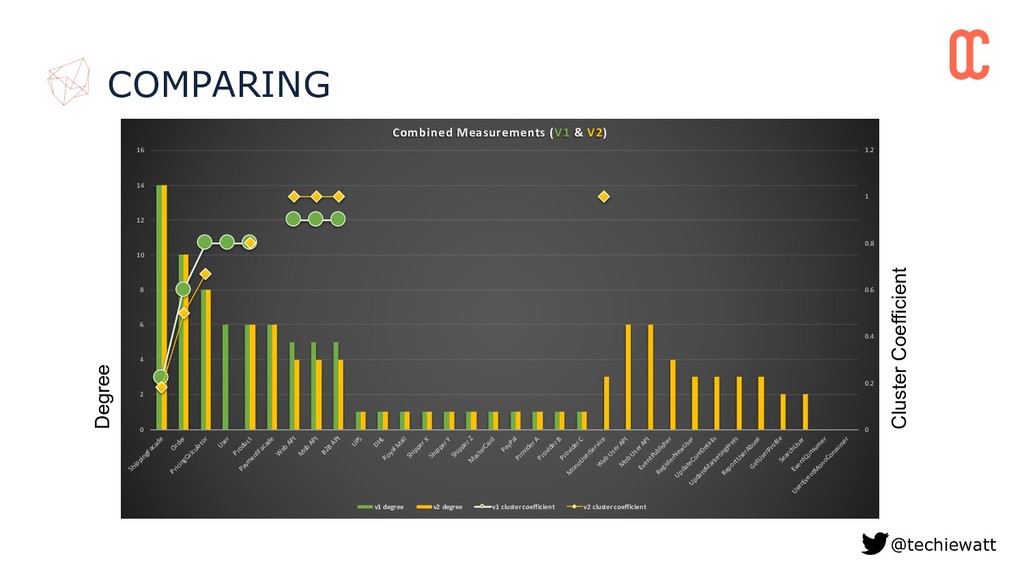
1 1.2 0 2 4 6 8 10 12 14 16 ShippingFacade Order PricingCalculator User Product Paym entFacade W eb API M ob API B2B API UPS DHL Royal M ail Shipper X Shipper Y Shipper Z M asterCard PayPal Provider A Provider B Provider C M onoUserService W eb User API M ob User API EventPublisher RegisterNew User UpdateCoreDetails UpdateM arketingPrefs ReportUserAbuse GetUserProfile SearchUser EventConsum er UserEventM onoConsum er Combined Measurements (V1 & V2) v1 degree v2 degree v1 cluster coefficient v2 cluster coefficient
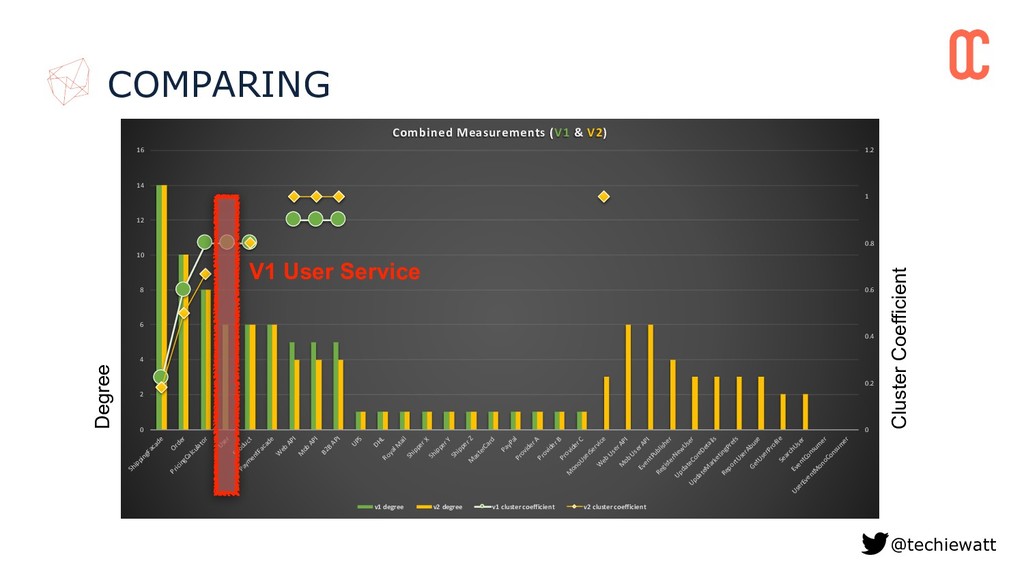
6 8 10 12 14 16 ShippingFacade Order PricingCalculator User Product Paym entFacade W eb API M ob API B2B API UPS DHL Royal M ail Shipper X Shipper Y Shipper Z M asterCard PayPal Provider A Provider B Provider C M onoUserService W eb User API M ob User API EventPublisher RegisterNew User UpdateCoreDetails UpdateM arketingPrefs ReportUserAbuse GetUserProfile SearchUser EventConsum er UserEventM onoConsum er Combined Measurements (V1 & V2) v1 degree v2 degree v1 cluster coefficient v2 cluster coefficient Degree Cluster Coefficient @techiewatt COMPARING V1 User Service
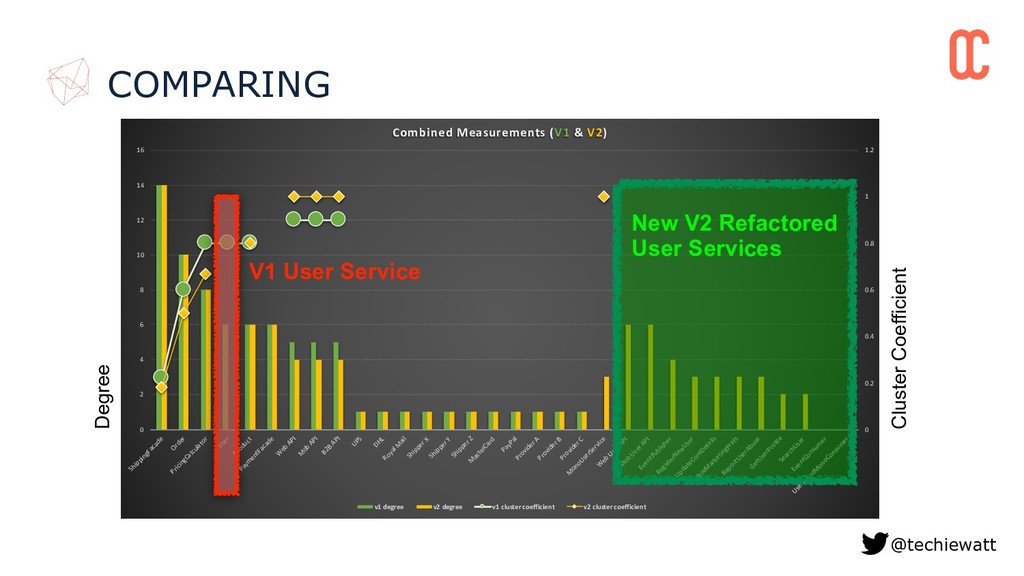
6 8 10 12 14 16 ShippingFacade Order PricingCalculator User Product Paym entFacade W eb API M ob API B2B API UPS DHL Royal M ail Shipper X Shipper Y Shipper Z M asterCard PayPal Provider A Provider B Provider C M onoUserService W eb User API M ob User API EventPublisher RegisterNew User UpdateCoreDetails UpdateM arketingPrefs ReportUserAbuse GetUserProfile SearchUser EventConsum er UserEventM onoConsum er Combined Measurements (V1 & V2) v1 degree v2 degree v1 cluster coefficient v2 cluster coefficient Degree Cluster Coefficient @techiewatt COMPARING V1 User Service New V2 Refactored User Services
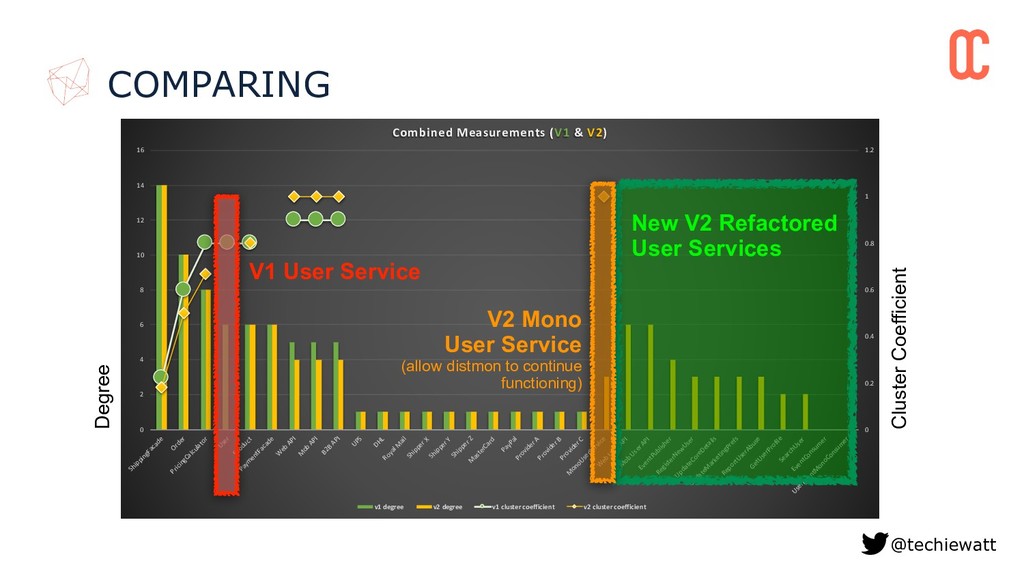
0 2 4 6 8 10 12 14 16 ShippingFacade Order PricingCalculator User Product Paym entFacade W eb API M ob API B2B API UPS DHL Royal M ail Shipper X Shipper Y Shipper Z M asterCard PayPal Provider A Provider B Provider C M onoUserService W eb User API M ob User API EventPublisher RegisterNew User UpdateCoreDetails UpdateM arketingPrefs ReportUserAbuse GetUserProfile SearchUser EventConsum er UserEventM onoConsum er Combined Measurements (V1 & V2) v1 degree v2 degree v1 cluster coefficient v2 cluster coefficient @techiewatt COMPARING New V2 Refactored User Services V1 User Service V2 Mono User Service (allow distmon to continue functioning)
1 1.2 0 2 4 6 8 10 12 14 16 ShippingFacade Order PricingCalculator User Product Paym entFacade W eb API M ob API B2B API UPS DHL Royal M ail Shipper X Shipper Y Shipper Z M asterCard PayPal Provider A Provider B Provider C M onoUserService W eb User API M ob User API EventPublisher RegisterNew User UpdateCoreDetails UpdateM arketingPrefs ReportUserAbuse GetUserProfile SearchUser EventConsum er UserEventM onoConsum er Combined Measurements (V1 & V2) v1 degree v2 degree v1 cluster coefficient v2 cluster coefficient
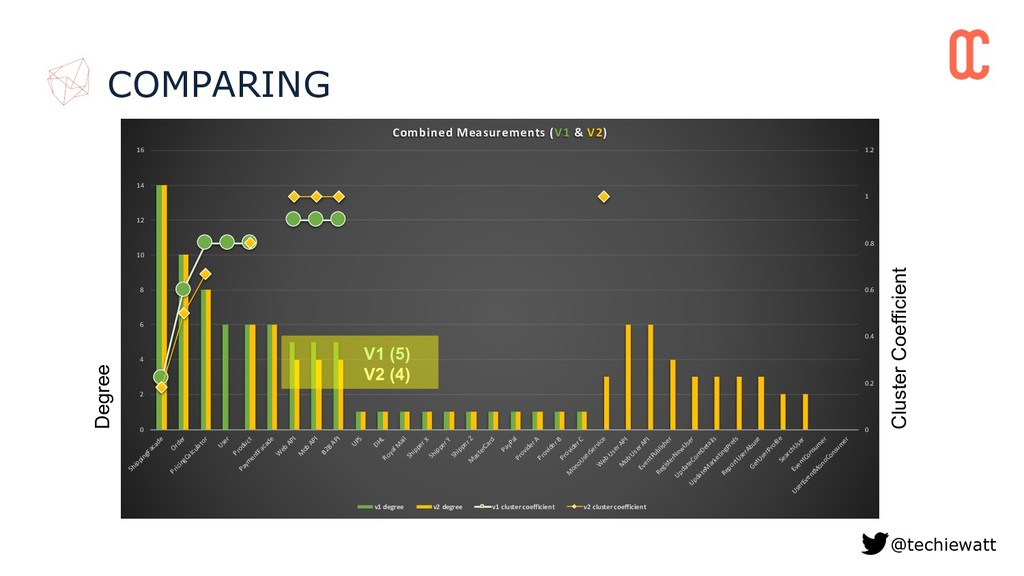
6 8 10 12 14 16 ShippingFacade Order PricingCalculator User Product Paym entFacade W eb API M ob API B2B API UPS DHL Royal M ail Shipper X Shipper Y Shipper Z M asterCard PayPal Provider A Provider B Provider C M onoUserService W eb User API M ob User API EventPublisher RegisterNew User UpdateCoreDetails UpdateM arketingPrefs ReportUserAbuse GetUserProfile SearchUser EventConsum er UserEventM onoConsum er Combined Measurements (V1 & V2) v1 degree v2 degree v1 cluster coefficient v2 cluster coefficient Degree Cluster Coefficient @techiewatt COMPARING V1 (5) V2 (4)
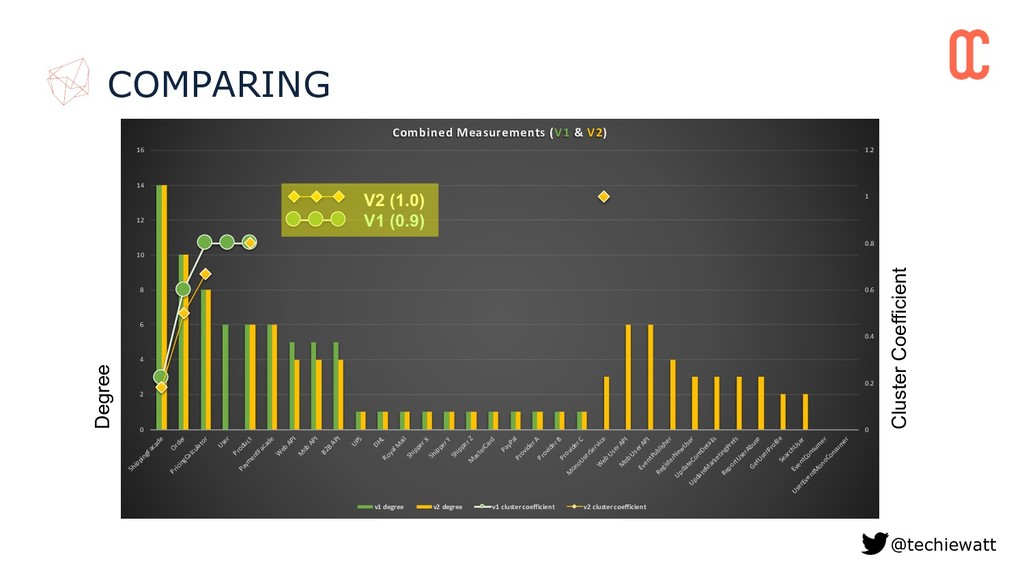
6 8 10 12 14 16 ShippingFacade Order PricingCalculator User Product Paym entFacade W eb API M ob API B2B API UPS DHL Royal M ail Shipper X Shipper Y Shipper Z M asterCard PayPal Provider A Provider B Provider C M onoUserService W eb User API M ob User API EventPublisher RegisterNew User UpdateCoreDetails UpdateM arketingPrefs ReportUserAbuse GetUserProfile SearchUser EventConsum er UserEventM onoConsum er Combined Measurements (V1 & V2) v1 degree v2 degree v1 cluster coefficient v2 cluster coefficient Degree Cluster Coefficient @techiewatt COMPARING V2 (1.0) V1 (0.9)
can extract metrics and KPIs from a microservices architecture using graph theory AND use these to gain insight into the structure and characteristics of your microservices architecture
can extract metrics and KPIs from a microservices architecture using graph theory AND use these to gain insight into the structure and characteristics of your microservices architecture
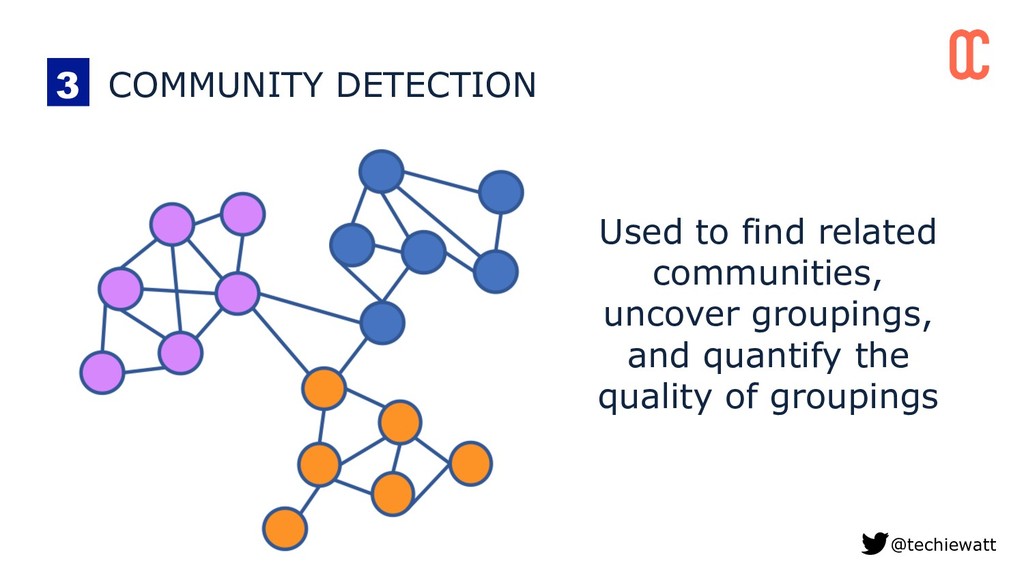
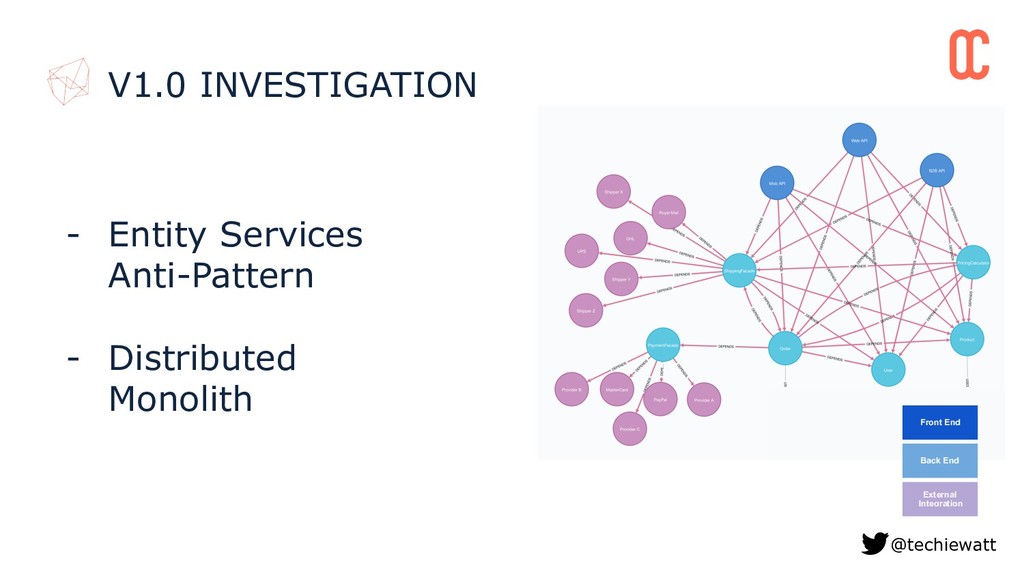
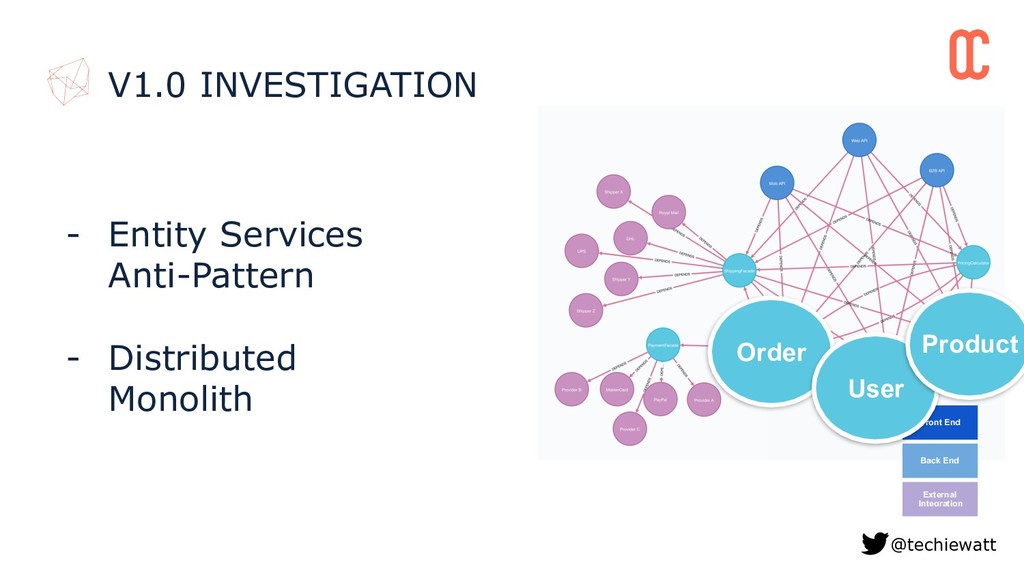
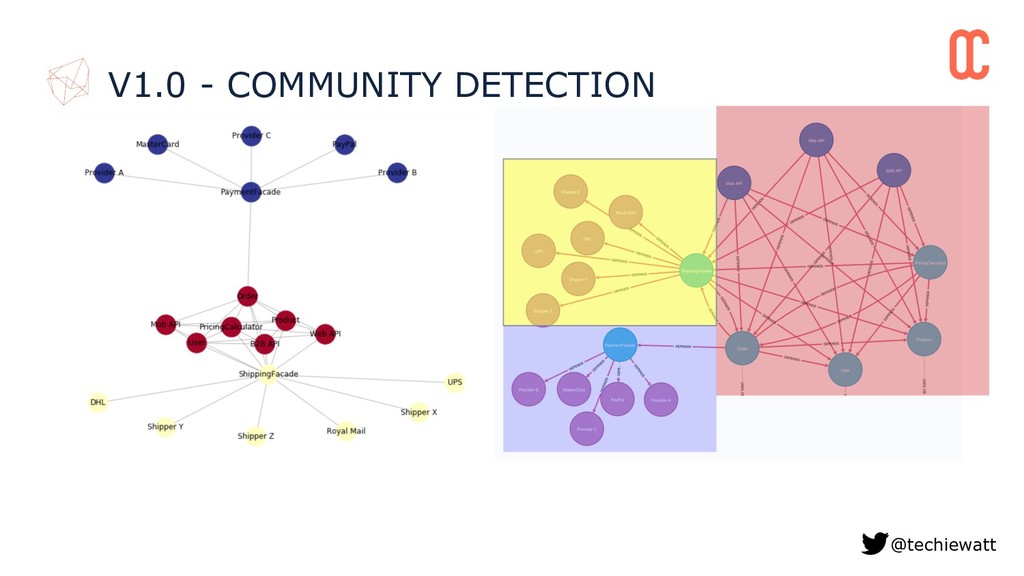
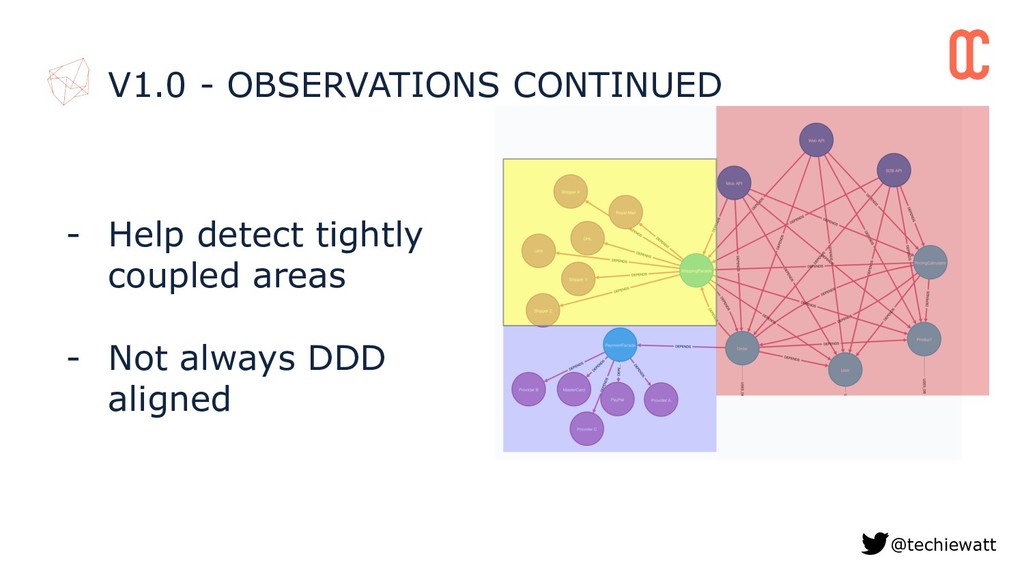
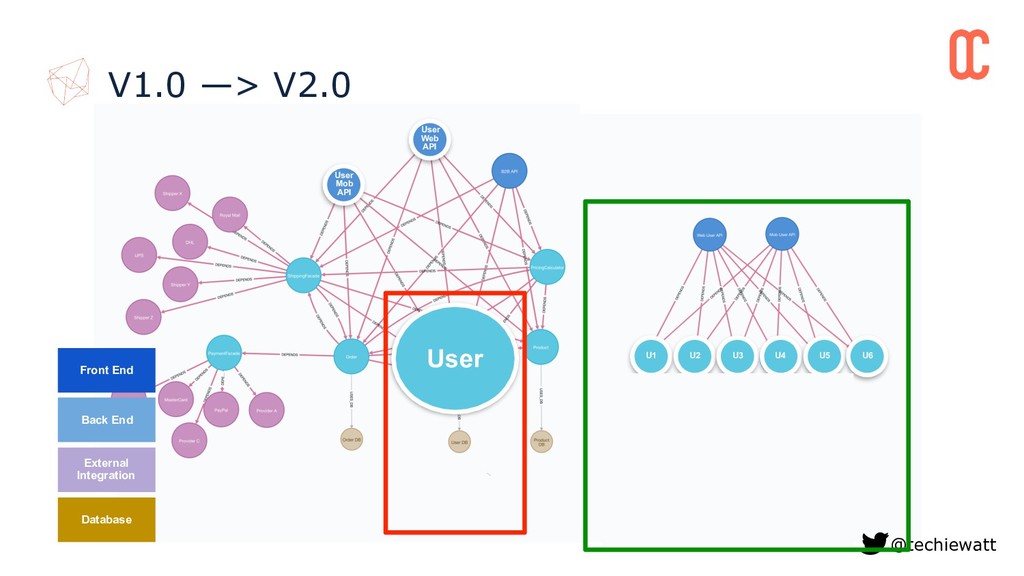
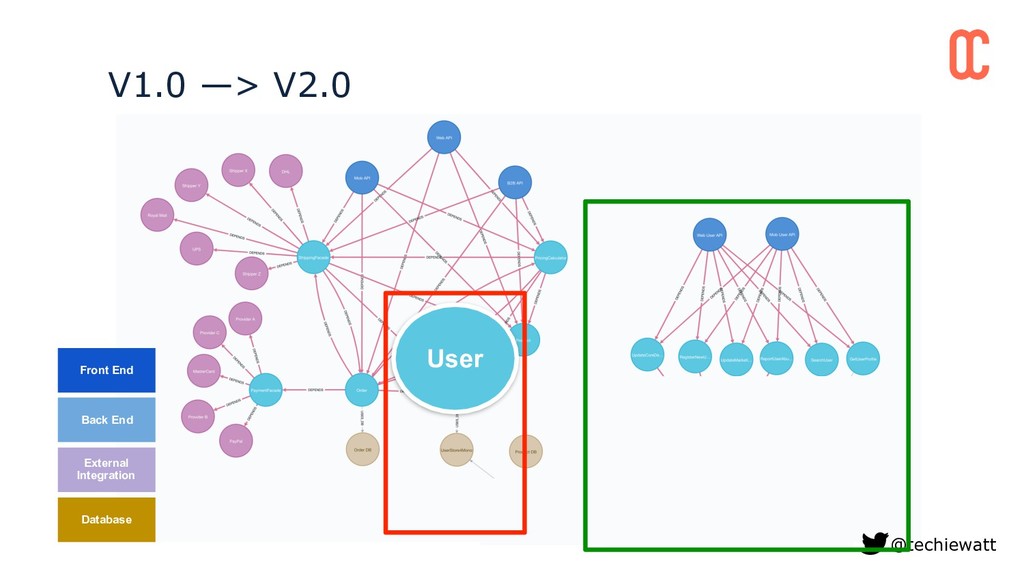
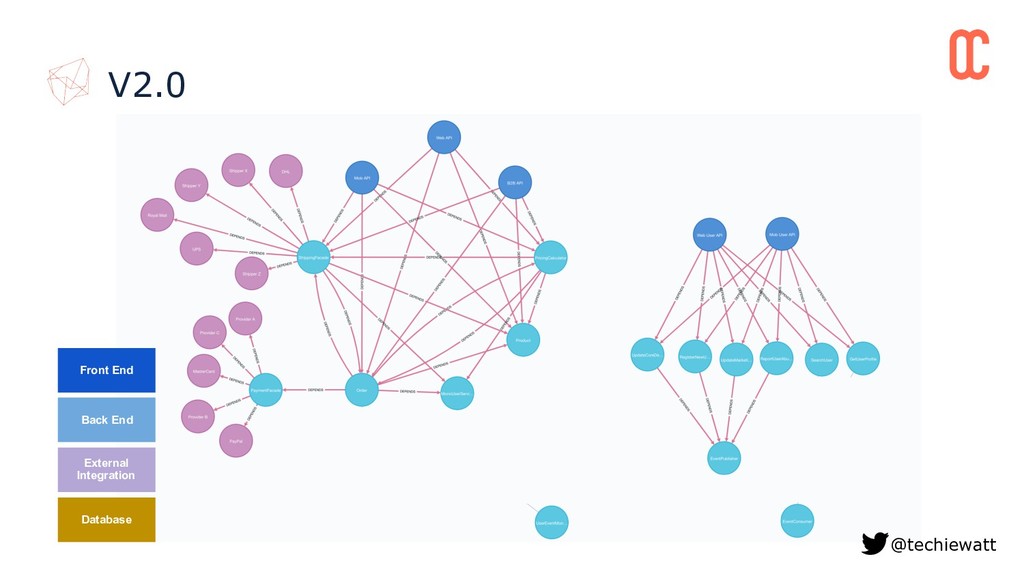
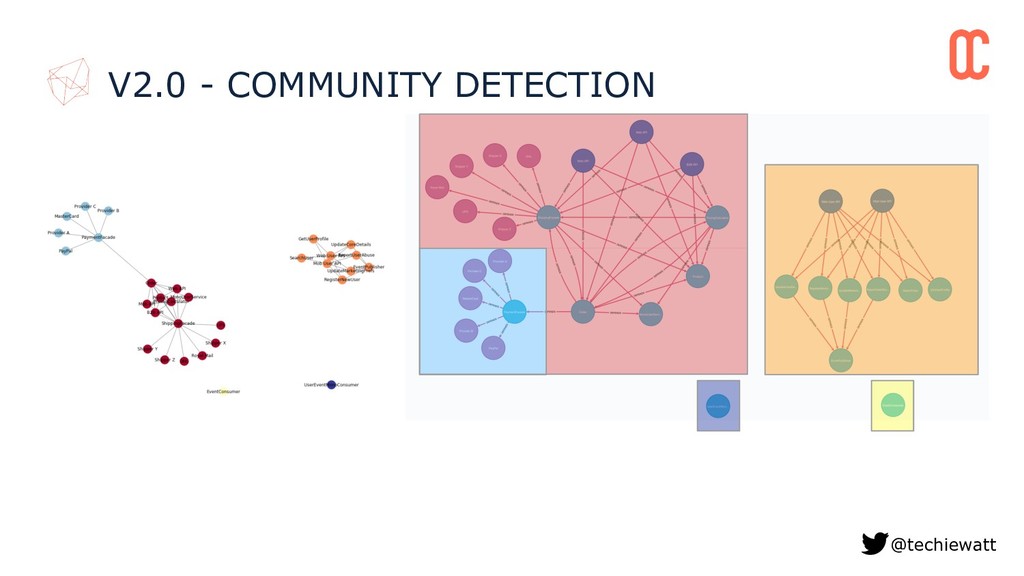
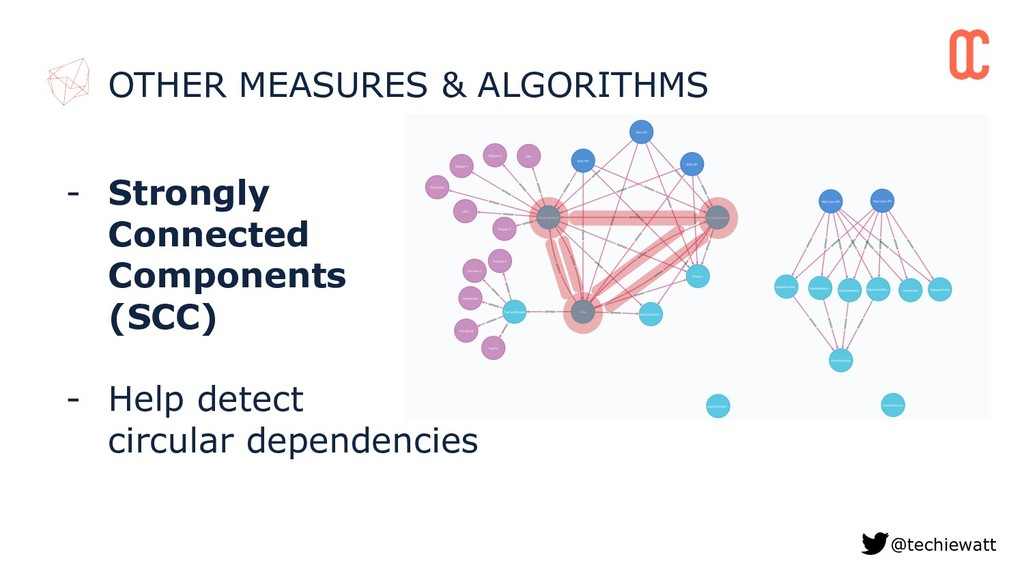
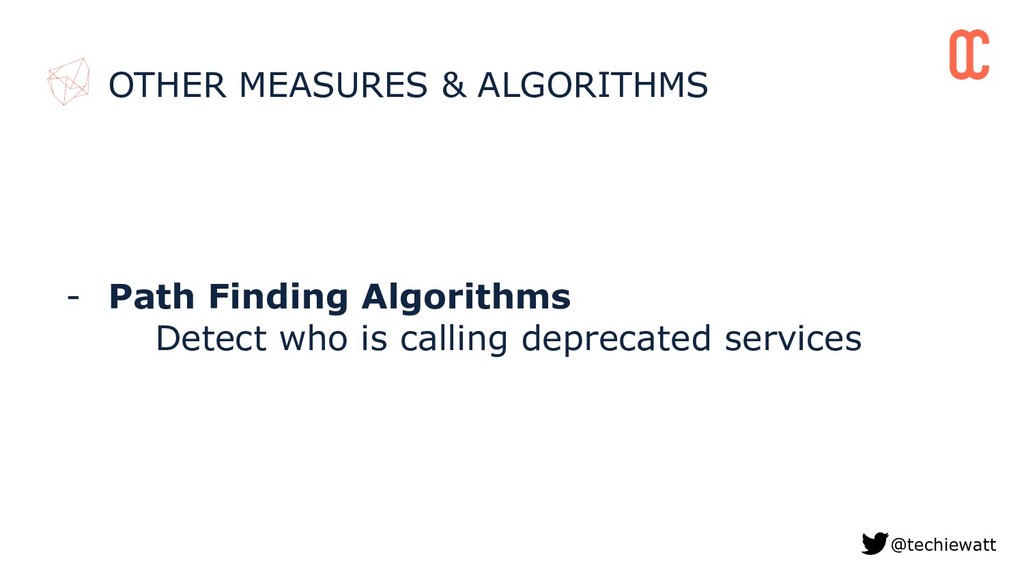
detect tightly coupled (distributed monolith) architectures Demonstrated using community detection algorithms to uncover related groupings (boundaries) of microservices