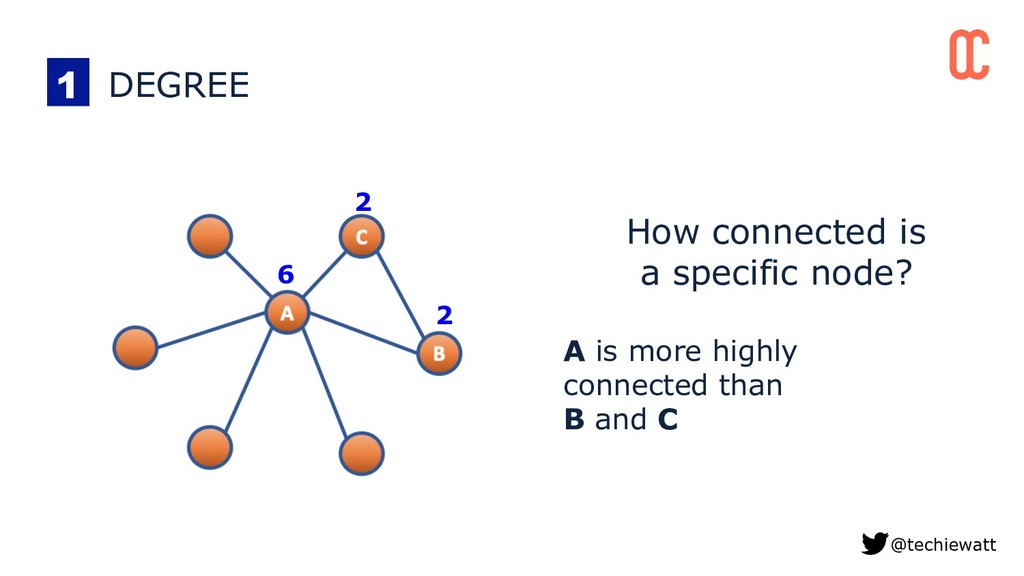
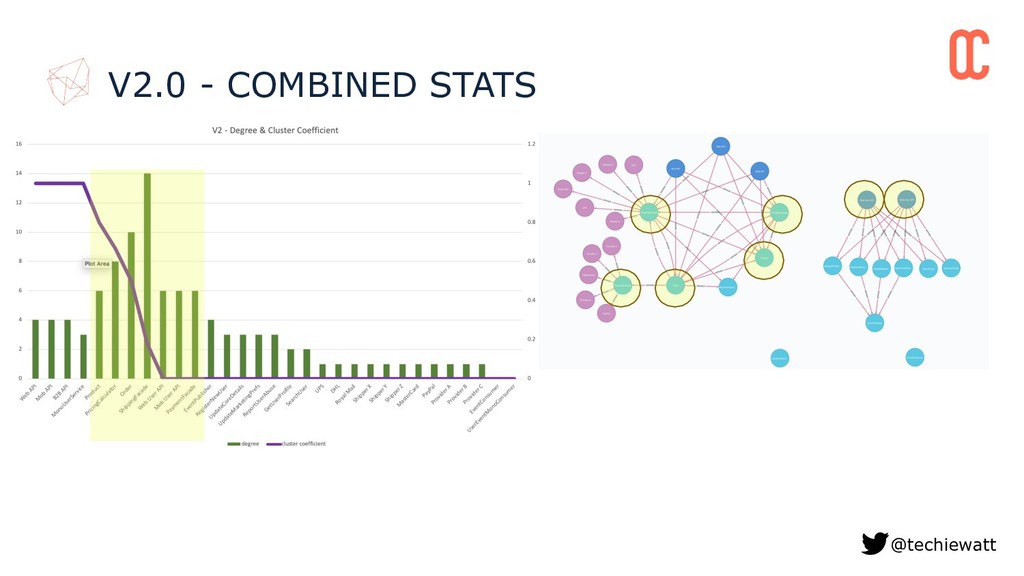
can extract metrics and KPIs from a microservices architecture using network science AND use these to gain insight into the structure and characteristics of your microservices architecture
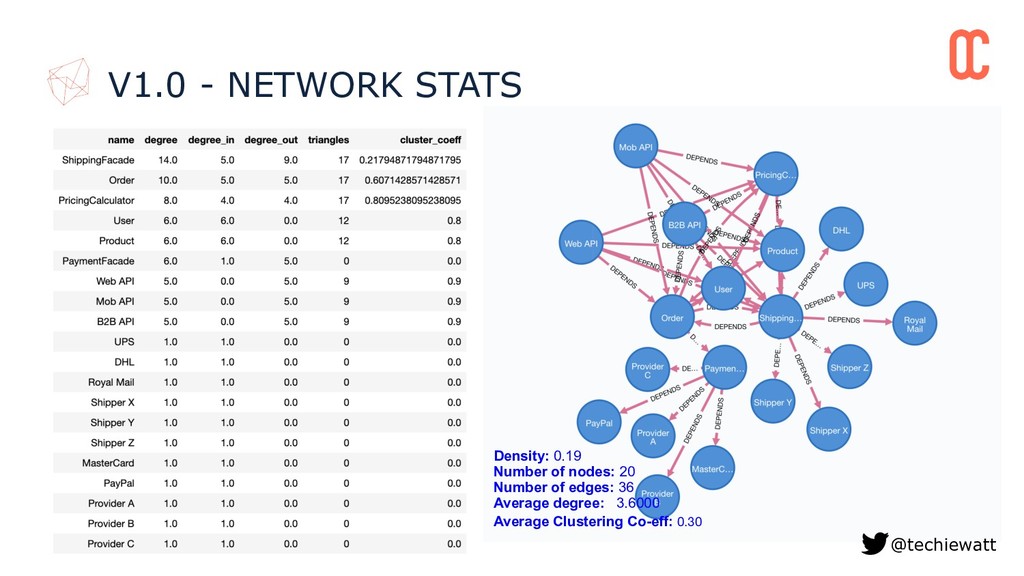
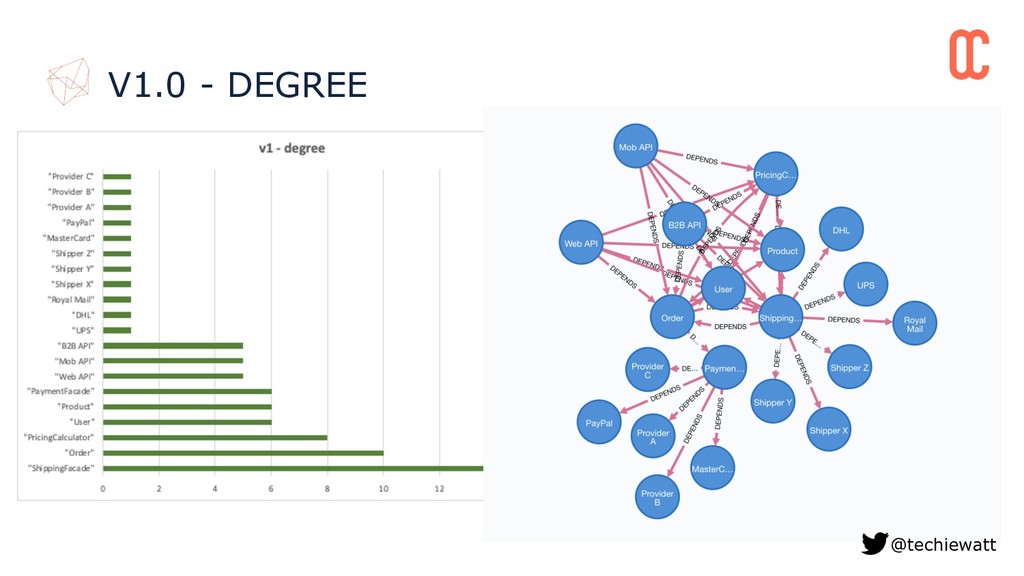
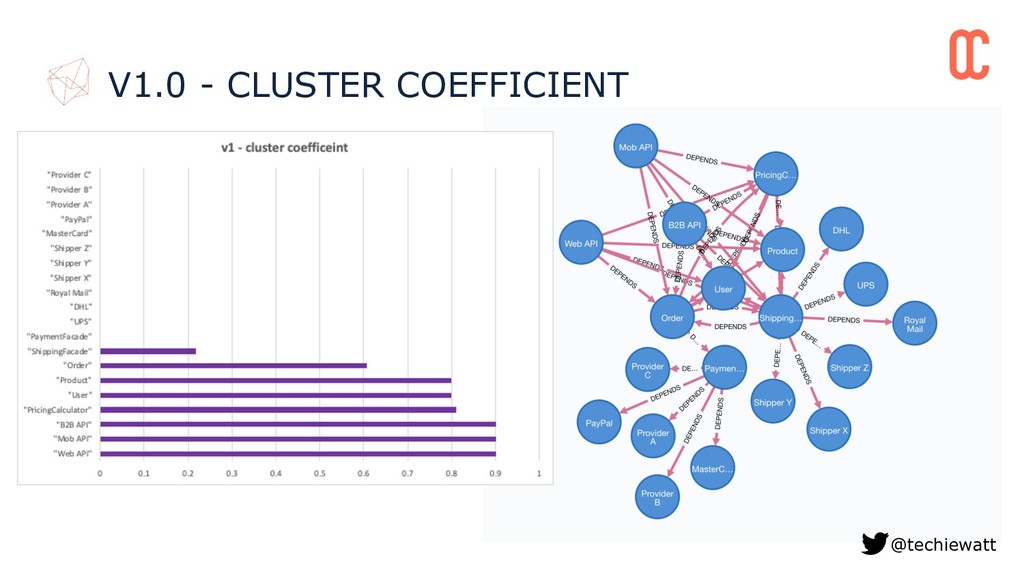
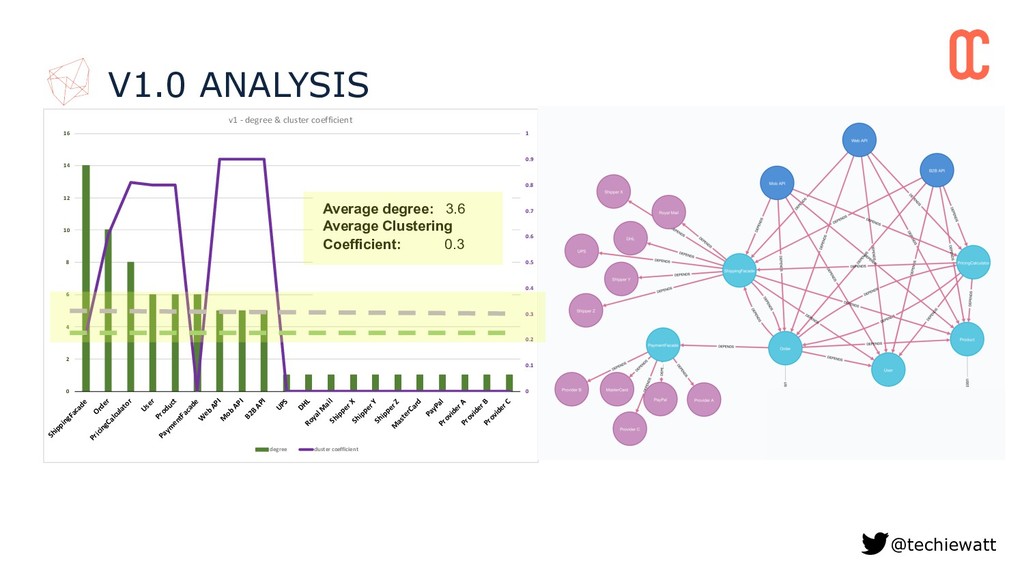
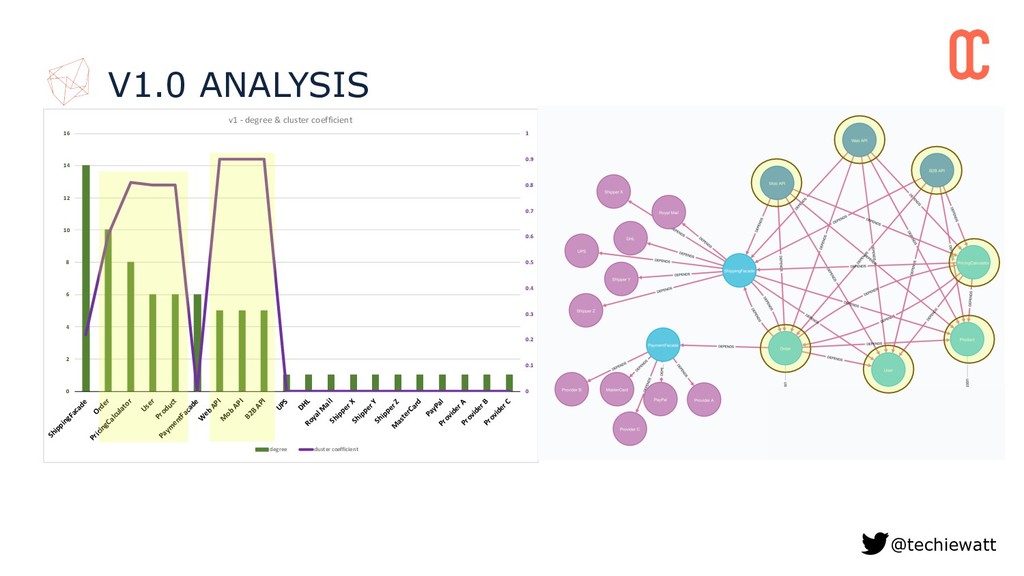
1 0 2 4 6 8 10 12 14 16 ShippingFacade Order PricingCalculator User Product Paym entFacade W eb API M ob API B2B API UPS DHL Royal M ail Shipper X Shipper Y Shipper Z M asterCard PayPal Provider A Provider B Provider C v1 - degree & cluster coefficient degree cluster coefficient V1.0 ANALYSIS @techiewatt Average degree: 3.6 Average Clustering Coefficient: 0.3
1 0 2 4 6 8 10 12 14 16 ShippingFacade Order PricingCalculator User Product Paym entFacade W eb API M ob API B2B API UPS DHL Royal M ail Shipper X Shipper Y Shipper Z M asterCard PayPal Provider A Provider B Provider C v1 - degree & cluster coefficient degree cluster coefficient V1.0 ANALYSIS @techiewatt
1 0 2 4 6 8 10 12 14 16 ShippingFacade Order PricingCalculator User Product Paym entFacade W eb API M ob API B2B API UPS DHL Royal M ail Shipper X Shipper Y Shipper Z M asterCard PayPal Provider A Provider B Provider C v1 - degree & cluster coefficient degree cluster coefficient V1.0 ANALYSIS @techiewatt
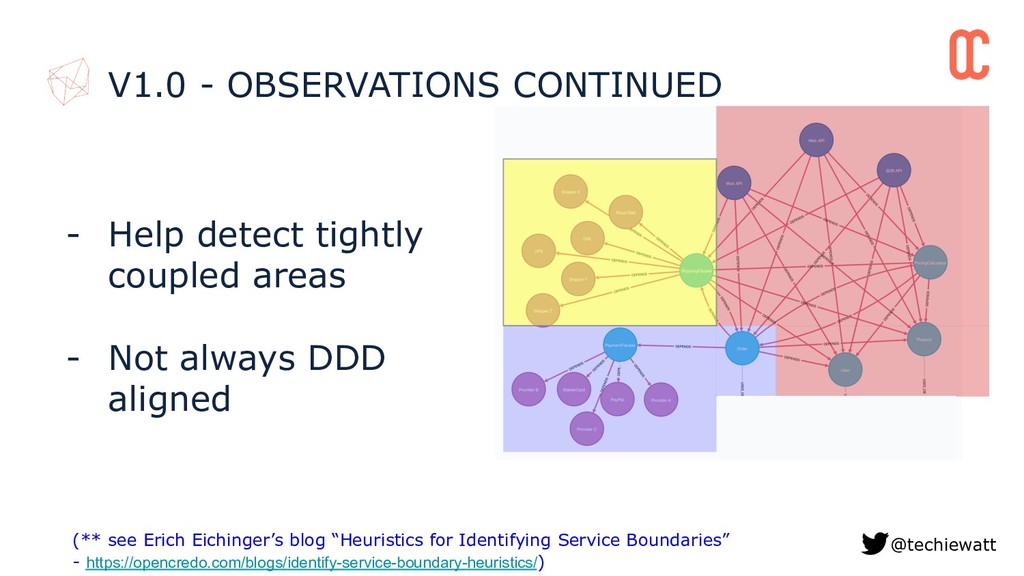
areas - Not always DDD aligned (** see Erich Eichinger’s blog “Heuristics for Identifying Service Boundaries” - https://opencredo.com/blogs/identify-service-boundary-heuristics/)
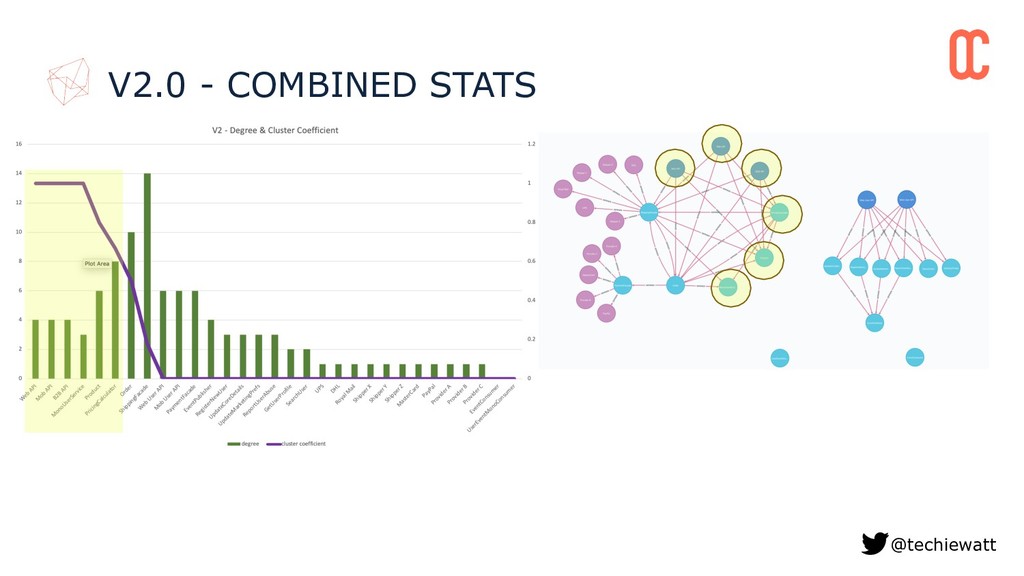
can extract metrics and KPIs from a microservices architecture using network science AND use these to gain insight into the structure and characteristics of your microservices architecture
can extract metrics and KPIs from a microservices architecture using network science AND use these to gain insight into the structure and characteristics of your microservices architecture
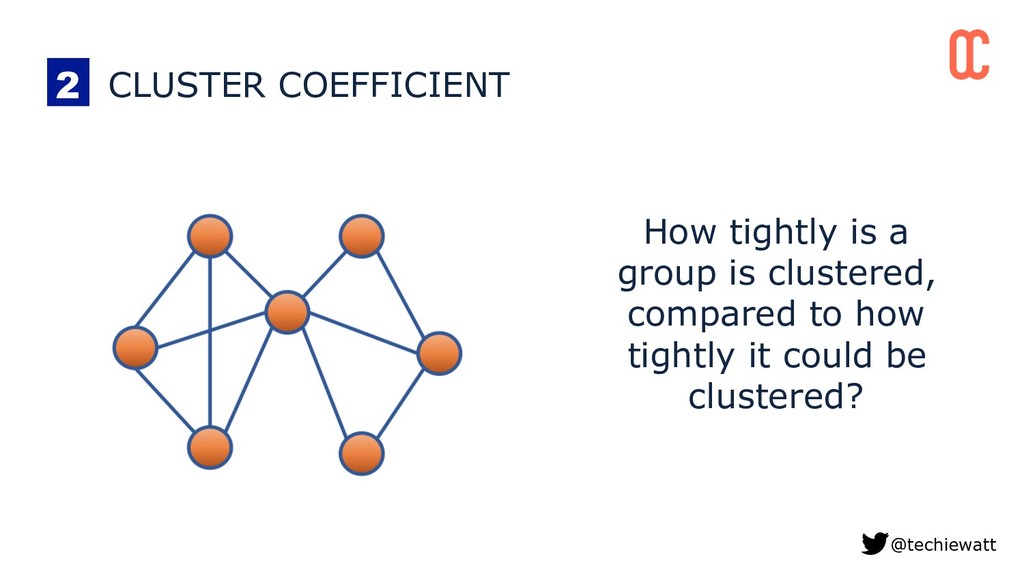
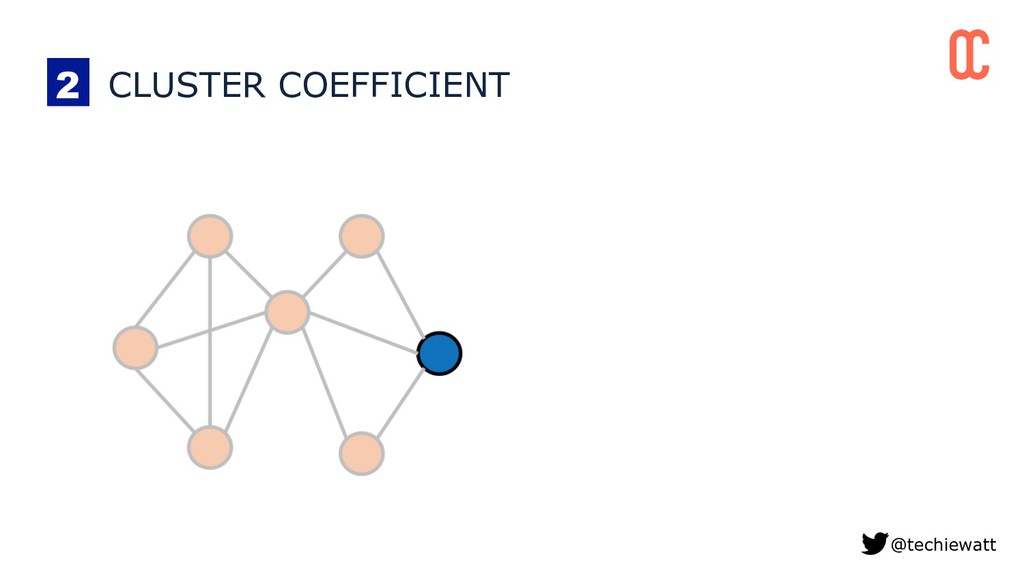
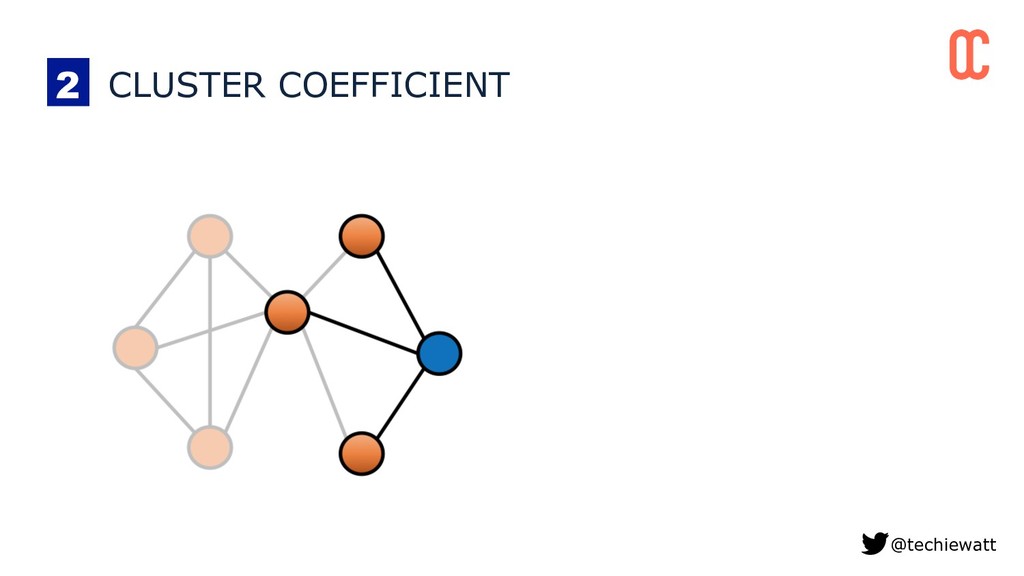
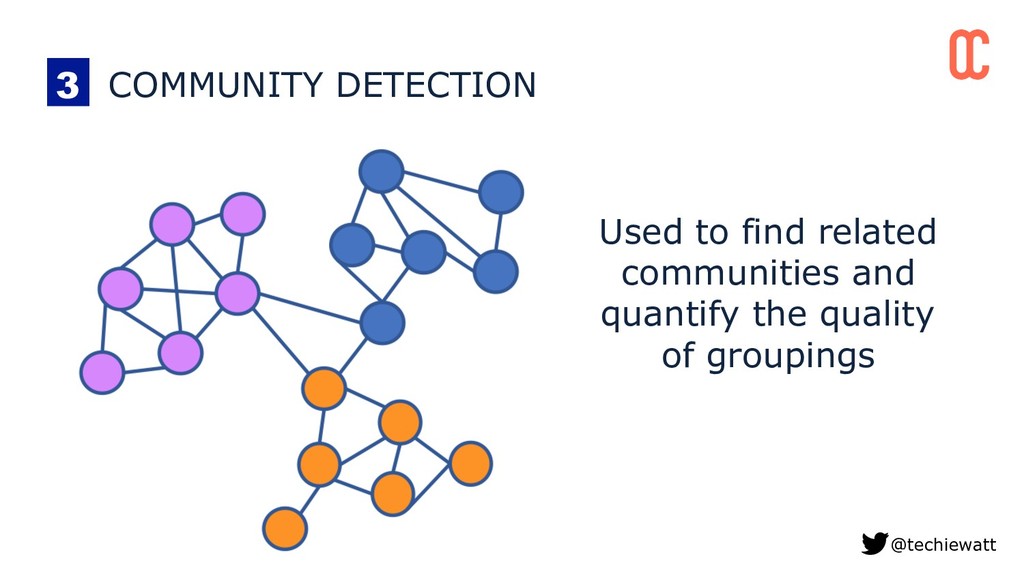
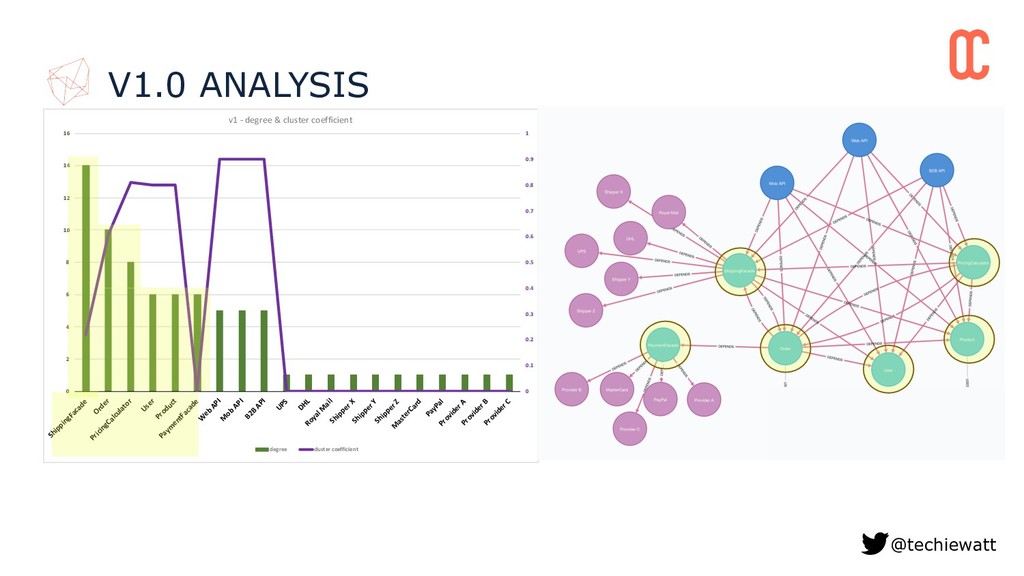
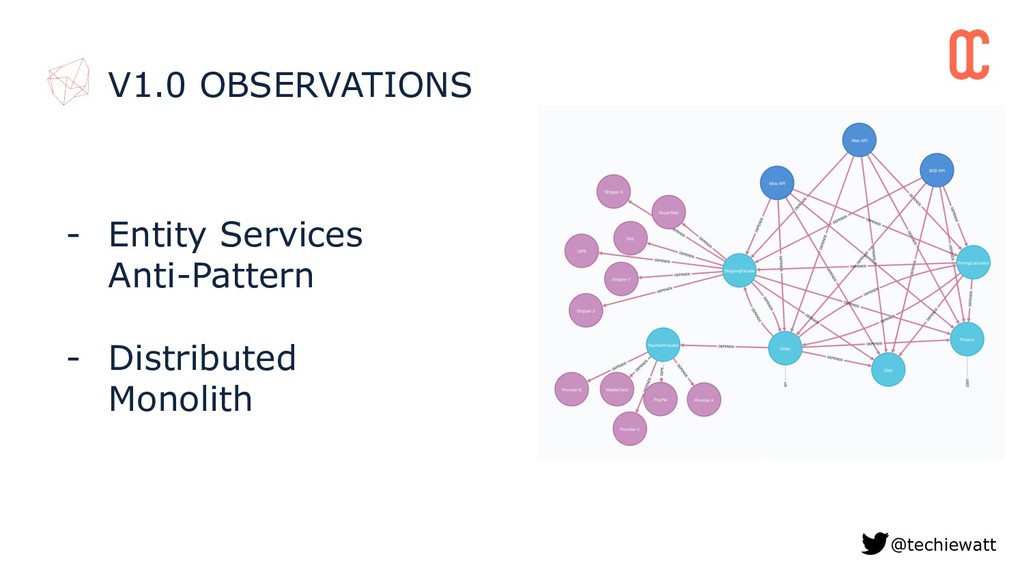
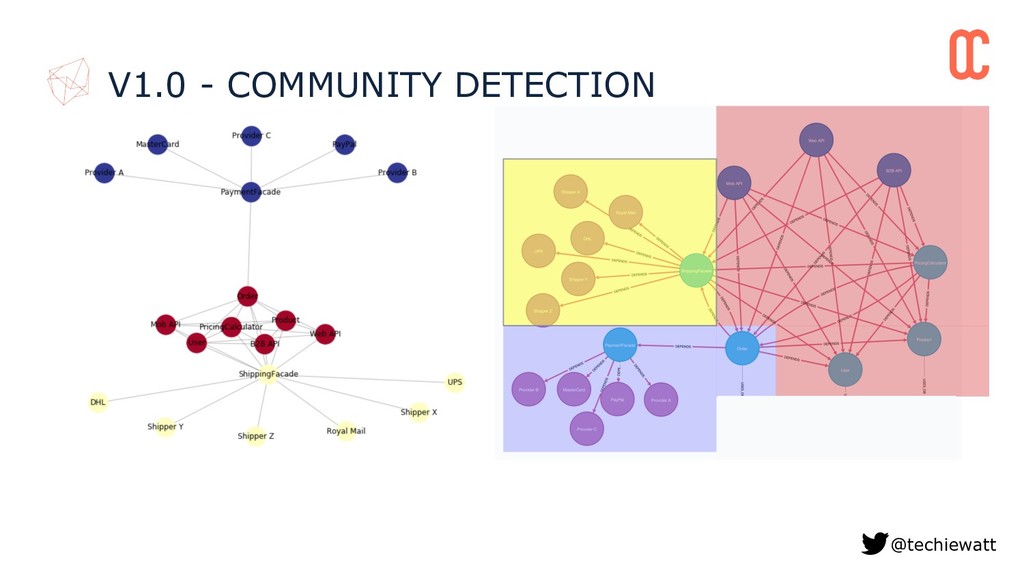
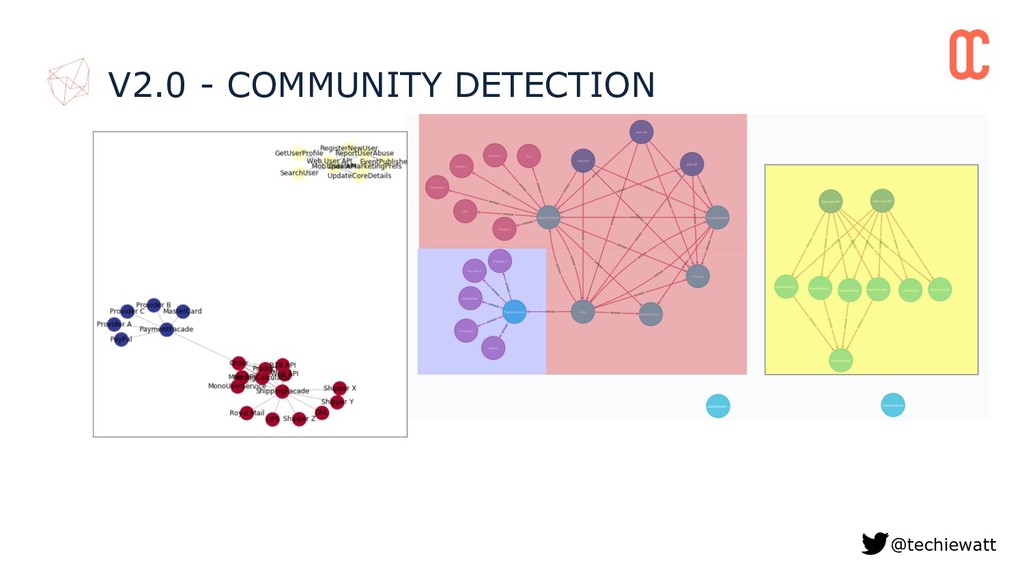
detect tightly coupled (distributed monolith) architectures Demonstrated using community detection algorithms to uncover related groupings (boundaries) of microservices