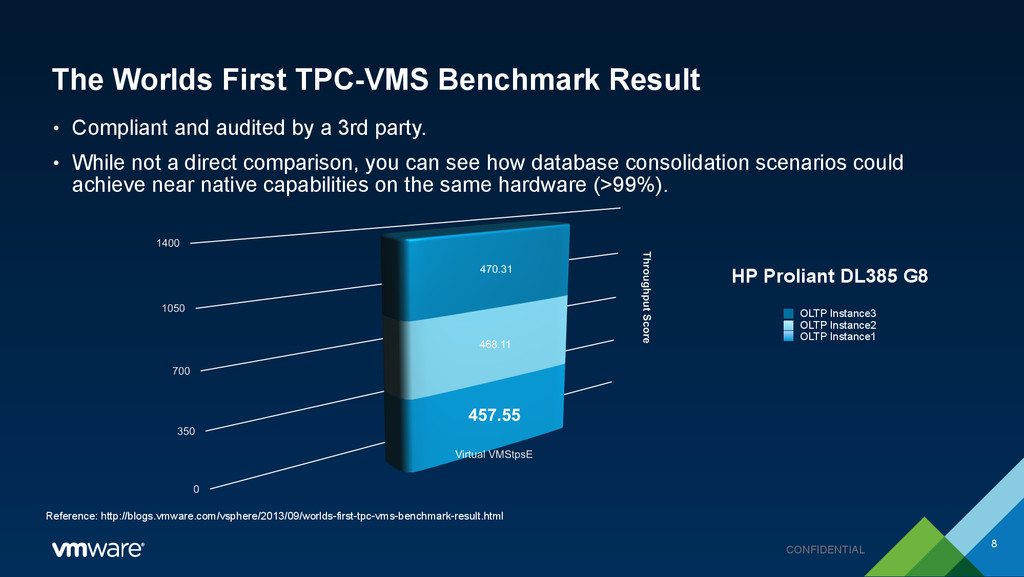
audited by a 3rd party. • While not a direct comparison, you can see how database consolidation scenarios could achieve near native capabilities on the same hardware (>99%). 8 Reference: http://blogs.vmware.com/vsphere/2013/09/worlds-first-tpc-vms-benchmark-result.html OLTP Instance1 OLTP Instance2 OLTP Instance3 HP Proliant DL385 G8
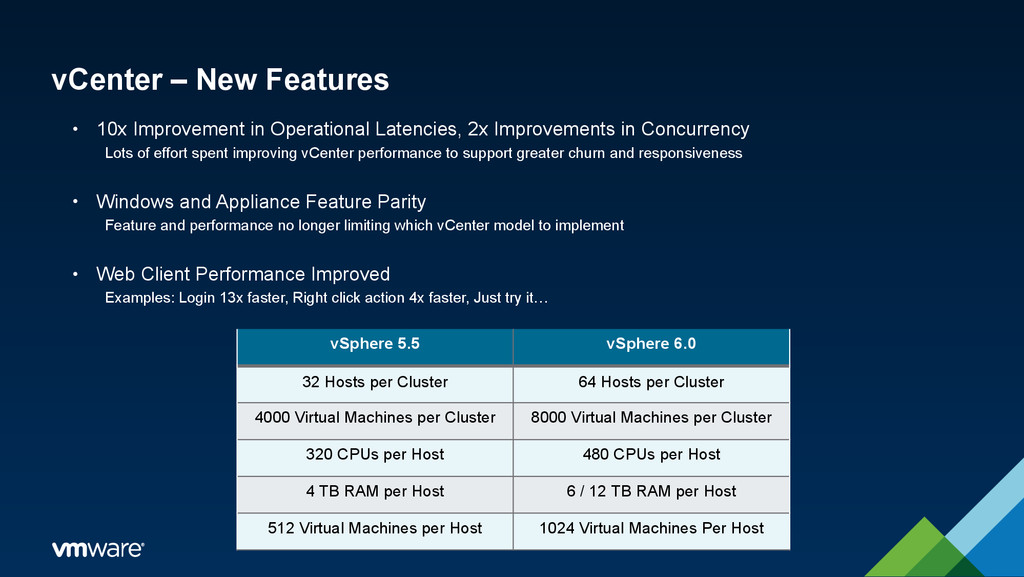
2x Improvements in Concurrency Lots of effort spent improving vCenter performance to support greater churn and responsiveness • Windows and Appliance Feature Parity Feature and performance no longer limiting which vCenter model to implement • Web Client Performance Improved Examples: Login 13x faster, Right click action 4x faster, Just try it… vSphere 5.5 vSphere 6.0 32 Hosts per Cluster 64 Hosts per Cluster 4000 Virtual Machines per Cluster 8000 Virtual Machines per Cluster 320 CPUs per Host 480 CPUs per Host 4 TB RAM per Host 6 / 12 TB RAM per Host 512 Virtual Machines per Host 1024 Virtual Machines Per Host
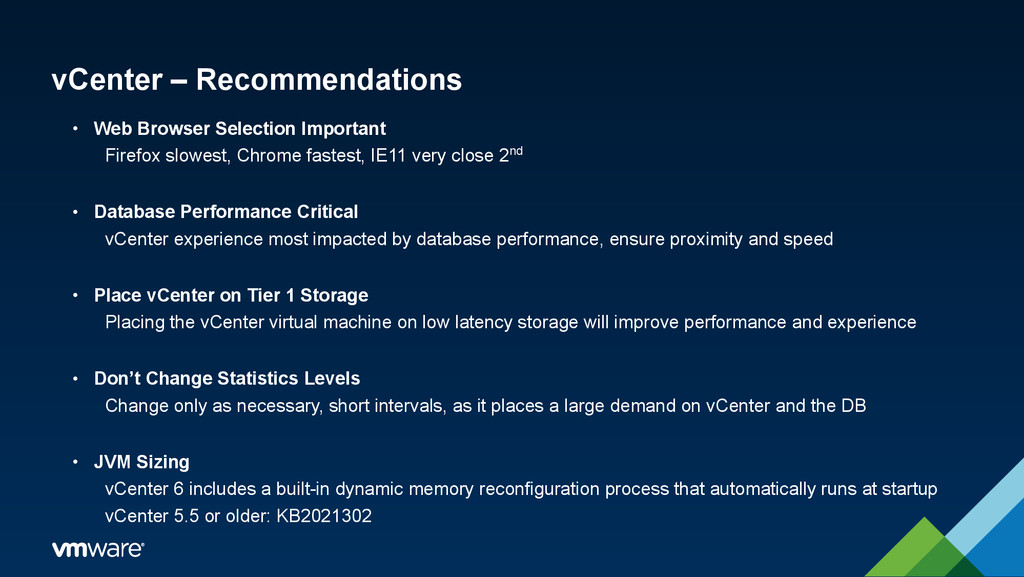
Chrome fastest, IE11 very close 2nd • Database Performance Critical vCenter experience most impacted by database performance, ensure proximity and speed • Place vCenter on Tier 1 Storage Placing the vCenter virtual machine on low latency storage will improve performance and experience • Don’t Change Statistics Levels Change only as necessary, short intervals, as it places a large demand on vCenter and the DB • JVM Sizing vCenter 6 includes a built-in dynamic memory reconfiguration process that automatically runs at startup vCenter 5.5 or older: KB2021302
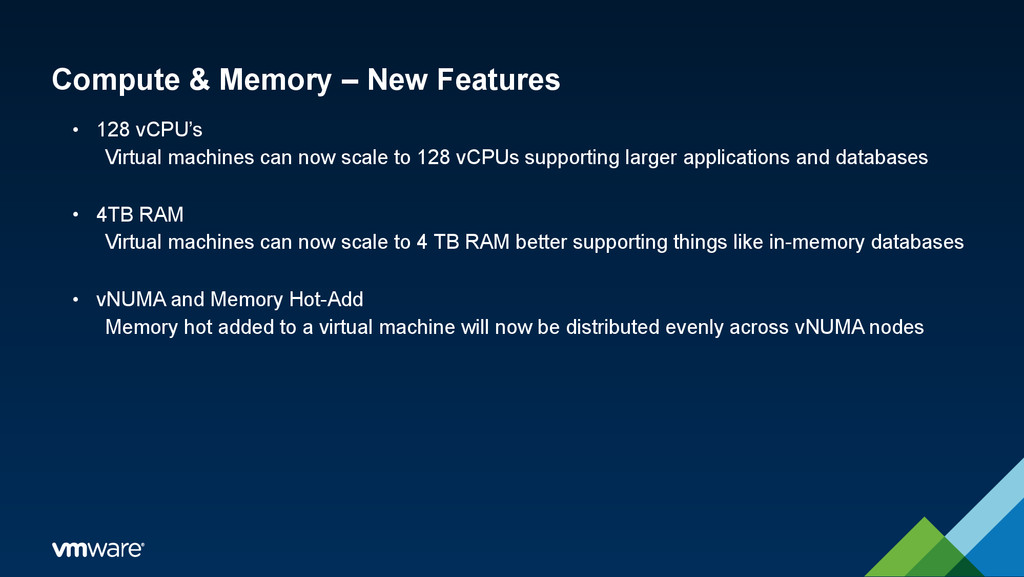
machines can now scale to 128 vCPUs supporting larger applications and databases • 4TB RAM Virtual machines can now scale to 4 TB RAM better supporting things like in-memory databases • vNUMA and Memory Hot-Add Memory hot added to a virtual machine will now be distributed evenly across vNUMA nodes
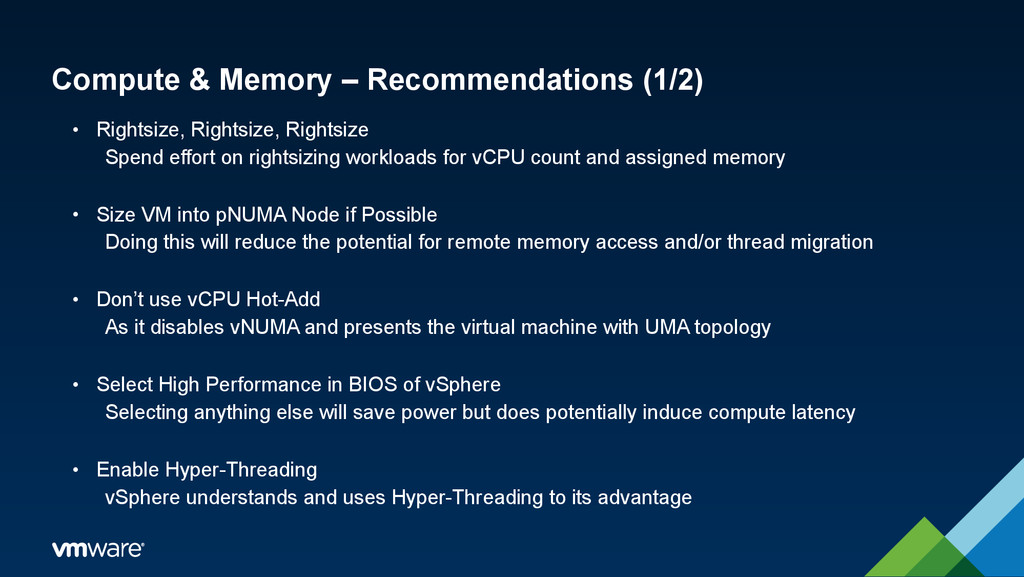
Spend effort on rightsizing workloads for vCPU count and assigned memory • Size VM into pNUMA Node if Possible Doing this will reduce the potential for remote memory access and/or thread migration • Don’t use vCPU Hot-Add As it disables vNUMA and presents the virtual machine with UMA topology • Select High Performance in BIOS of vSphere Selecting anything else will save power but does potentially induce compute latency • Enable Hyper-Threading vSphere understands and uses Hyper-Threading to its advantage
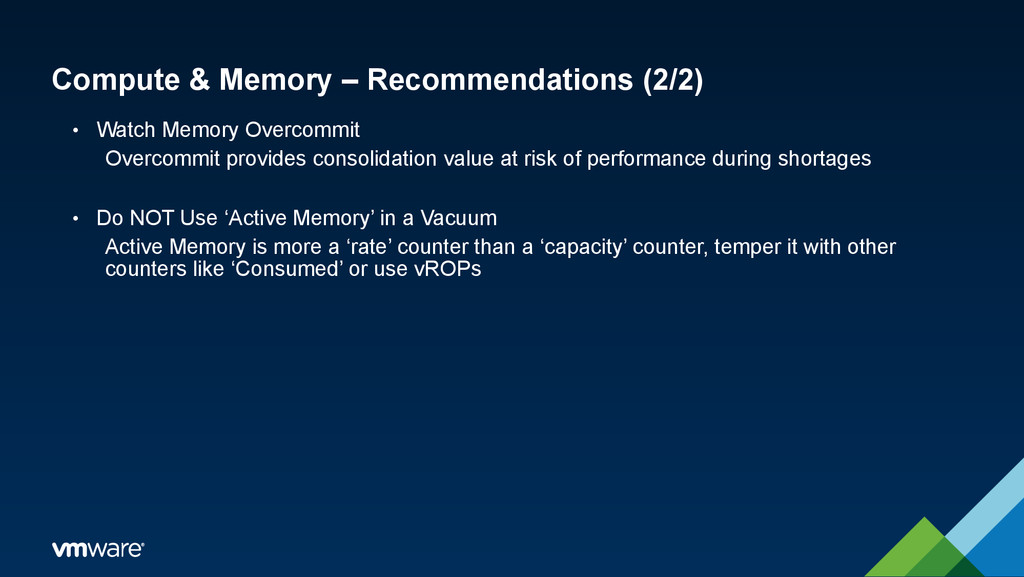
Overcommit provides consolidation value at risk of performance during shortages • Do NOT Use ‘Active Memory’ in a Vacuum Active Memory is more a ‘rate’ counter than a ‘capacity’ counter, temper it with other counters like ‘Consumed’ or use vROPs
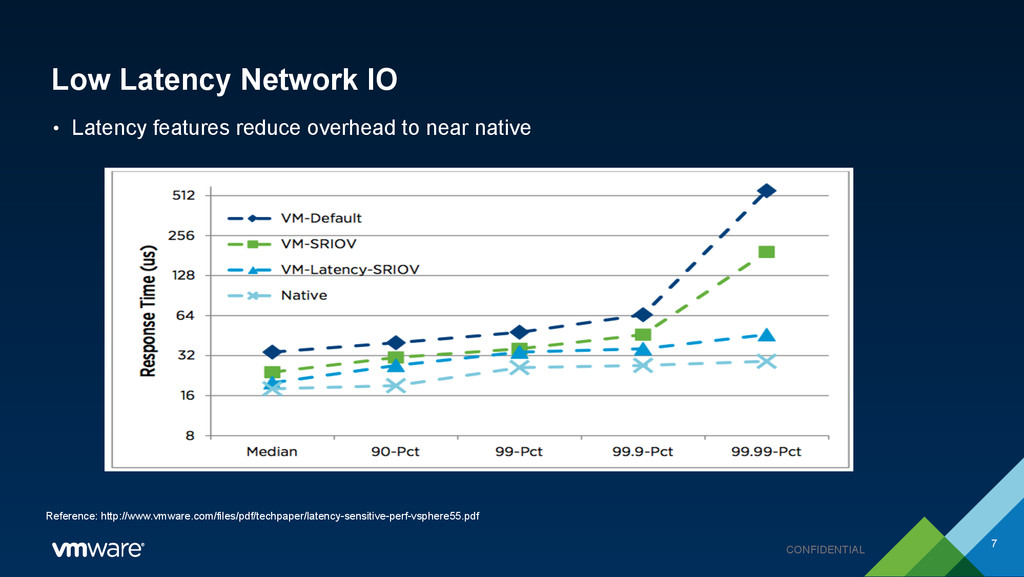
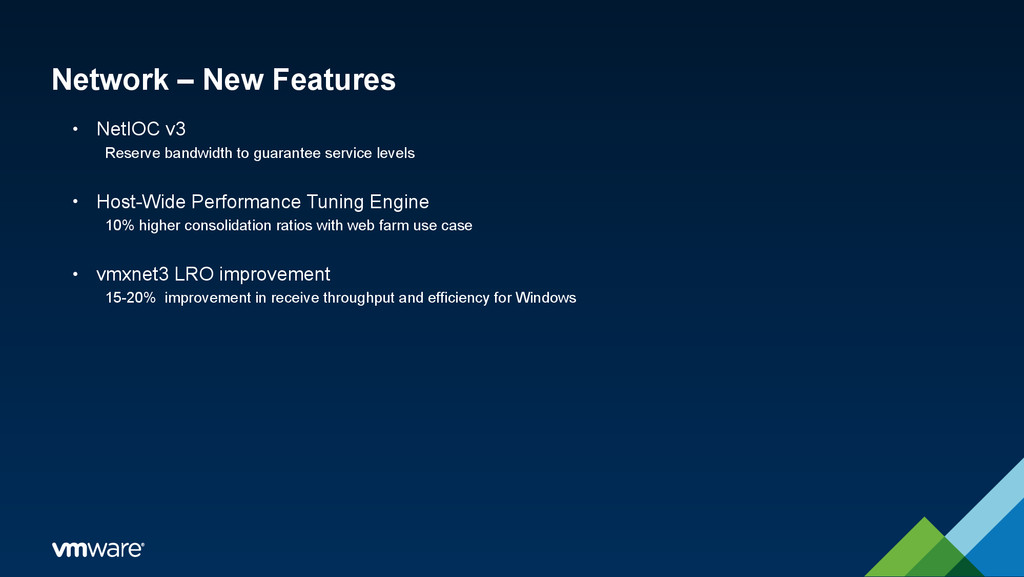
guarantee service levels • Host-Wide Performance Tuning Engine 10% higher consolidation ratios with web farm use case • vmxnet3 LRO improvement 15-20% improvement in receive throughput and efficiency for Windows
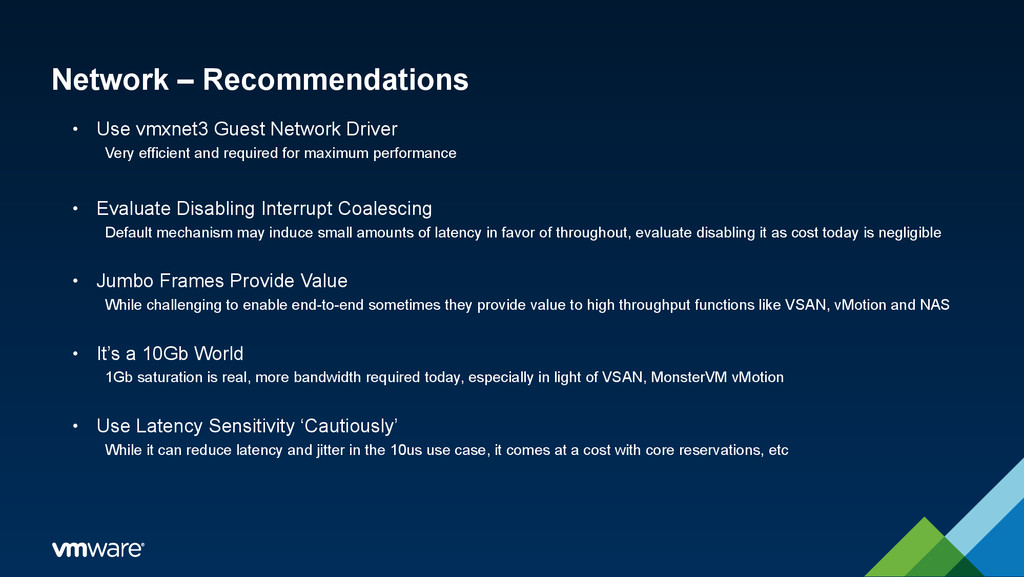
efficient and required for maximum performance • Evaluate Disabling Interrupt Coalescing Default mechanism may induce small amounts of latency in favor of throughout, evaluate disabling it as cost today is negligible • Jumbo Frames Provide Value While challenging to enable end-to-end sometimes they provide value to high throughput functions like VSAN, vMotion and NAS • It’s a 10Gb World 1Gb saturation is real, more bandwidth required today, especially in light of VSAN, MonsterVM vMotion • Use Latency Sensitivity ‘Cautiously’ While it can reduce latency and jitter in the 10us use case, it comes at a cost with core reservations, etc
of Latency-Sensitive Workloads http://www.vmware.com/resources/techresources/10220 • Leveraging NIC Technology to Improve Performance https://www.vmware.com/resources/techresources/10450
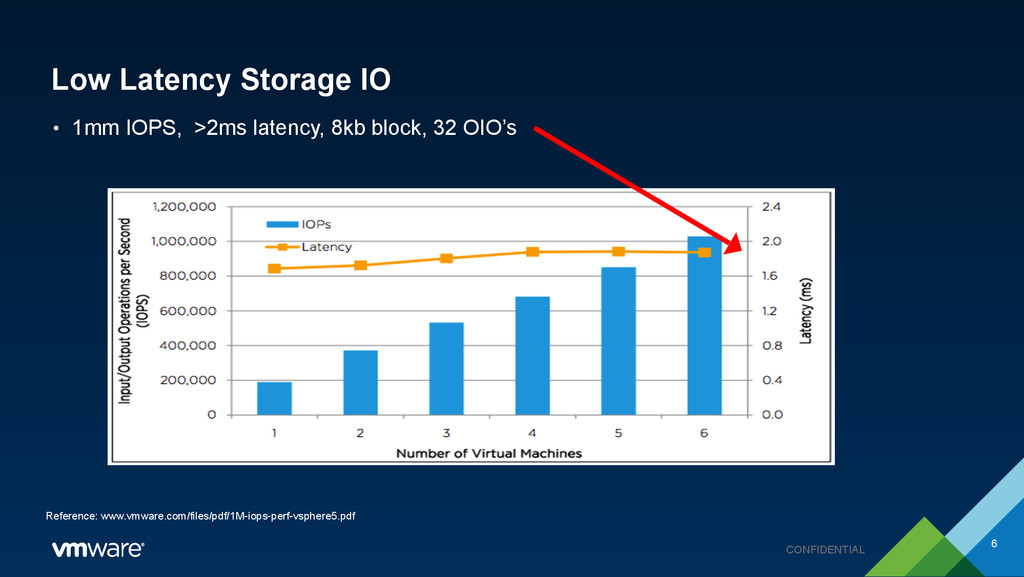
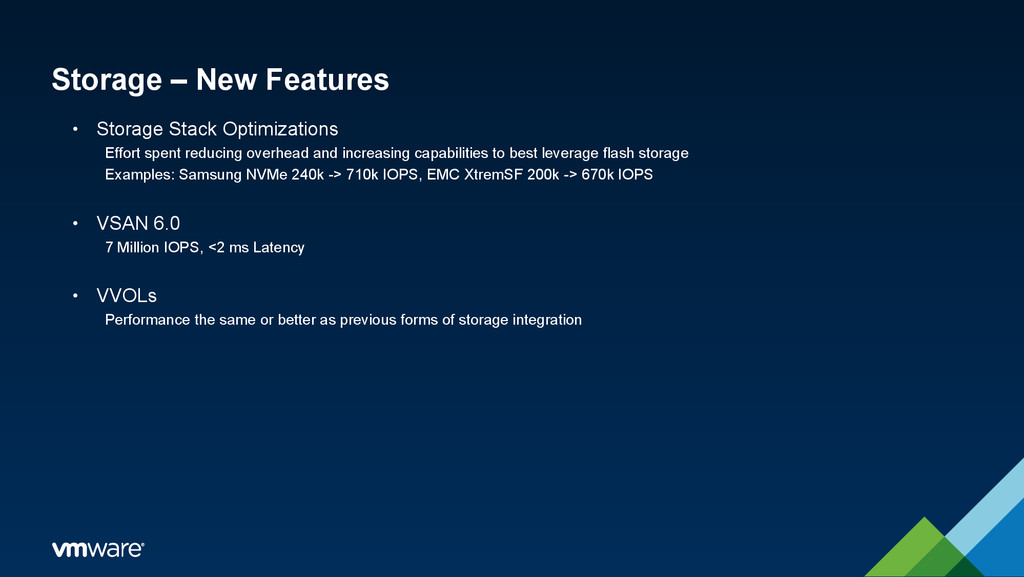
reducing overhead and increasing capabilities to best leverage flash storage Examples: Samsung NVMe 240k -> 710k IOPS, EMC XtremSF 200k -> 670k IOPS • VSAN 6.0 7 Million IOPS, <2 ms Latency • VVOLs Performance the same or better as previous forms of storage integration
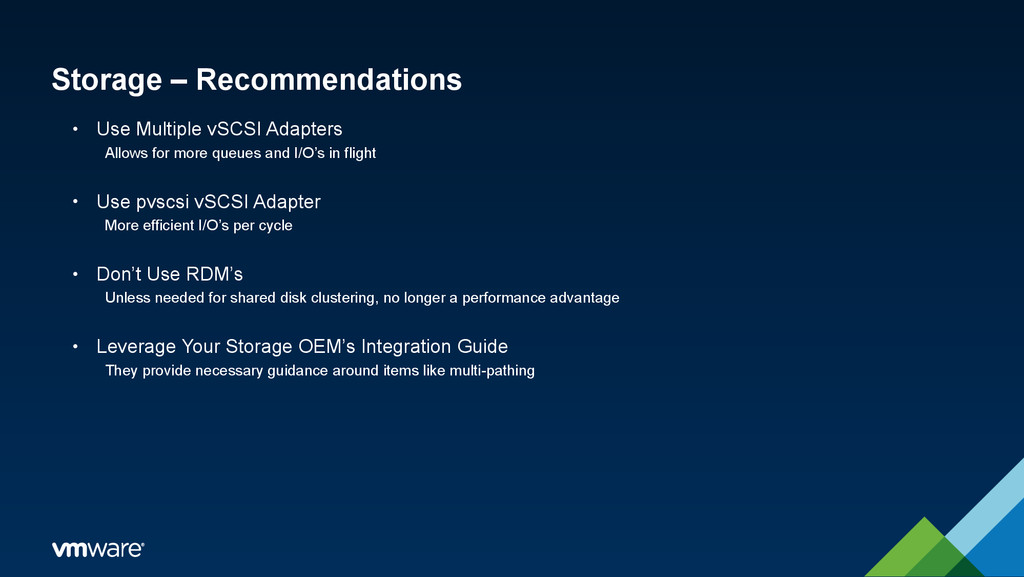
more queues and I/O’s in flight • Use pvscsi vSCSI Adapter More efficient I/O’s per cycle • Don’t Use RDM’s Unless needed for shared disk clustering, no longer a performance advantage • Leverage Your Storage OEM’s Integration Guide They provide necessary guidance around items like multi-pathing
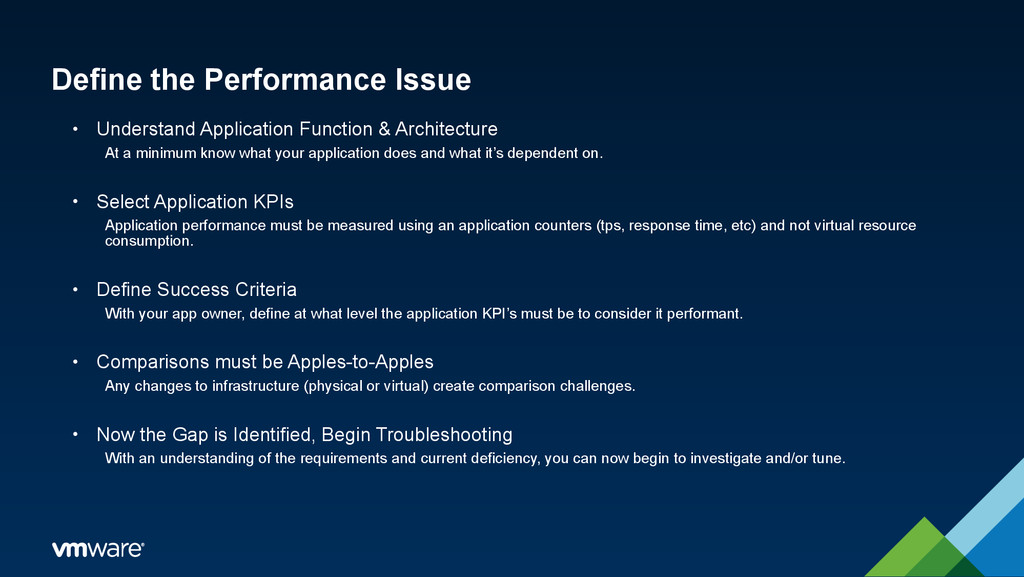
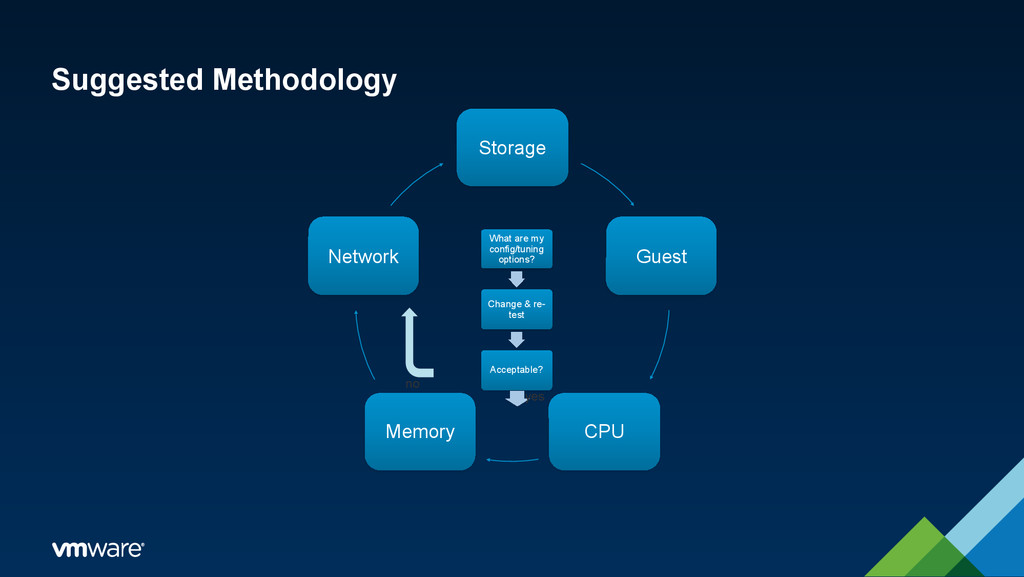
At a minimum know what your application does and what it’s dependent on. • Select Application KPIs Application performance must be measured using an application counters (tps, response time, etc) and not virtual resource consumption. • Define Success Criteria With your app owner, define at what level the application KPI’s must be to consider it performant. • Comparisons must be Apples-to-Apples Any changes to infrastructure (physical or virtual) create comparison challenges. • Now the Gap is Identified, Begin Troubleshooting With an understanding of the requirements and current deficiency, you can now begin to investigate and/or tune.
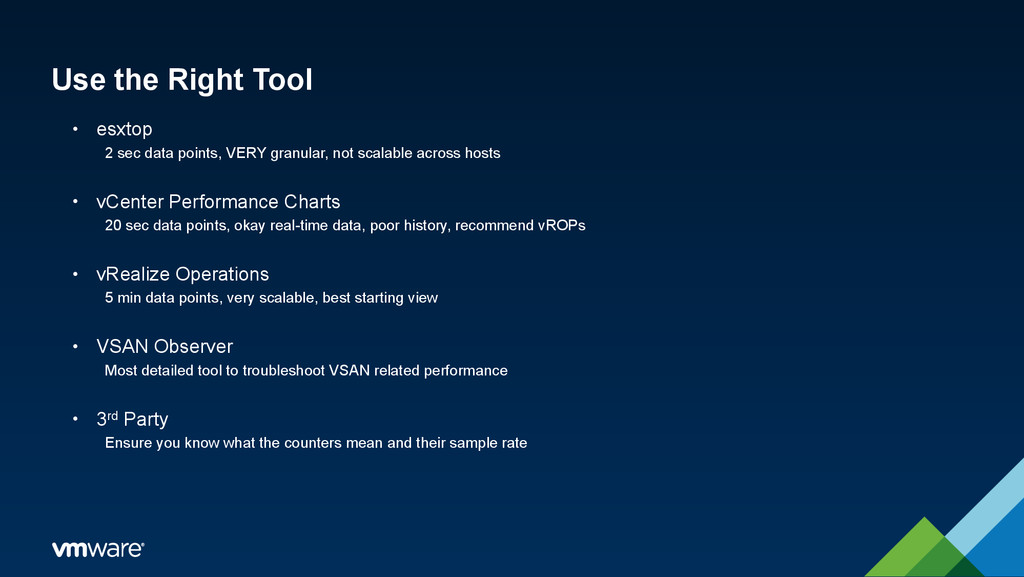
VERY granular, not scalable across hosts • vCenter Performance Charts 20 sec data points, okay real-time data, poor history, recommend vROPs • vRealize Operations 5 min data points, very scalable, best starting view • VSAN Observer Most detailed tool to troubleshoot VSAN related performance • 3rd Party Ensure you know what the counters mean and their sample rate
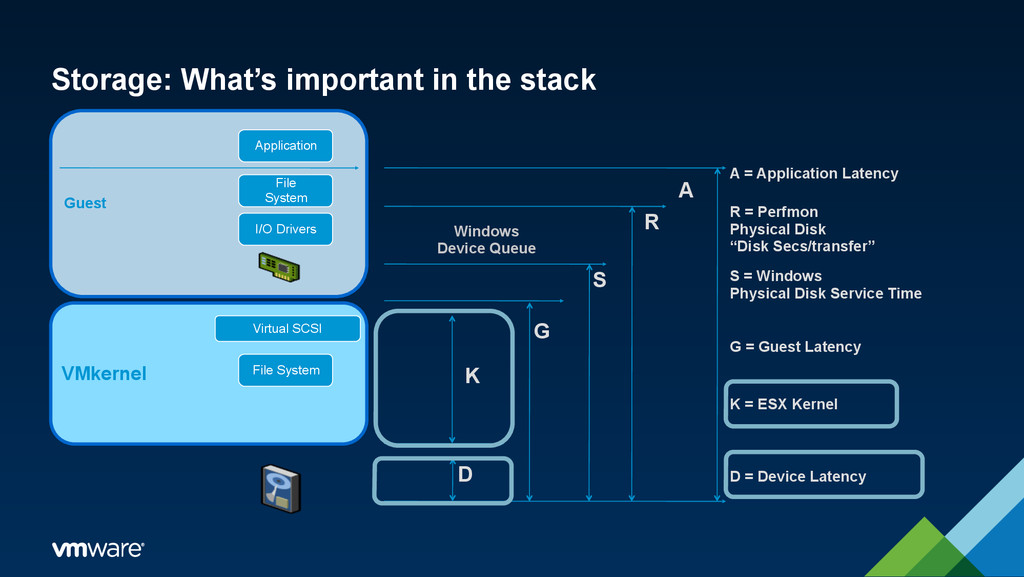
File System Virtual SCSI File System Application K D G Windows Device Queue R = Perfmon Physical Disk “Disk Secs/transfer” R A K = ESX Kernel G = Guest Latency A = Application Latency D = Device Latency S S = Windows Physical Disk Service Time
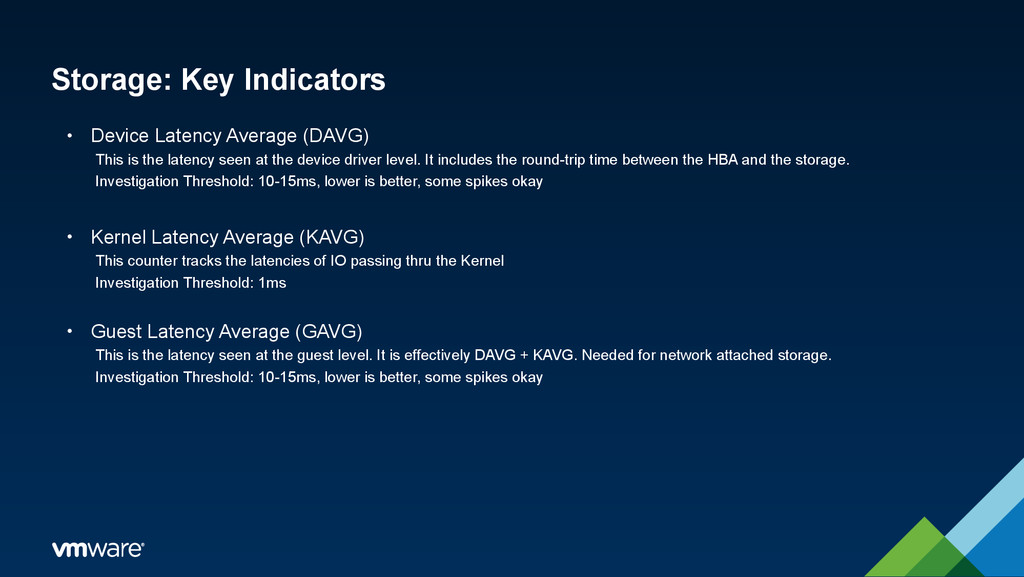
the latency seen at the device driver level. It includes the round-trip time between the HBA and the storage. Investigation Threshold: 10-15ms, lower is better, some spikes okay • Kernel Latency Average (KAVG) This counter tracks the latencies of IO passing thru the Kernel Investigation Threshold: 1ms • Guest Latency Average (GAVG) This is the latency seen at the guest level. It is effectively DAVG + KAVG. Needed for network attached storage. Investigation Threshold: 10-15ms, lower is better, some spikes okay
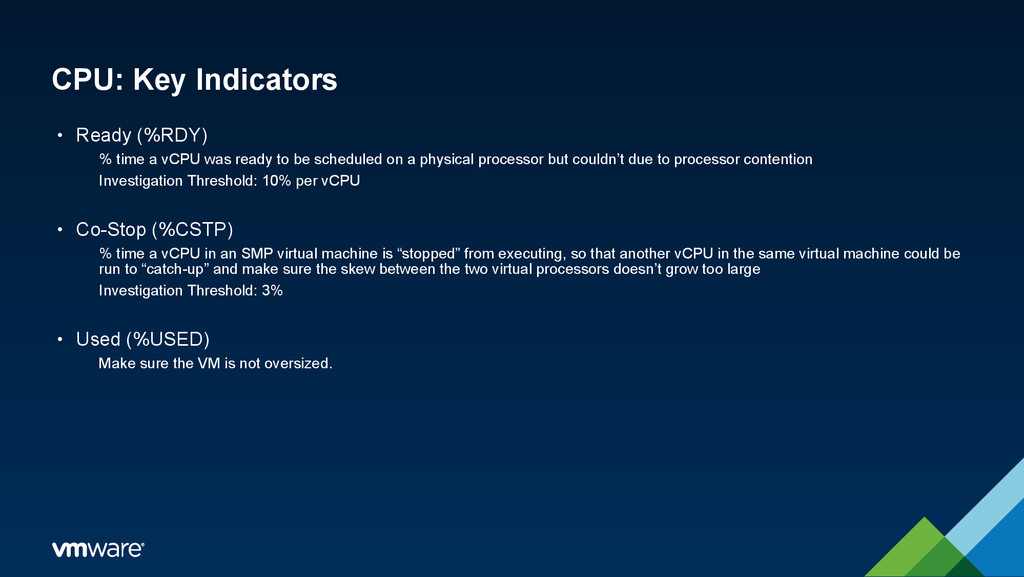
was ready to be scheduled on a physical processor but couldn’t due to processor contention Investigation Threshold: 10% per vCPU • Co-Stop (%CSTP) % time a vCPU in an SMP virtual machine is “stopped” from executing, so that another vCPU in the same virtual machine could be run to “catch-up” and make sure the skew between the two virtual processors doesn’t grow too large Investigation Threshold: 3% • Used (%USED) Make sure the VM is not oversized.
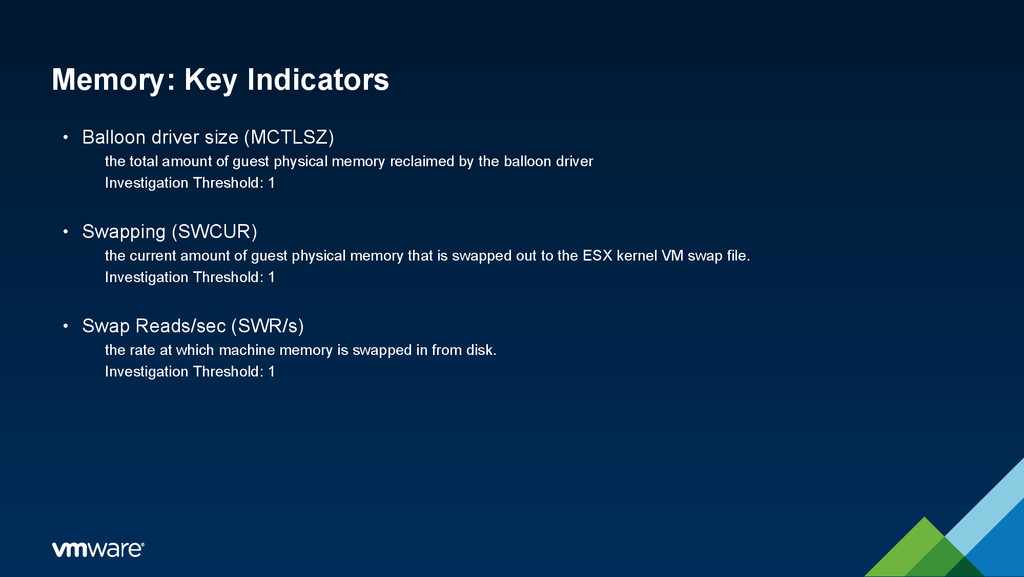
amount of guest physical memory reclaimed by the balloon driver Investigation Threshold: 1 • Swapping (SWCUR) the current amount of guest physical memory that is swapped out to the ESX kernel VM swap file. Investigation Threshold: 1 • Swap Reads/sec (SWR/s) the rate at which machine memory is swapped in from disk. Investigation Threshold: 1
Performance Blog http://blogs.vmware.com/vsphere/performance/ VMware’s Perf-Eng Blog (VROOM!) http://blogs.vmware.com/performance Performance Community Forum http://communities.vmware.com/community/vmtn/general/performance VMware Performance Links – Master List https://communities.vmware.com/docs/DOC-25253 Virtualizing Business Critical Applications http://www.vmware.com/solutions/business-critical-apps/ 33
by: Matt Liebowitz, Alexander Fontana vSphere High Performance Cookbook by: Prasenjit Sarkar Troubleshooting Storage Performance By: Mike Preston VMware vSphere Performance: Designing CPU, Memory, Storage, and Networking for Performance- Intensive Workloads By: Matt Liebowitz, Christopher Kusek, Rynardt Spies Virtualizing SQL Server with VMware: Doing IT Right By: Jeff Szastak, Michael Corey, Michael Webster Virtualizing Oracle Databases on vSphere By: Don Sullivan, Kannan Mani VMware vRealize Operations Performance and Capacity Management By: Ewan ‘e1’ Rahabok 35
This has always been one of the most popular labs and has content for both the beginner and the advanced vSphere Administrator. You can learn more about the basics of vSphere Performance or delve into esxtop, or vNUMA. http://labs.hol.vmware.com/HOL/#lab/1474 36