PSO Senior Consultant • Blog: www.nickmarshall.com.au • Twitter: @nickmarshall9 § Michael Webster • VMware COE Strategic Architect • Blog: www.longwhiteclouds.com • Twitter: @vcdxnz001 Book giveaway at the end of the session!
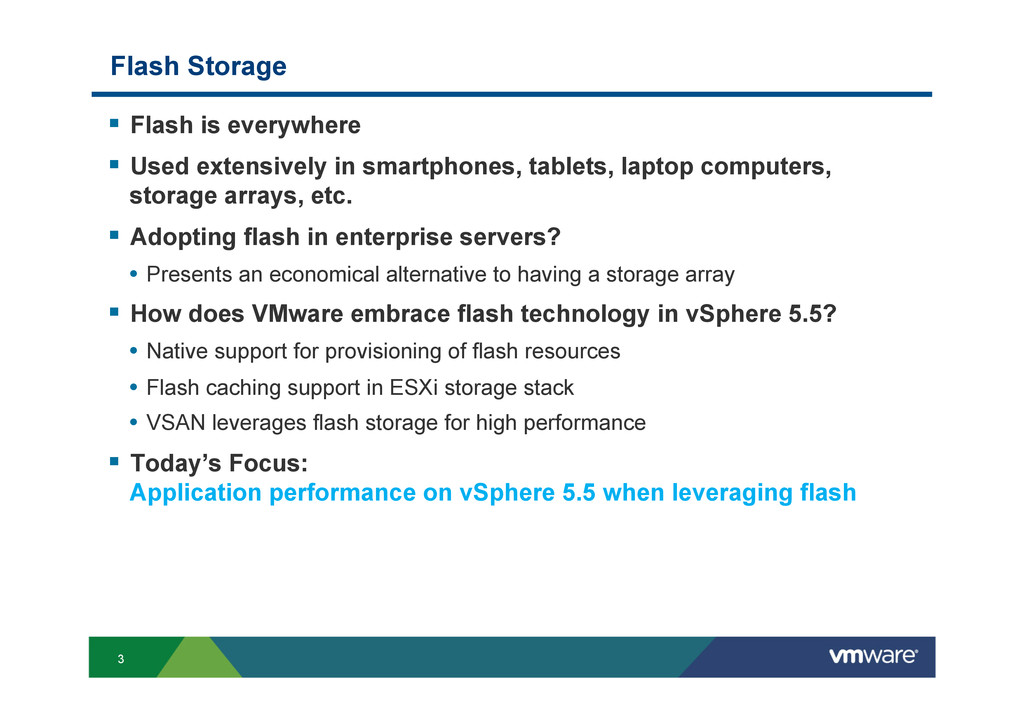
in smartphones, tablets, laptop computers, storage arrays, etc. § Adopting flash in enterprise servers? • Presents an economical alternative to having a storage array § How does VMware embrace flash technology in vSphere 5.5? • Native support for provisioning of flash resources • Flash caching support in ESXi storage stack • VSAN leverages flash storage for high performance § Today’s Focus: Application performance on vSphere 5.5 when leveraging flash
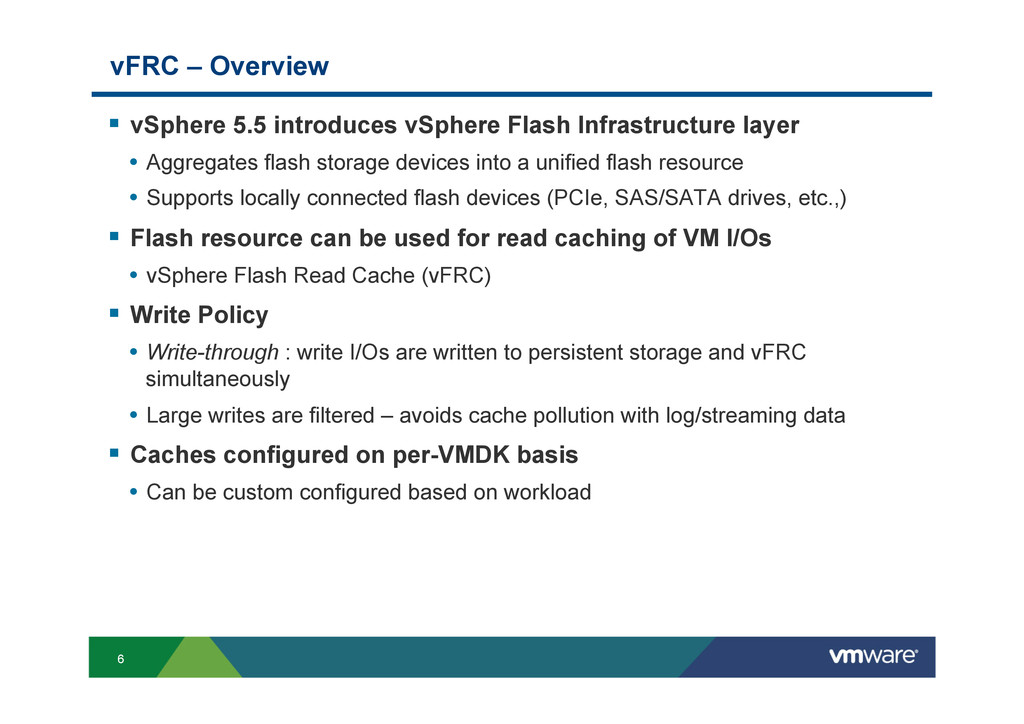
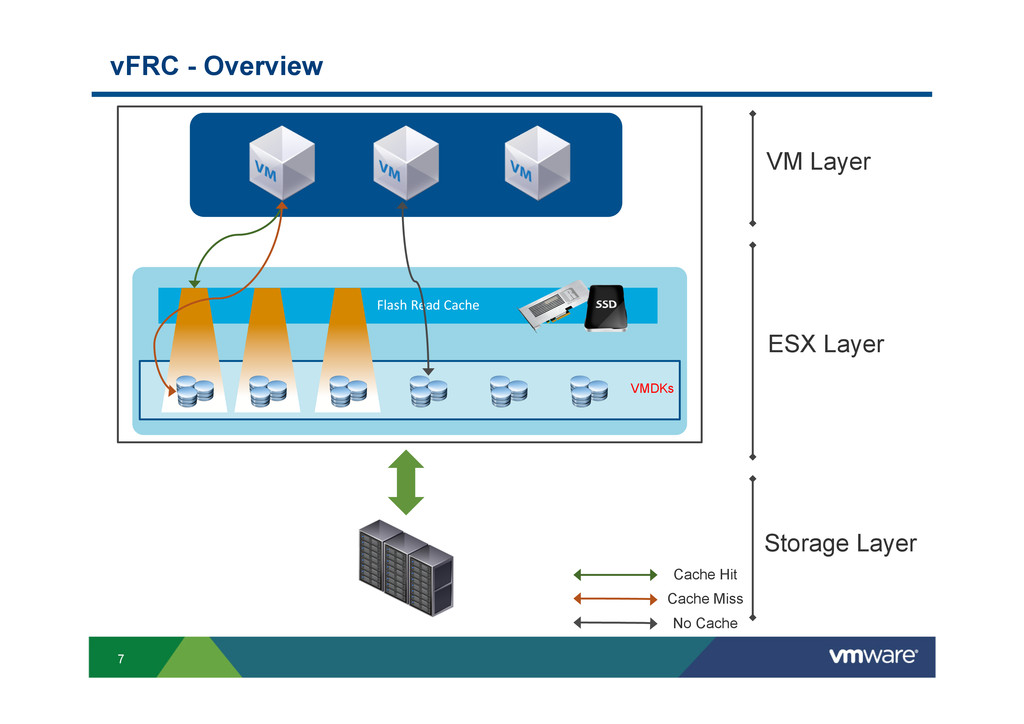
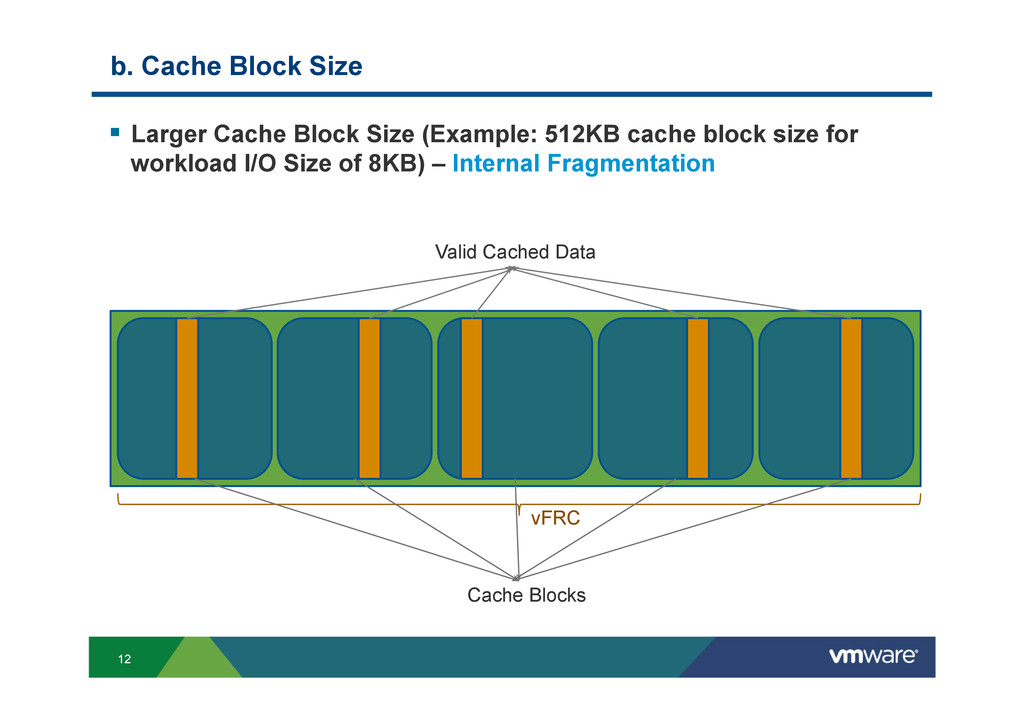
Infrastructure layer • Aggregates flash storage devices into a unified flash resource • Supports locally connected flash devices (PCIe, SAS/SATA drives, etc.,) § Flash resource can be used for read caching of VM I/Os • vSphere Flash Read Cache (vFRC) § Write Policy • Write-through : write I/Os are written to persistent storage and vFRC simultaneously • Large writes are filtered – avoids cache pollution with log/streaming data § Caches configured on per-VMDK basis • Can be custom configured based on workload
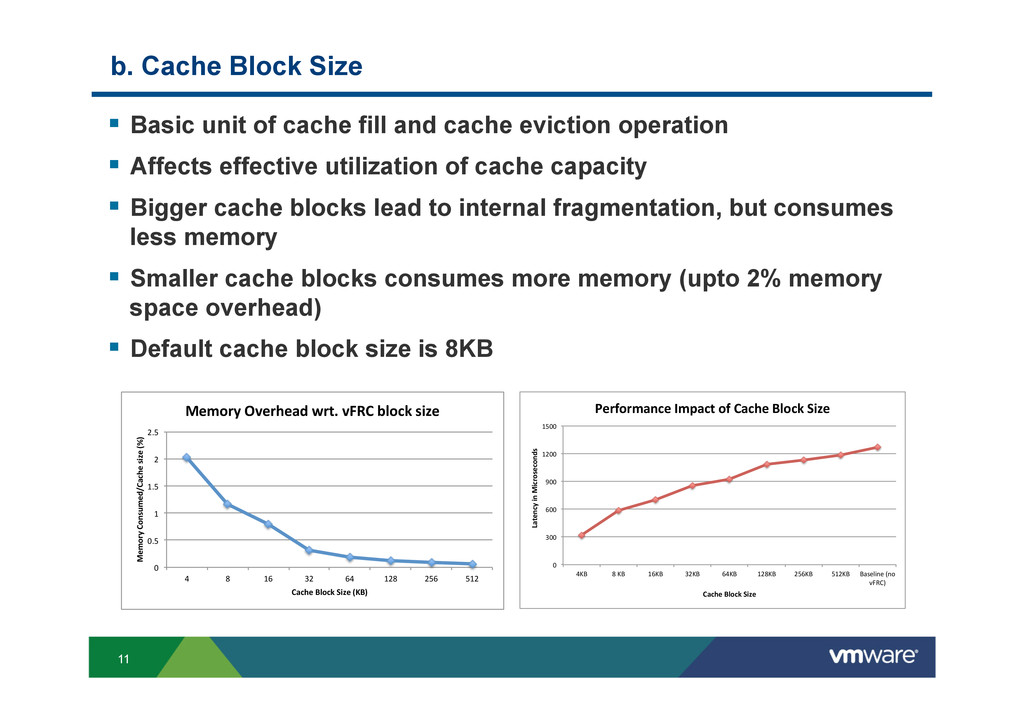
from vFRC ? • Read-dominated I/O pattern • High repeated access of data (E.g. 20% of working set accessed 80% of time) • Sufficient flash capacity to hold data that is accessed repeatedly § What impacts vFRC performance ? • Cache Size – should be big enough to hold active working set of workload • Cache Block Size – should match the dominant I/O size of workload • Flash Device Types – PCIe flash cards vs. SSD drives
when enabling vFRC for a VMDK • Depends on working set of the application • Should be sized to hold active working set § Inadequate cache sizes lead to increased cache miss rate § Over-sized cache leads to wastage of flash resources and sub- optimal performance during vMotion • By default cache is migrated during vMotion • Over-sized cache increases vMotion time § How to determine the right working set size? • vscsiStats workload tracing § Cache size can be modified at run-time if necessary
from vFRC? • Read-dominated I/O pattern • High repeated access of data (E.g. 20% of working set accessed 80% of time) • Sufficient flash capacity to hold data that is accessed repeatedly § Applications Considered: • Data Warehousing (Swingbench DSS) • Database Transactions (DVDstore) • Real-World Enterprise Server Workloads (Publicly available I/O Traces)
§ Benchmark : Swingbench 2.4 using ‘Sales History’ Schema on Oracle 11g R2 database SWINGBENCH DSS BENCHMARK ON RHEL 6.4 VM QUERIES >> << RESULTS ORACLE 11G R2 ON WINDOWS 2008 SERVER VM vFRC EMC VNX 5700 1TB LUN, RAID5 OVER 5 FC 15k RPM HDDs
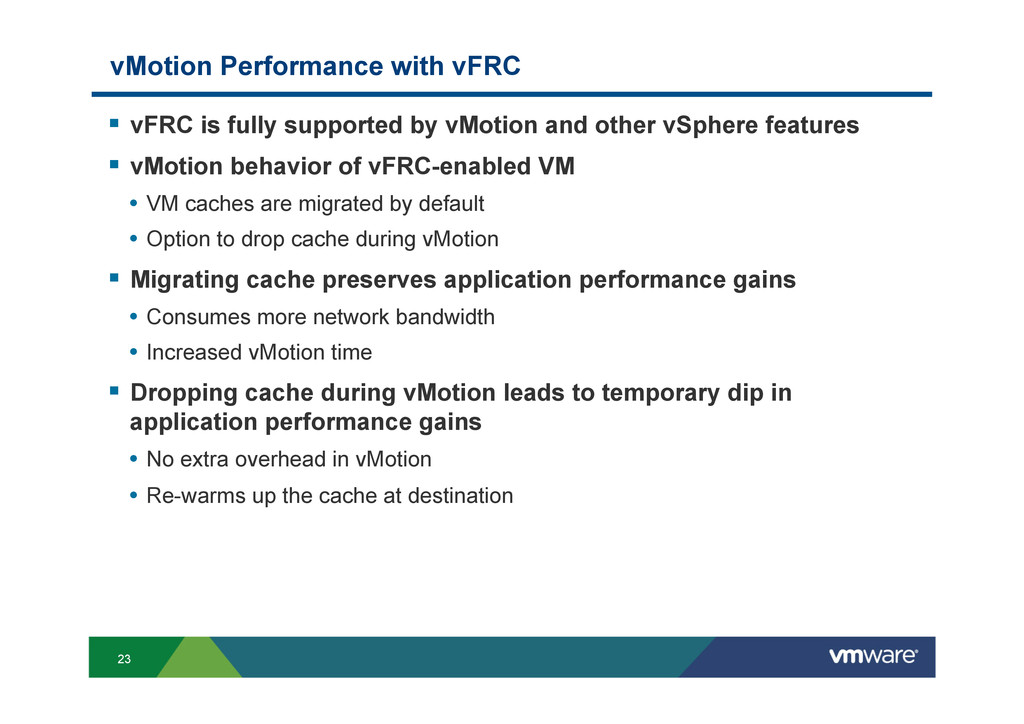
by vMotion and other vSphere features § vMotion behavior of vFRC-enabled VM • VM caches are migrated by default • Option to drop cache during vMotion § Migrating cache preserves application performance gains • Consumes more network bandwidth • Increased vMotion time § Dropping cache during vMotion leads to temporary dip in application performance gains • No extra overhead in vMotion • Re-warms up the cache at destination
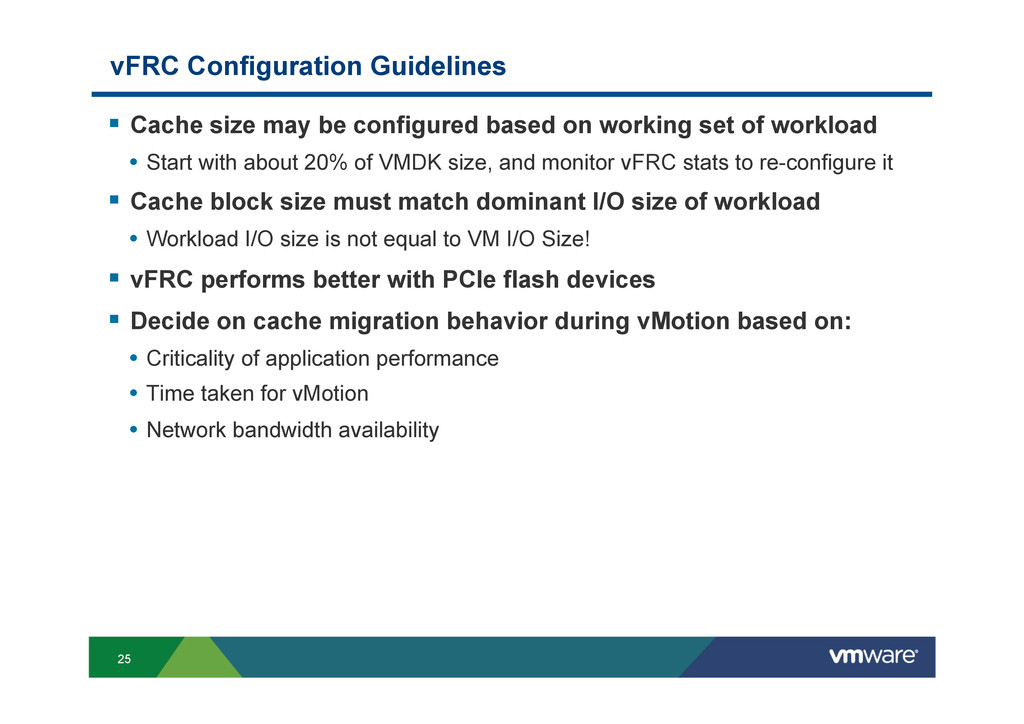
based on working set of workload • Start with about 20% of VMDK size, and monitor vFRC stats to re-configure it § Cache block size must match dominant I/O size of workload • Workload I/O size is not equal to VM I/O Size! § vFRC performs better with PCIe flash devices § Decide on cache migration behavior during vMotion based on: • Criticality of application performance • Time taken for vMotion • Network bandwidth availability
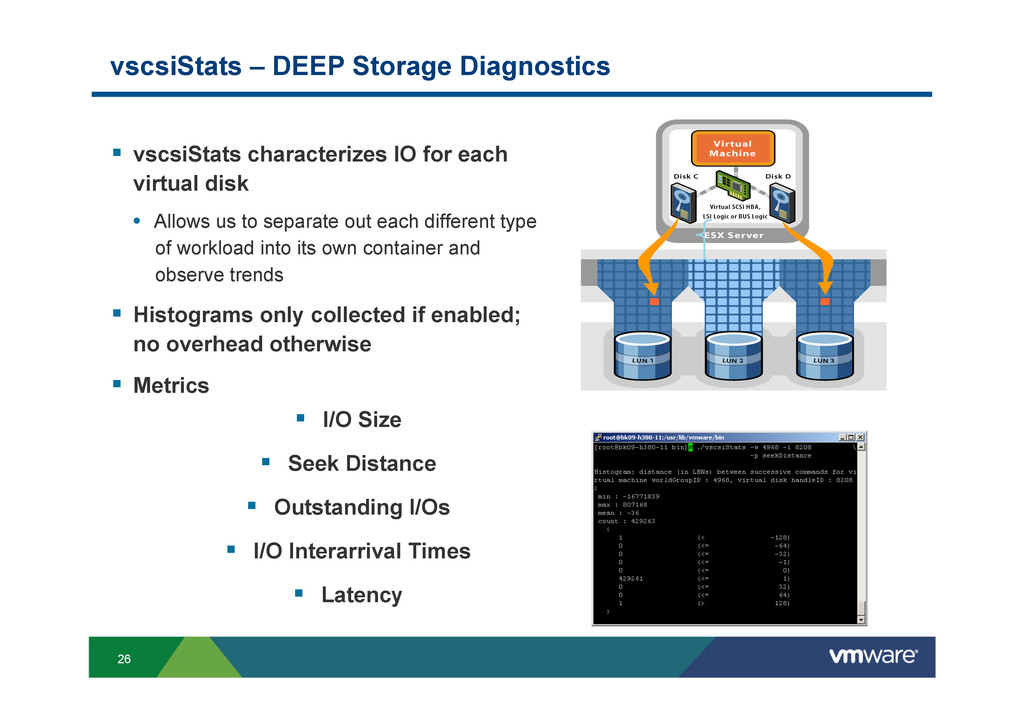
for each virtual disk • Allows us to separate out each different type of workload into its own container and observe trends § Histograms only collected if enabled; no overhead otherwise § Metrics § I/O Size § Seek Distance § Outstanding I/Os § I/O Interarrival Times § Latency
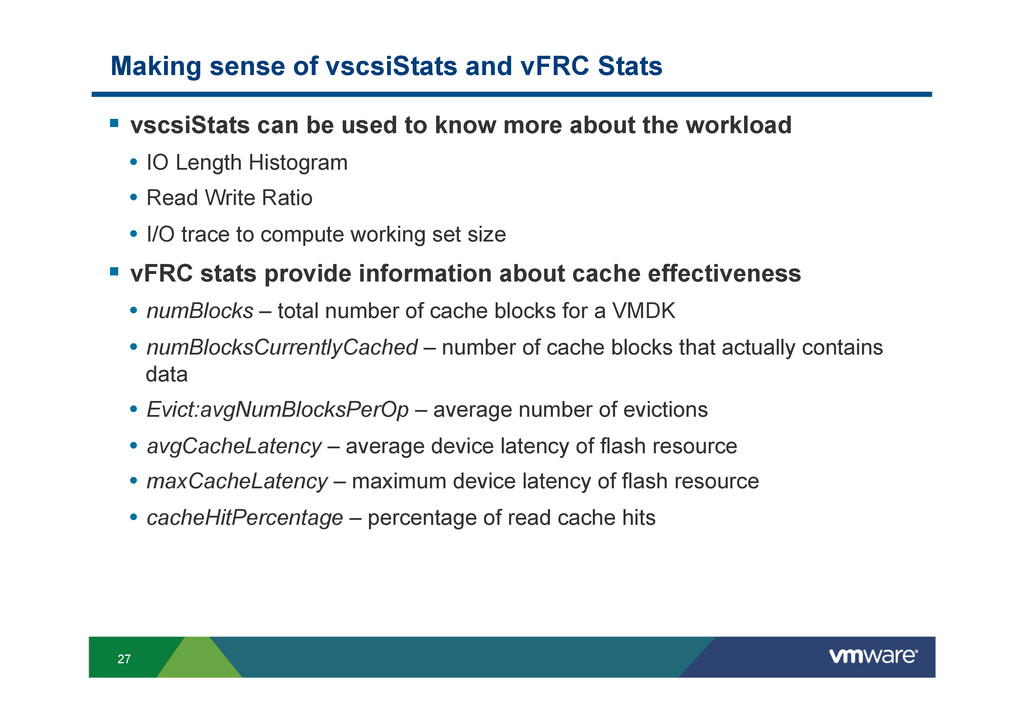
can be used to know more about the workload • IO Length Histogram • Read Write Ratio • I/O trace to compute working set size § vFRC stats provide information about cache effectiveness • numBlocks – total number of cache blocks for a VMDK • numBlocksCurrentlyCached – number of cache blocks that actually contains data • Evict:avgNumBlocksPerOp – average number of evictions • avgCacheLatency – average device latency of flash resource • maxCacheLatency – maximum device latency of flash resource • cacheHitPercentage – percentage of read cache hits
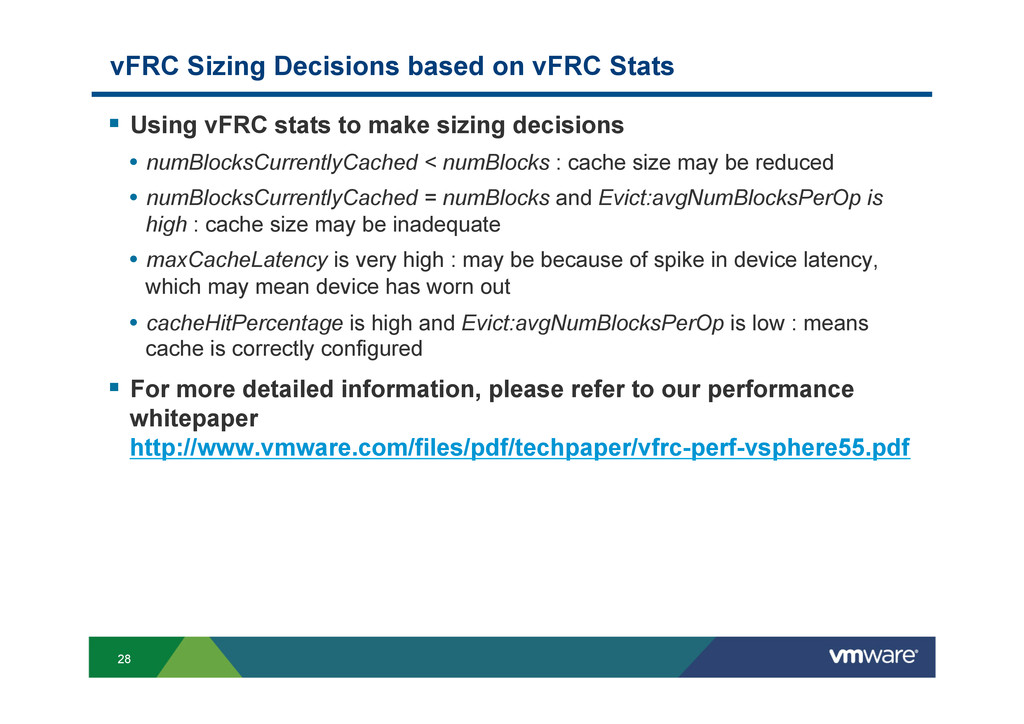
vFRC stats to make sizing decisions • numBlocksCurrentlyCached < numBlocks : cache size may be reduced • numBlocksCurrentlyCached = numBlocks and Evict:avgNumBlocksPerOp is high : cache size may be inadequate • maxCacheLatency is very high : may be because of spike in device latency, which may mean device has worn out • cacheHitPercentage is high and Evict:avgNumBlocksPerOp is low : means cache is correctly configured § For more detailed information, please refer to our performance whitepaper http://www.vmware.com/files/pdf/techpaper/vfrc-perf-vsphere55.pdf
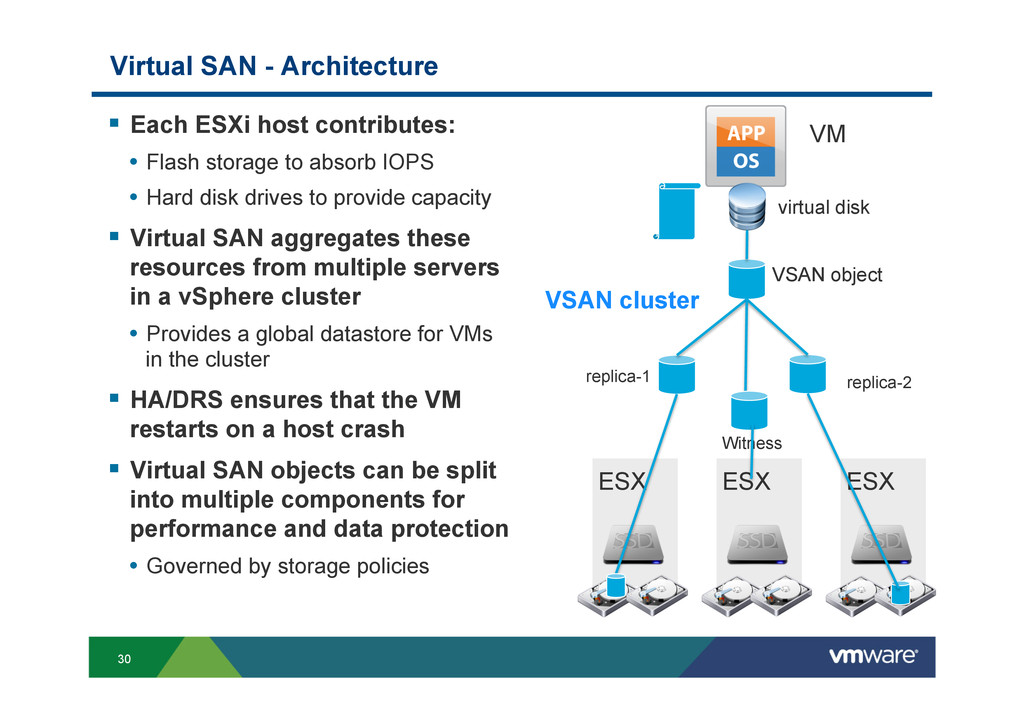
• Flash storage to absorb IOPS • Hard disk drives to provide capacity § Virtual SAN aggregates these resources from multiple servers in a vSphere cluster • Provides a global datastore for VMs in the cluster § HA/DRS ensures that the VM restarts on a host crash § Virtual SAN objects can be split into multiple components for performance and data protection • Governed by storage policies ESX VSAN cluster ESX ESX VM virtual disk VSAN object replica-1 replica-2 Witness
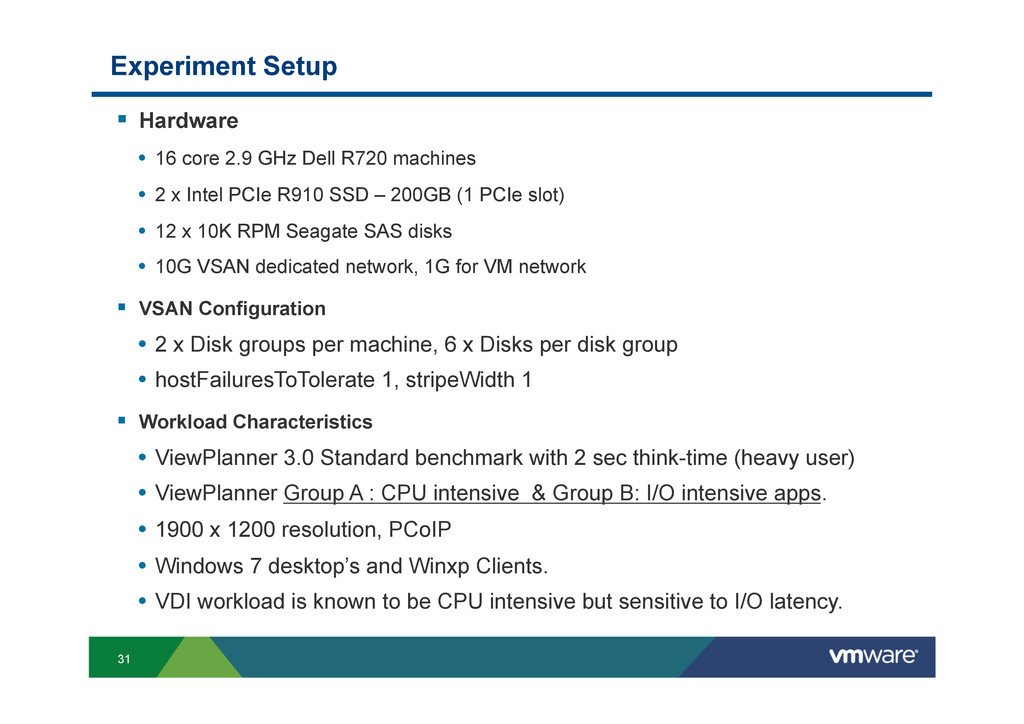
Dell R720 machines • 2 x Intel PCIe R910 SSD – 200GB (1 PCIe slot) • 12 x 10K RPM Seagate SAS disks • 10G VSAN dedicated network, 1G for VM network § VSAN Configuration • 2 x Disk groups per machine, 6 x Disks per disk group • hostFailuresToTolerate 1, stripeWidth 1 § Workload Characteristics • ViewPlanner 3.0 Standard benchmark with 2 sec think-time (heavy user) • ViewPlanner Group A : CPU intensive & Group B: I/O intensive apps. • 1900 x 1200 resolution, PCoIP • Windows 7 desktop’s and Winxp Clients. • VDI workload is known to be CPU intensive but sensitive to I/O latency.
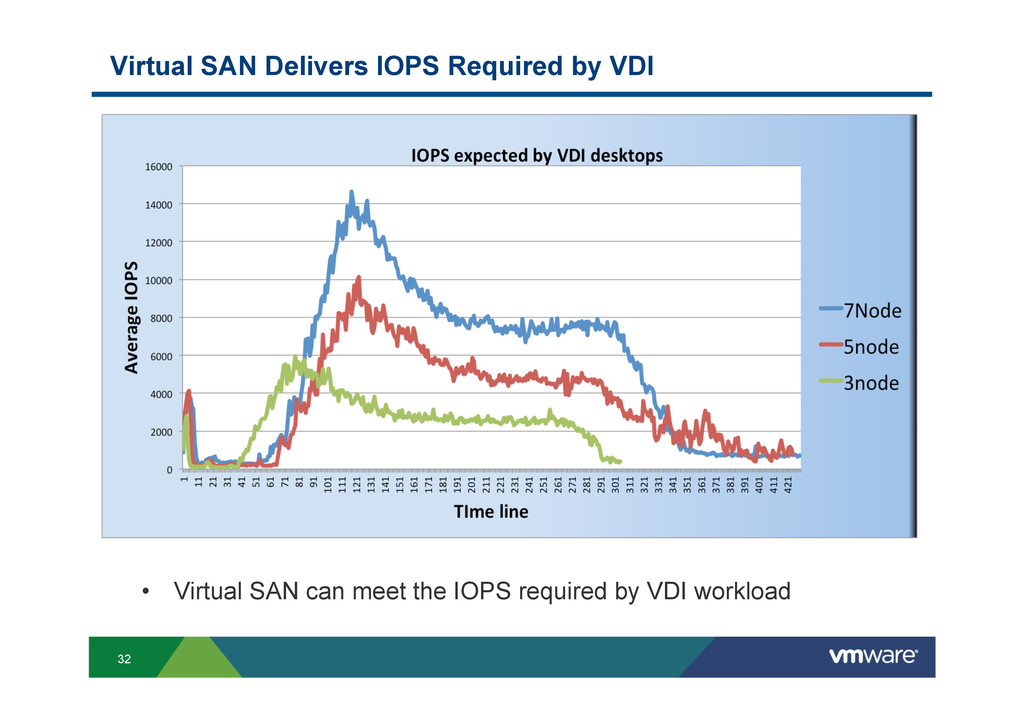
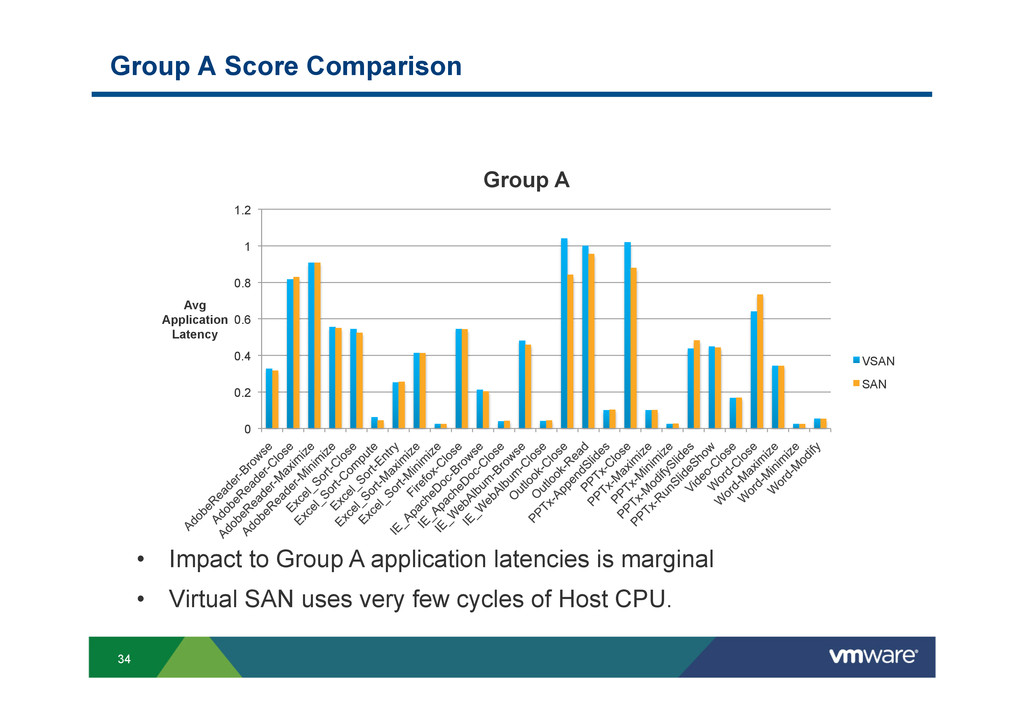
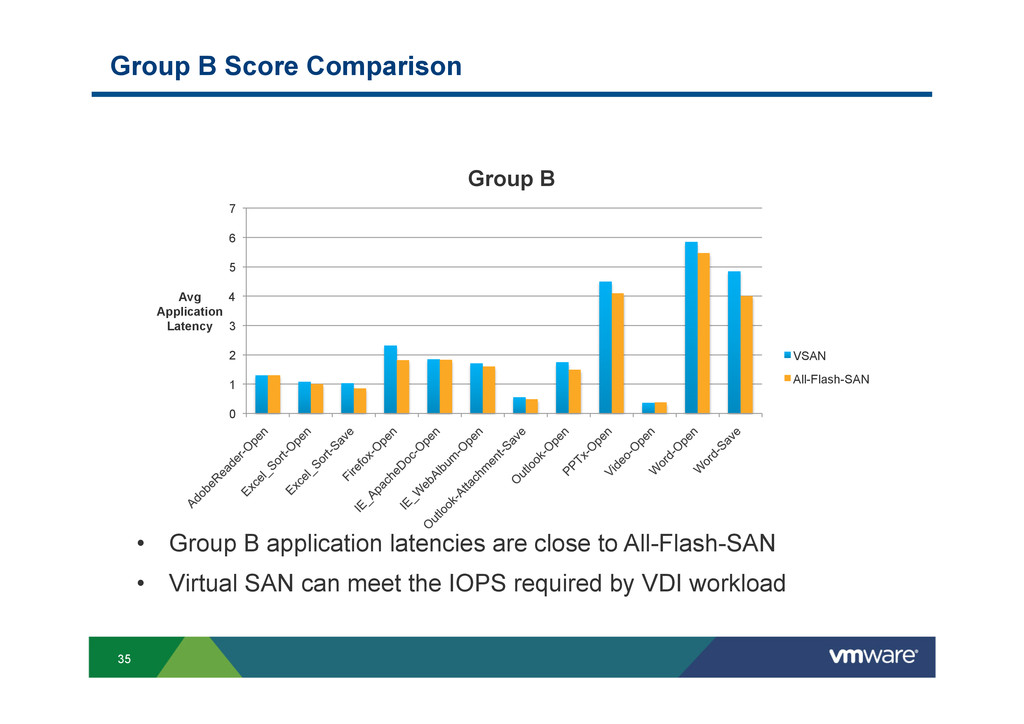
5 6 7 Avg Application Latency Group B VSAN All-Flash-SAN • Group B application latencies are close to All-Flash-SAN • Virtual SAN can meet the IOPS required by VDI workload
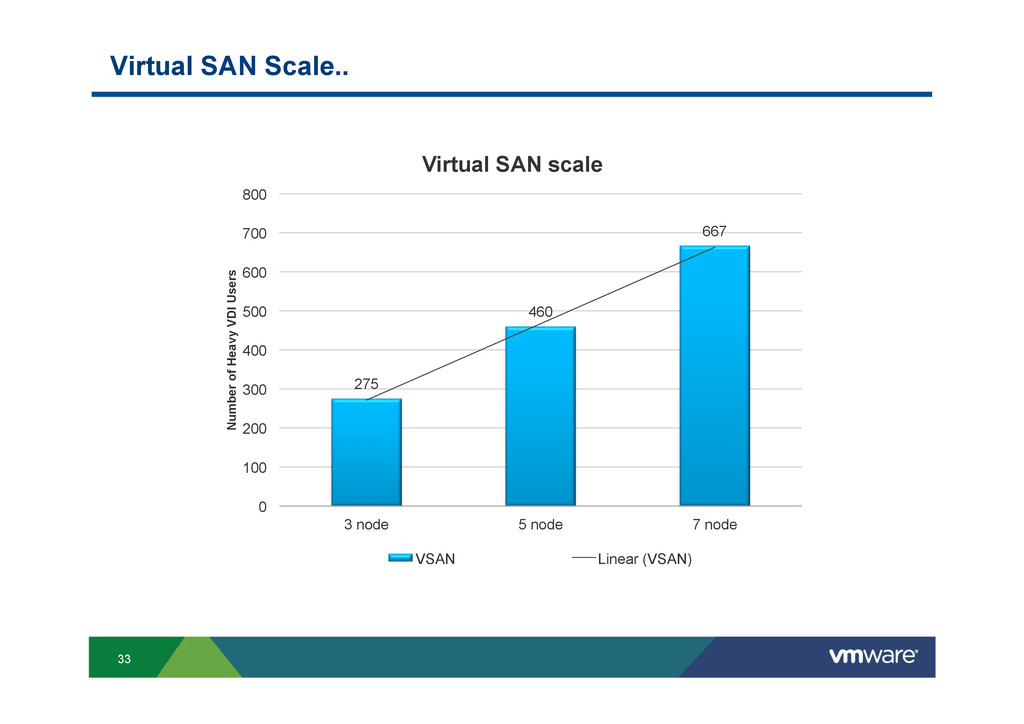
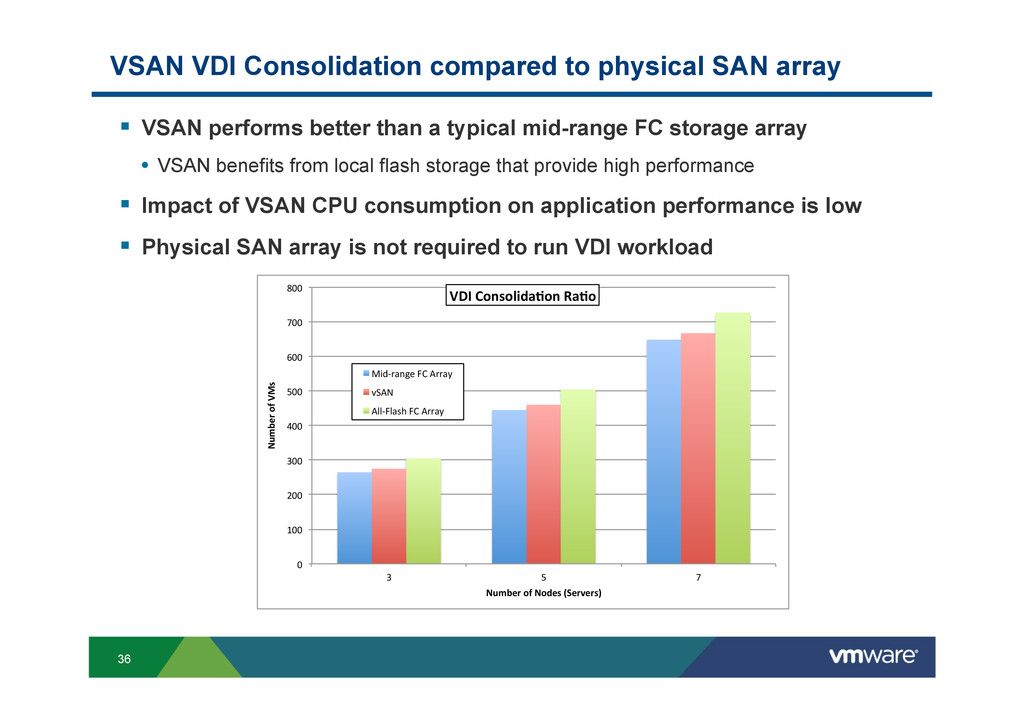
VSAN performs better than a typical mid-range FC storage array • VSAN benefits from local flash storage that provide high performance § Impact of VSAN CPU consumption on application performance is low § Physical SAN array is not required to run VDI workload 0" 100" 200" 300" 400" 500" 600" 700" 800" 3" 5" 7" Number'of'VMs'' Number'of'Nodes'(Servers)' VDI'Consolida9on'Ra9o' Mid.range"FC"Array" vSAN" All.Flash"FC"Array"
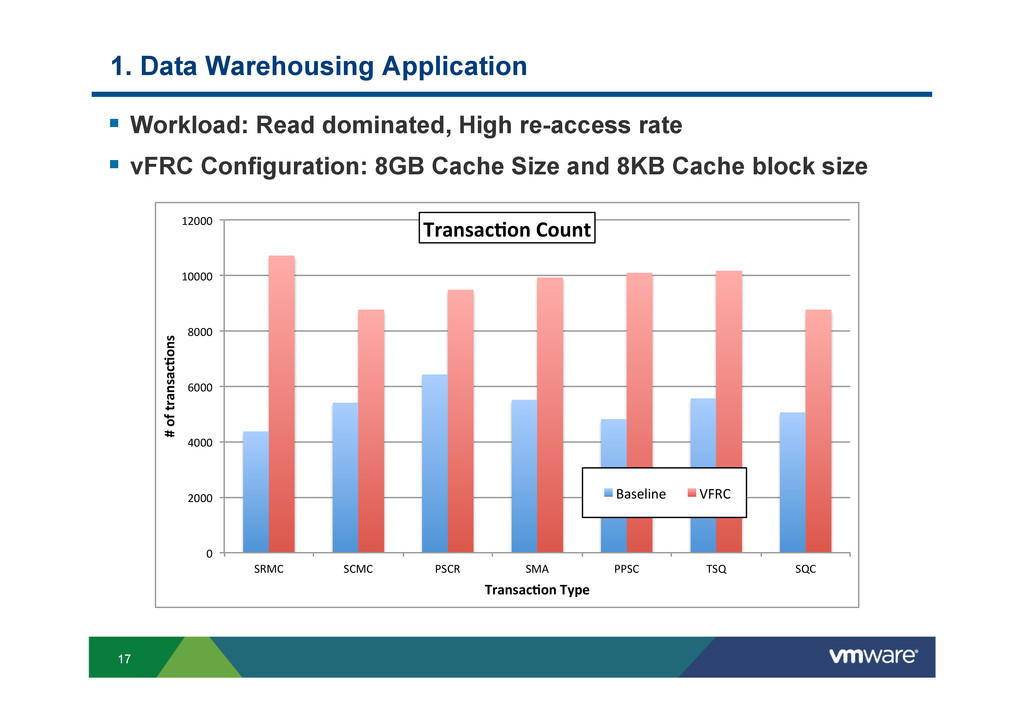
![16 1. Data Warehousing Application § Decision Support System [TPC-H]](https://files.speakerdeck.com/presentations/7dfac9101db5013192da22d9bc47210a/slide_15.jpg)