Upgrade to Pro — share decks privately, control downloads, hide ads and more …

Lessons Learned in Building an analytics stack

Nishant
April 06, 2016

Lessons Learned in Building an analytics stack

Nishant

April 06, 2016
Tweet

More Decks by Nishant

Other Decks in Technology

Transcript

  1. Lessons Learned The Hard Way : Building an Analytics Stack

    Nishant Druid Committer Software Engineer @ Metamarkets
  2. AGENDA ➡ Demo ➡ Motivations ➡ Technical Challenges ➡ Success

    and Failures ➡ Lessons Learned in the Journey
  3. Motivations • Interactive data warehouses • Answer BI questions •

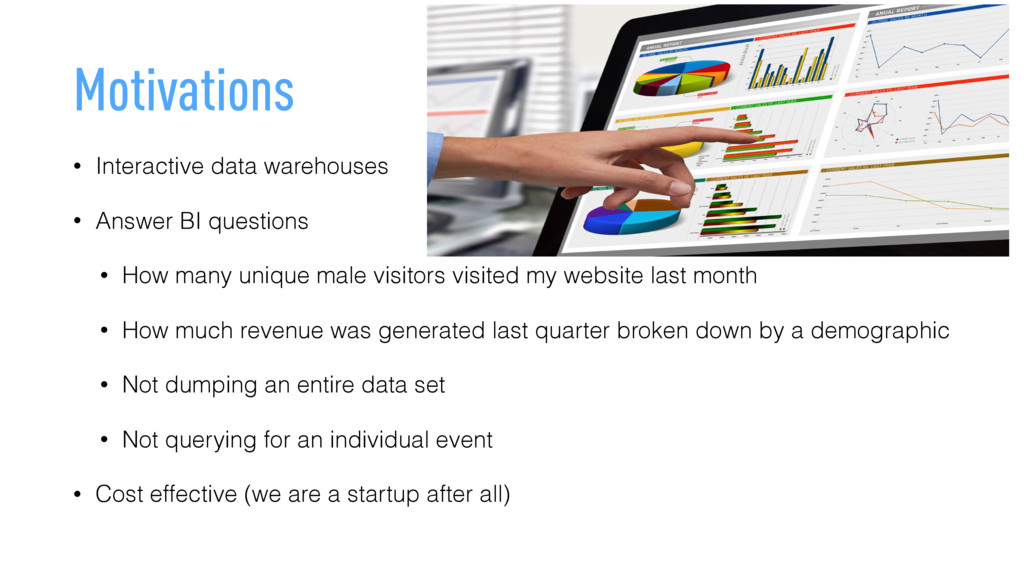
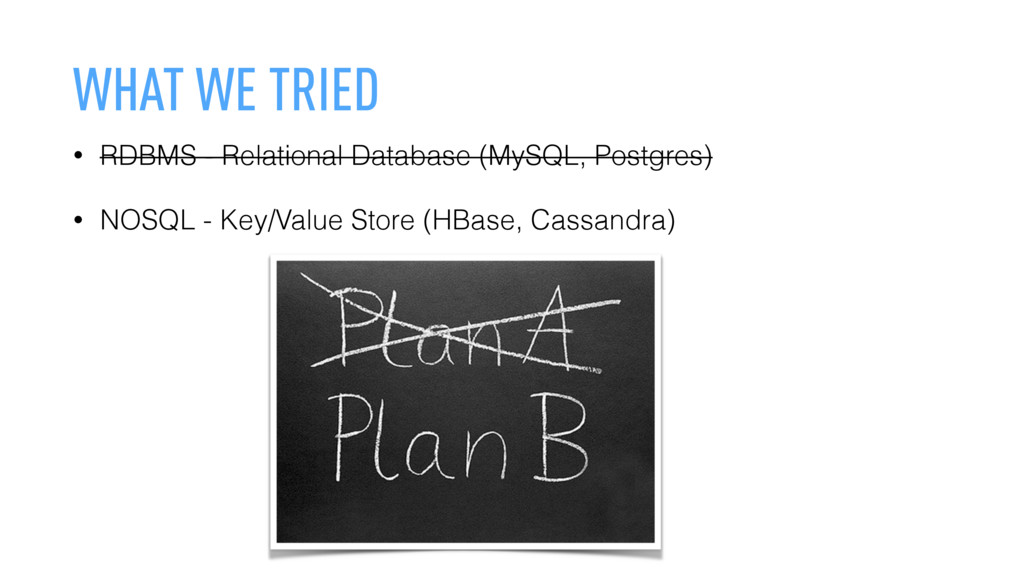
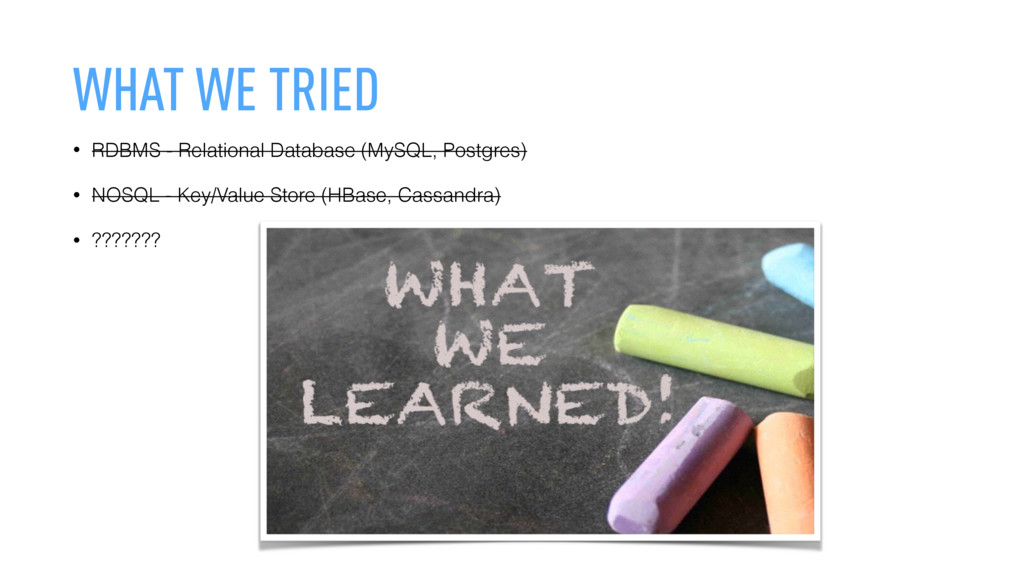
    How many unique male visitors visited my website last month • How much revenue was generated last quarter broken down by a demographic • Not dumping an entire data set • Not querying for an individual event • Cost effective (we are a startup after all)
  4. Technical Challenges • Ad-hoc queries • Arbitrarily slice ’n dice,

    and drill into data • Immediate insights • Scalability • Availability • Low operational overhead
  5. WHERE WE STAND TODAY • Over 10 trillion events •

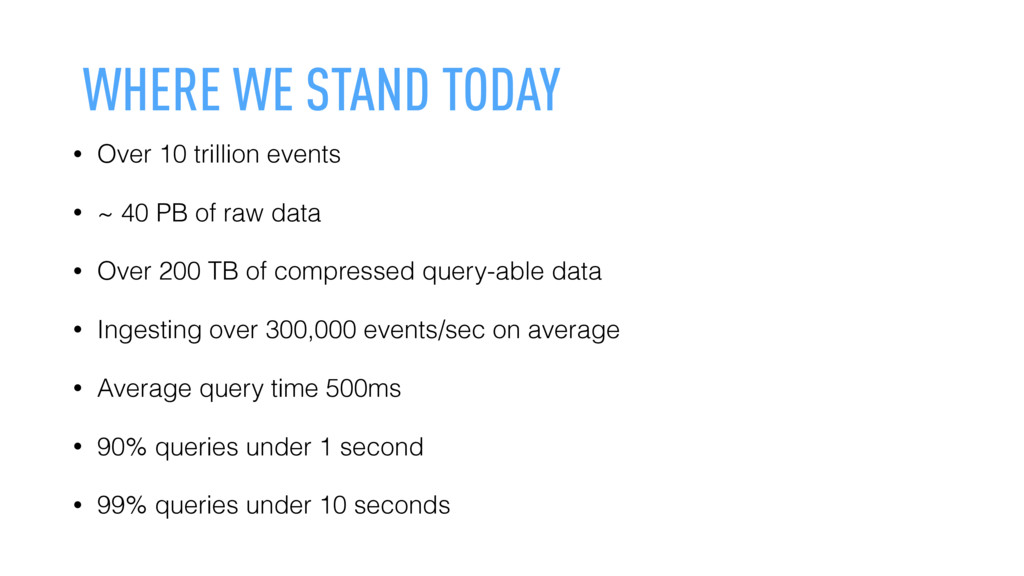
    ~ 40 PB of raw data • Over 200 TB of compressed query-able data • Ingesting over 300,000 events/sec on average • Average query time 500ms • 90% queries under 1 second • 99% queries under 10 seconds
  6. RDBMS - SETUP • Common setup for data warehousing •

    Star Schema • Aggregate Tables • Query Caching
  7. RDBMS - Results Naive benchmark scan rate ~ 5.5M rows

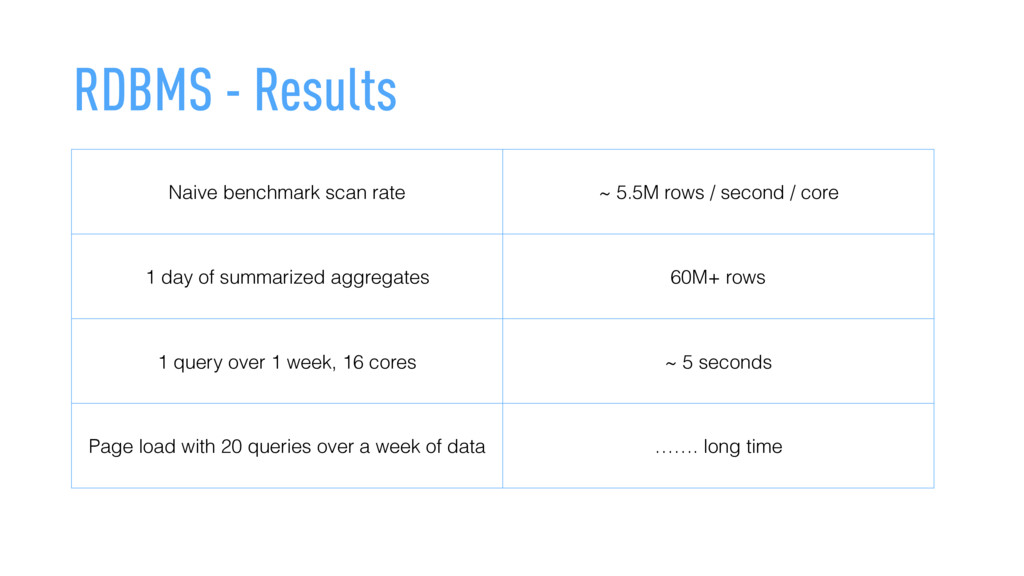
    / second / core 1 day of summarized aggregates 60M+ rows 1 query over 1 week, 16 cores ~ 5 seconds Page load with 20 queries over a week of data ……. long time
  8. WHAT WE TRIED • RDBMS - Relational Database (MySQL, Postgres)

    • NOSQL - Key/Value Store (HBase, Cassandra)
  9. NoSQL - Results • Queries were fast • range scan

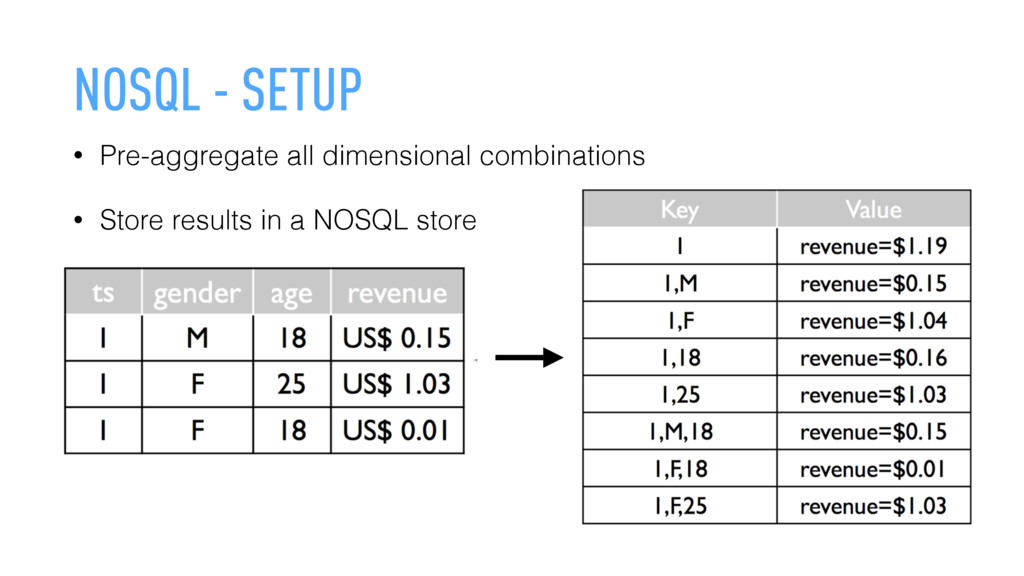
    on primary key • Inflexible • not aggregated, not available • Not continuously updated • Dimensional combinations & Processing => scales exponentially • Example: ~ 500k records • 11 dimensions : 4.5 hours on a 15-node Hadoop Cluster • 14 dimensions : 9 hours on a 25-node hadoop cluster
  10. WHAT WE TRIED • RDBMS - Relational Database (MySQL, Postgres)

    • NOSQL - Key/Value Store (HBase, Cassandra)
  11. WHAT WE TRIED • RDBMS - Relational Database (MySQL, Postgres)

    • NOSQL - Key/Value Store (HBase, Cassandra) • ???????
  12. WHAT WE LEARNED • Problem with RDBMS : scans are

    slow • Problem with NoSQL : computationally intractable • Tackling the RDBMS issue seems easier
  13. What is Druid ? • Open-Source • Column-oriented • Distributed

    • Fast • Real-time • Approximate & Exact • Highly Available • Scalable to Petabytes • Deploy Anywhere • Data store
  14. Historical Nodes • Main workhorses of a Druid cluster •

    Shared-nothing architecture • Load Immutable read-optimized Segments • Respond to queries
  15. Broker Nodes • Query Scatter/Gather • Maintain a timeline view

    of the cluster • Send requests to multiple historical nodes and merge results • Supports Caching of query results
  16. Real-Time Nodes • Log-structured merge-tree • Ingest data and buffer

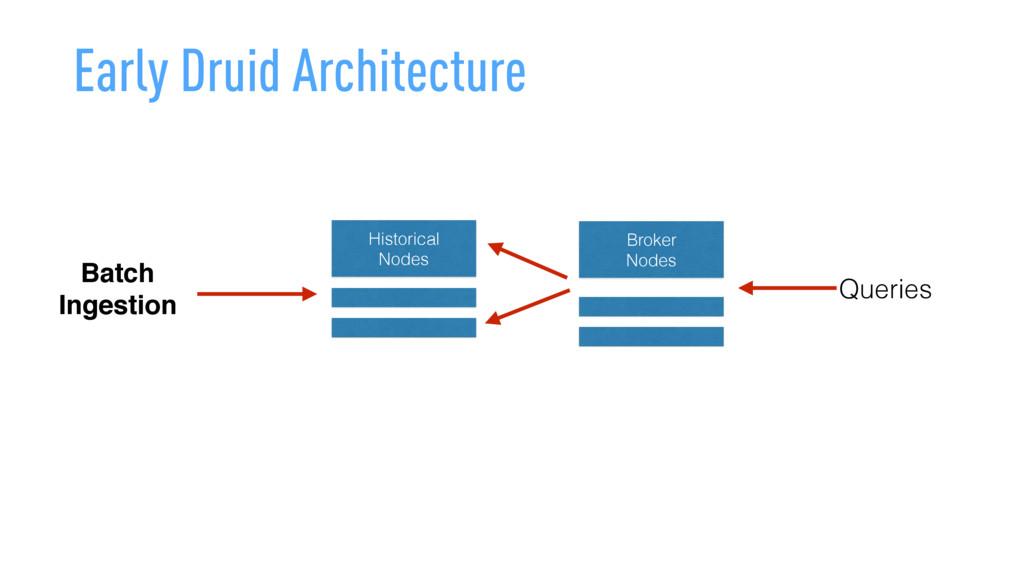
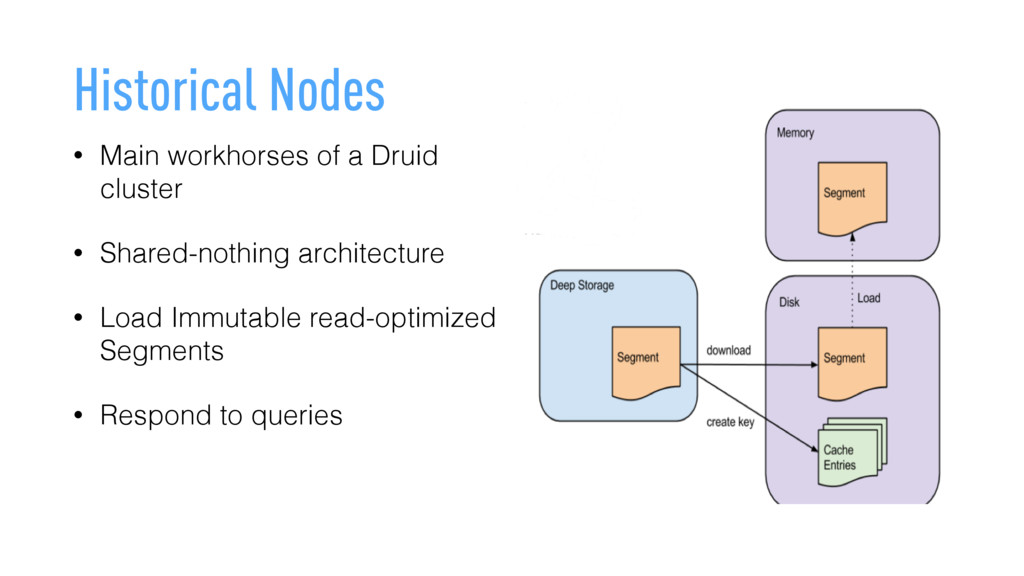
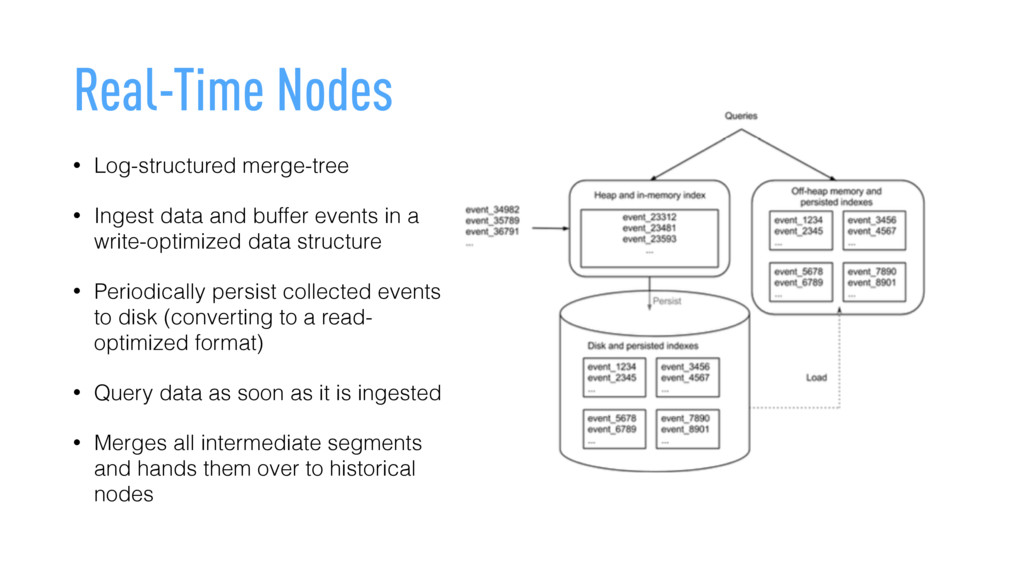
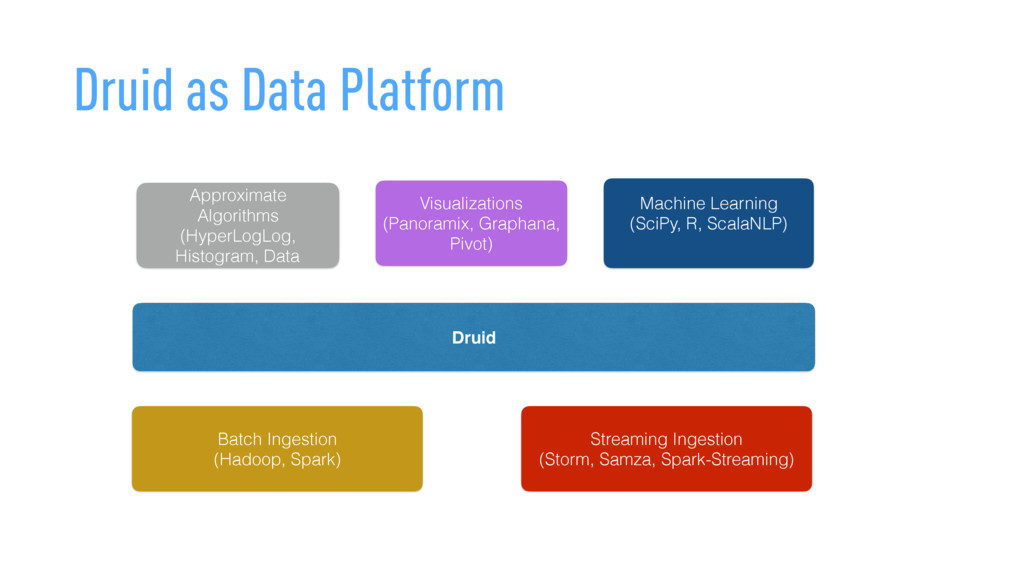
    events in a write-optimized data structure • Periodically persist collected events to disk (converting to a read- optimized format) • Query data as soon as it is ingested • Merges all intermediate segments and hands them over to historical nodes
  17. Coordinator Nodes • Distributes data across historical nodes • Asks

    historical nodes to drop/load data • Manages replication
  18. More Problems as we grew….. • Monitoring • Scaling •

    Efficiency • Cost • Software Updates • Multi tenancy
  19. Monitoring Druid Cluster • Emitting and Collecting metrics data for

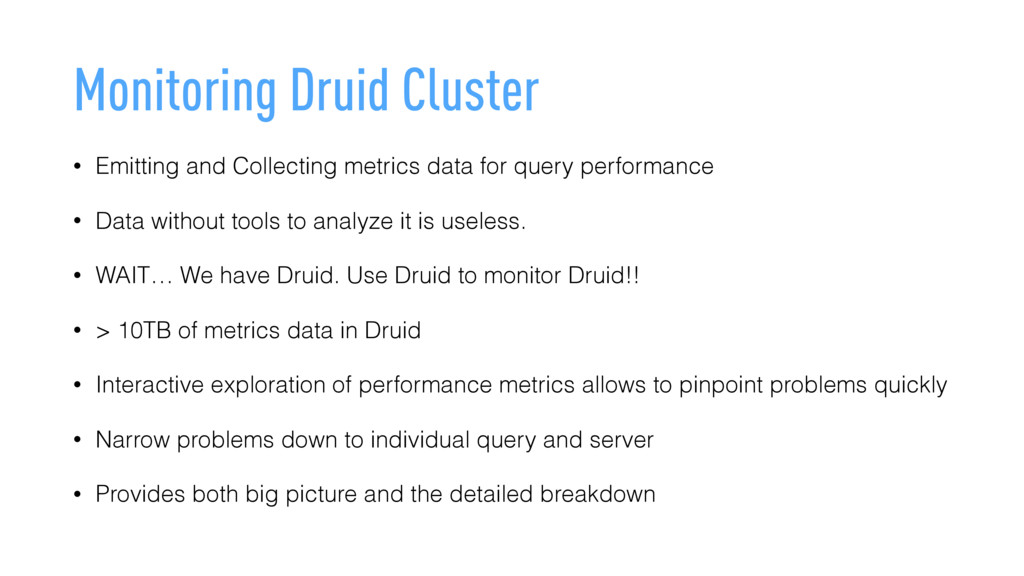
    query performance • Data without tools to analyze it is useless. • WAIT… We have Druid. Use Druid to monitor Druid!! • > 10TB of metrics data in Druid • Interactive exploration of performance metrics allows to pinpoint problems quickly • Narrow problems down to individual query and server • Provides both big picture and the detailed breakdown
  20. Scaling is Hard • Data doubles every 2 months •

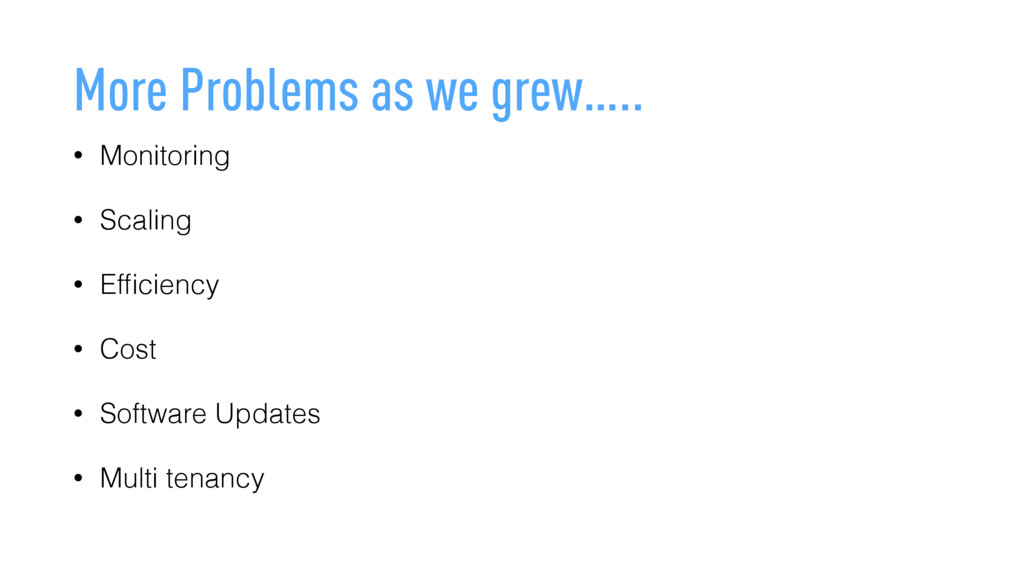
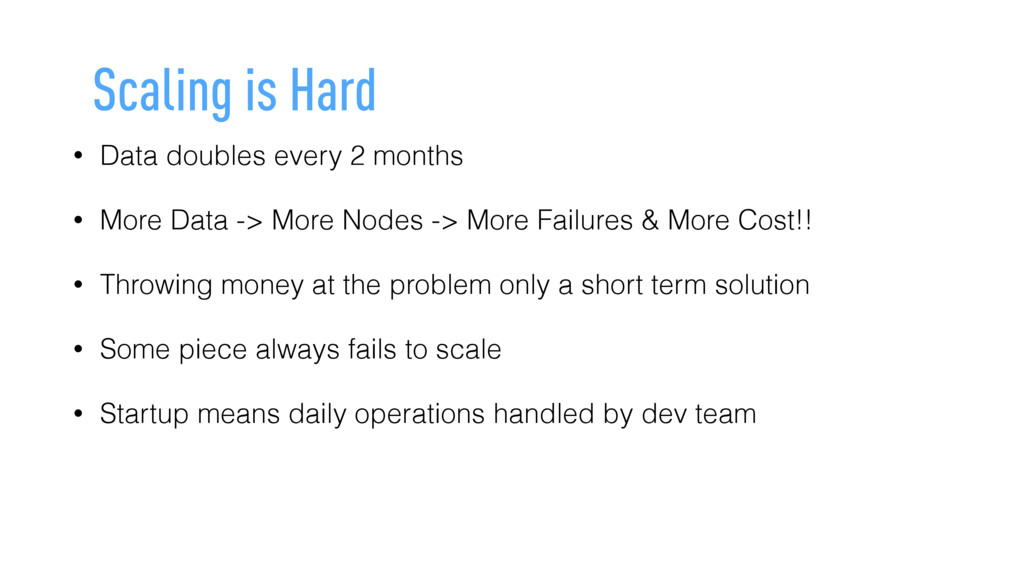
    More Data -> More Nodes -> More Failures & More Cost!! • Throwing money at the problem only a short term solution • Some piece always fails to scale • Startup means daily operations handled by dev team
  21. Understanding Users and their Queries • Analyze customer query data

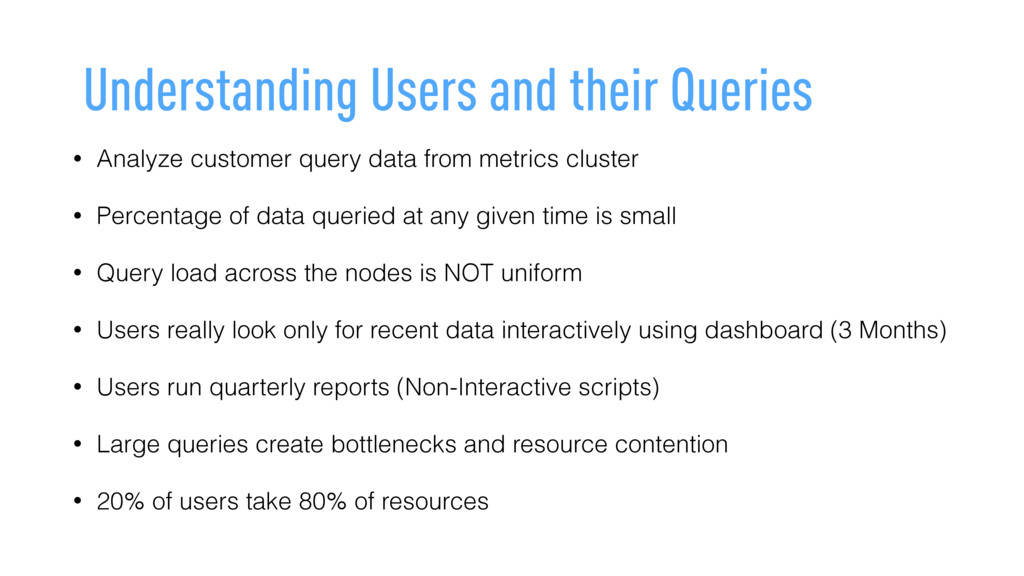
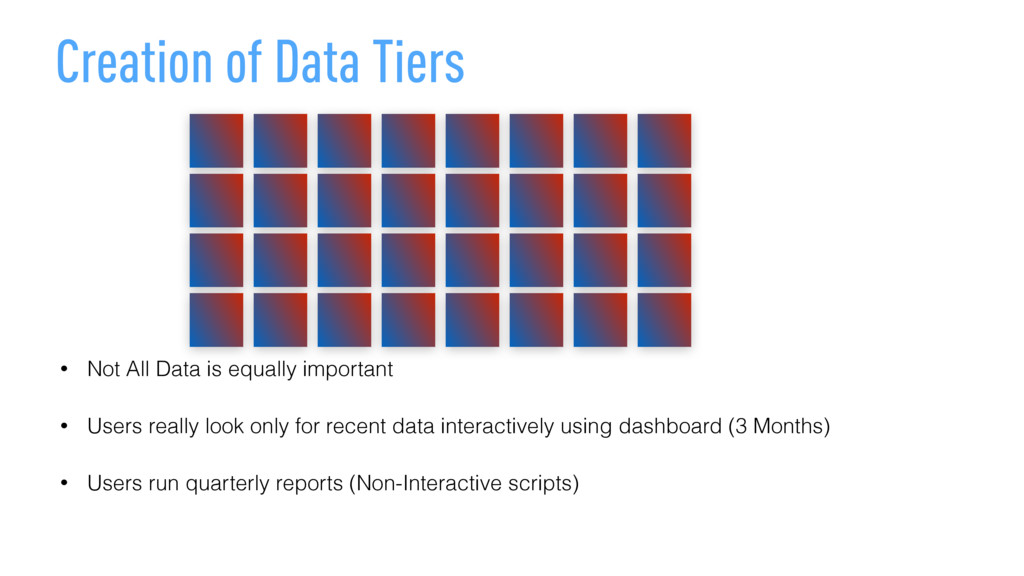
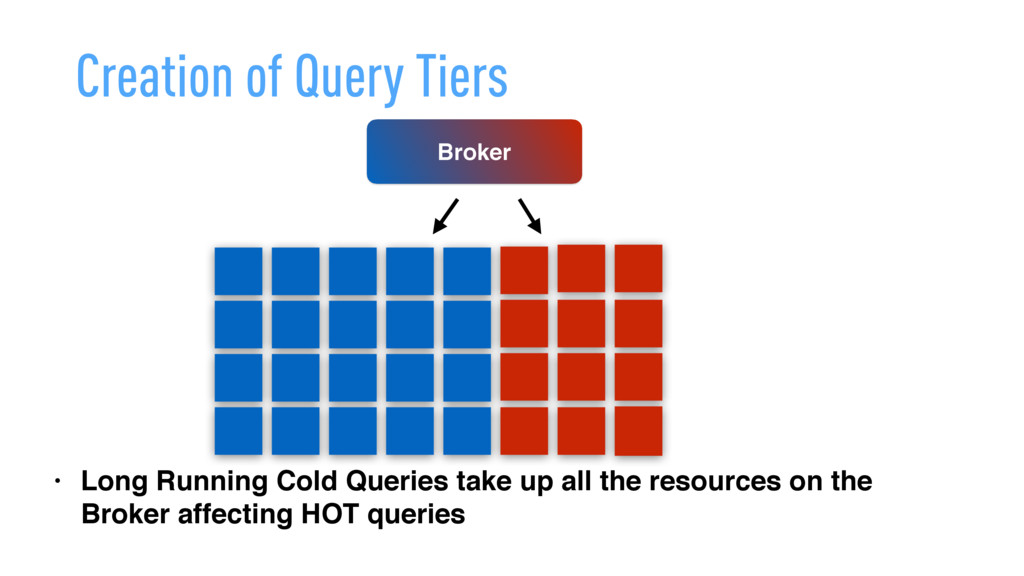
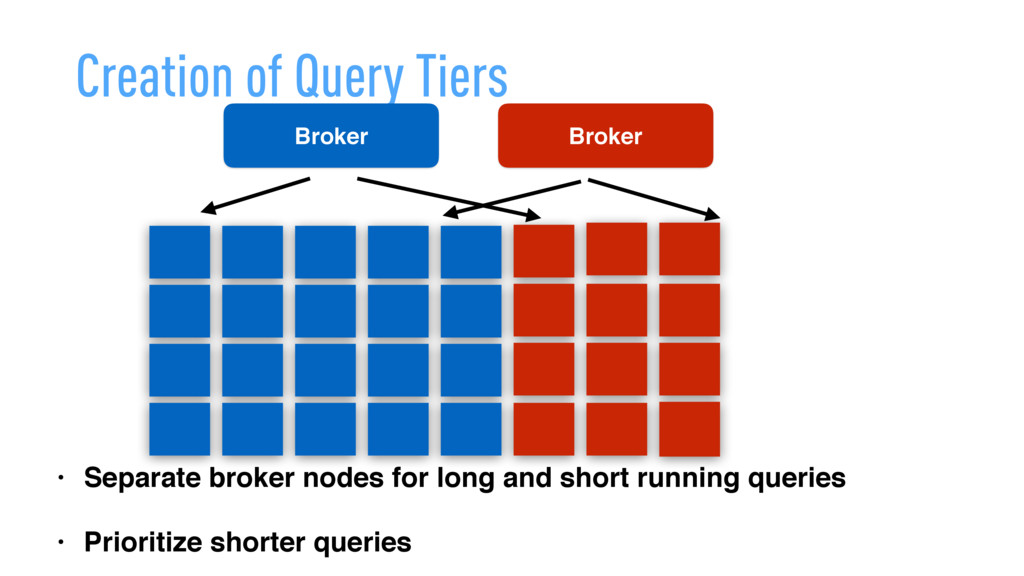
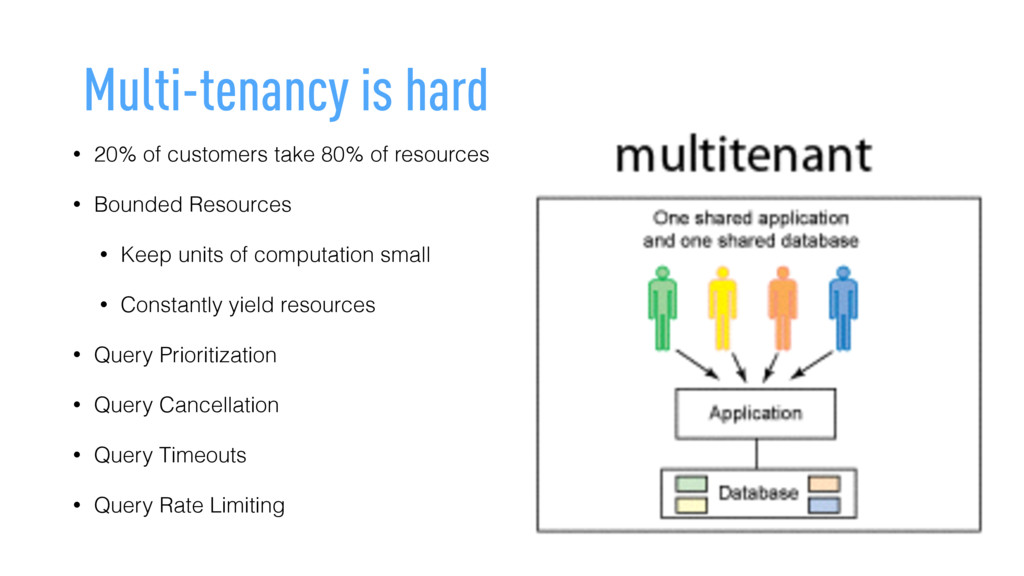
    from metrics cluster • Percentage of data queried at any given time is small • Query load across the nodes is NOT uniform • Users really look only for recent data interactively using dashboard (3 Months) • Users run quarterly reports (Non-Interactive scripts) • Large queries create bottlenecks and resource contention • 20% of users take 80% of resources
  22. Use Memory Mapped files • All in-memory - fast and

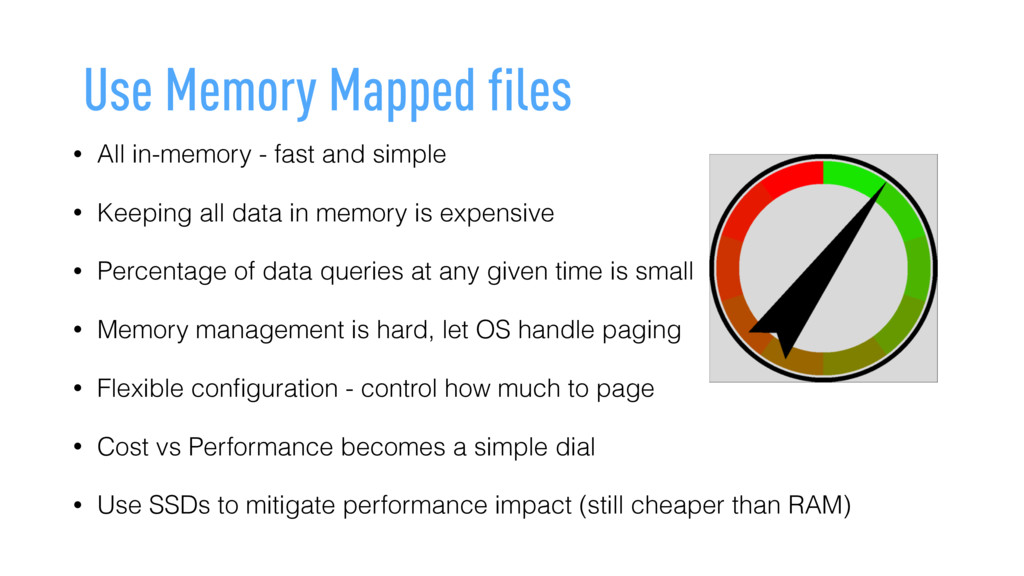
    simple • Keeping all data in memory is expensive • Percentage of data queries at any given time is small • Memory management is hard, let OS handle paging • Flexible configuration - control how much to page • Cost vs Performance becomes a simple dial • Use SSDs to mitigate performance impact (still cheaper than RAM)
  23. Caching to Improve Performance • Caching of By Segment Query

    Results on Broker/Historical • Distributed Memcache Cluster for storingg by segment query results • Observations - • Improved User Experience • Reduce load on historical nodes • Cache Hit rate upto 60%
  24. Move to Fast Approximate Answers • Prefer fast approximate answers

    vs slow exact ones • HyperLogLog sketches for unique counts • Approximate top-k • Approximate histograms
  25. Compression : Reduce data size further • Paging out data

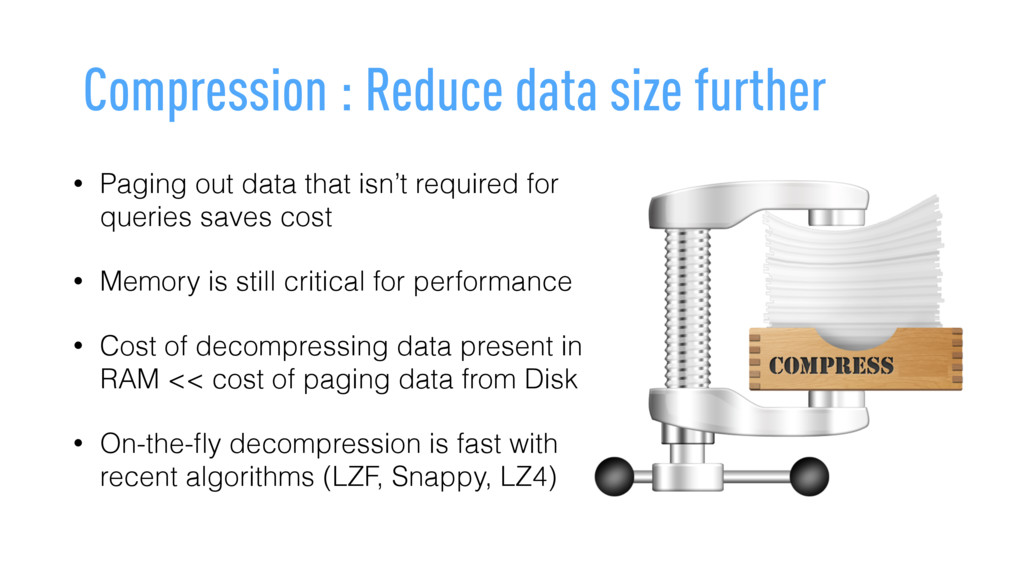
    that isn’t required for queries saves cost • Memory is still critical for performance • Cost of decompressing data present in RAM << cost of paging data from Disk • On-the-fly decompression is fast with recent algorithms (LZF, Snappy, LZ4)
  26. Smarter distribution of data • Constantly rebalance to keep workload

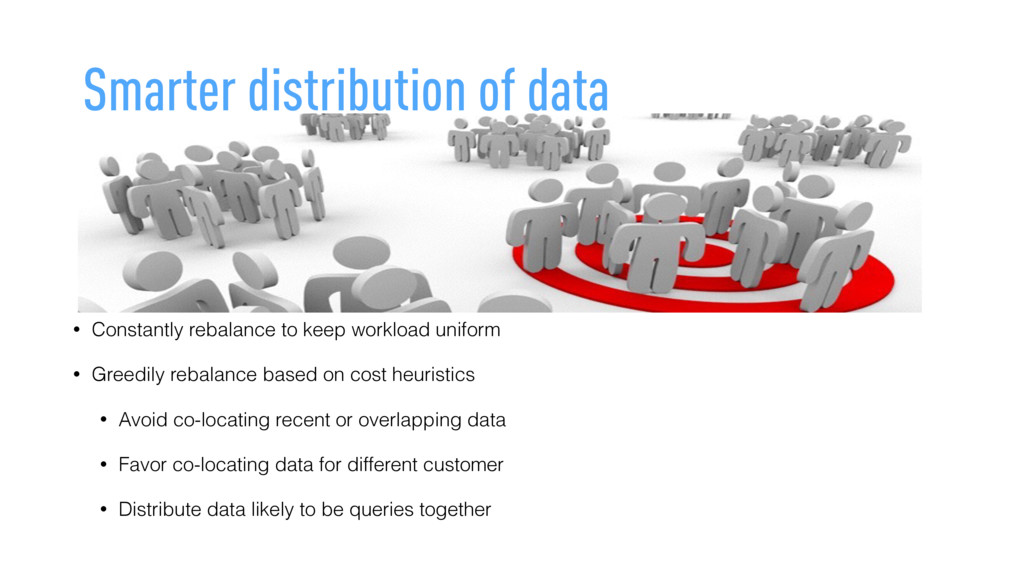
    uniform • Greedily rebalance based on cost heuristics • Avoid co-locating recent or overlapping data • Favor co-locating data for different customer • Distribute data likely to be queries together
  27. Creation of Data Tiers • Not All Data is equally

    important • Users really look only for recent data interactively using dashboard (3 Months) • Users run quarterly reports (Non-Interactive scripts)
  28. Creation of Data Tiers • COLD - high disk to

    cpu and disk to ram ratio for old data
  29. Creation of Data Tiers • COLD - high disk to

    cpu and disk to ram ratio for old data • HOT - low disk to cpu and low disk to ram for recent data
  30. Creation of Query Tiers Broker • Long Running Cold Queries

    take up all the resources on the Broker affecting HOT queries
  31. Creation of Query Tiers Broker • Separate broker nodes for

    long and short running queries • Prioritize shorter queries Broker
  32. Cost Effective Cross-Tier Replication • IT’s OK to be SLOW

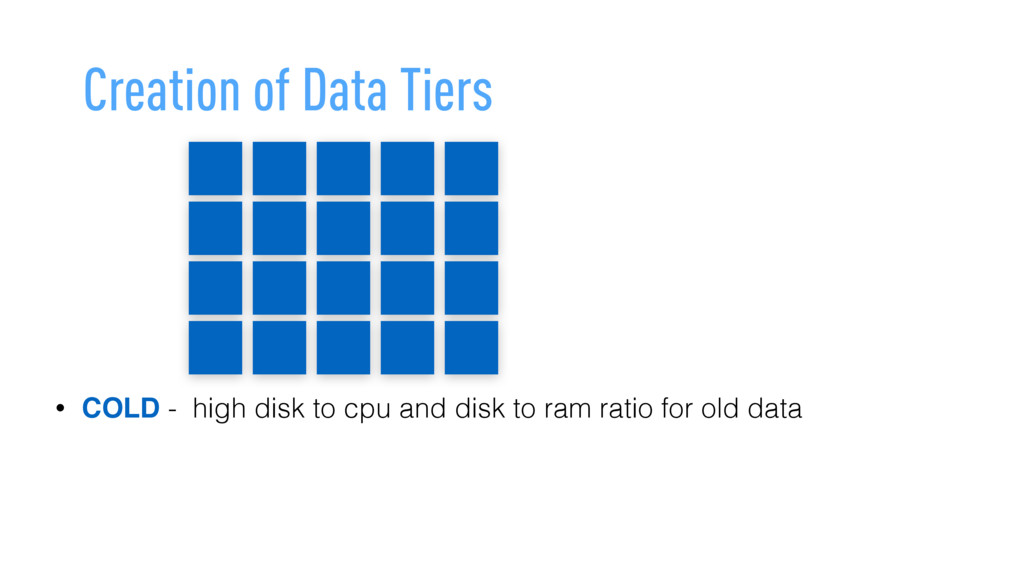
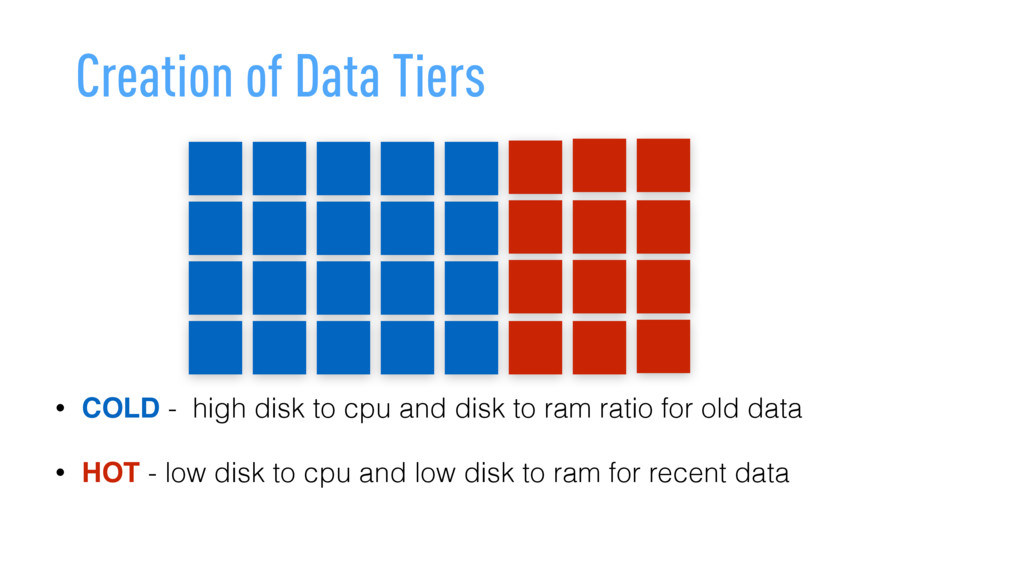
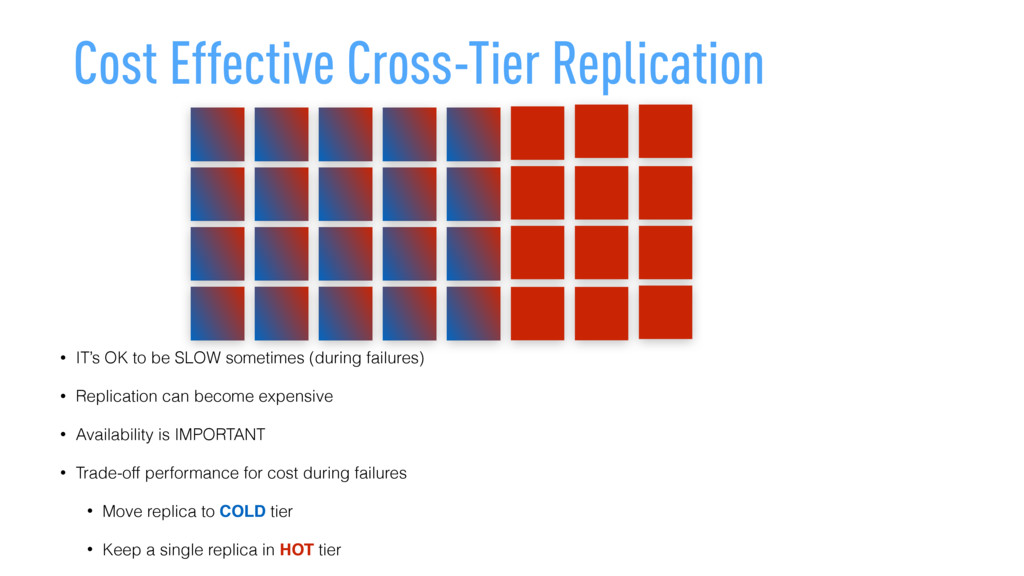
    sometimes (during failures) • Replication can become expensive • Availability is IMPORTANT • Trade-off performance for cost during failures • Move replica to COLD tier • Keep a single replica in HOT tier
  33. Rolling Upgrades 1 1 1 1 1 1 1 1

    1 2 2 2 2 2 2 2 2 2 3 • Data Redundancy - Segment Replication across nodes • Shared Nothing Architecture • Maintain backwards compatibility • Allow upgrading components independently • Easy to run experiments • NO Downtime
  34. Multi-tenancy is hard • 20% of customers take 80% of

    resources • Bounded Resources • Keep units of computation small • Constantly yield resources • Query Prioritization • Query Cancellation • Query Timeouts • Query Rate Limiting
  35. Druid as Data Platform Druid Approximate Algorithms (HyperLogLog, Histogram, Data

    Visualizations (Panoramix, Graphana, Pivot) Machine Learning (SciPy, R, ScalaNLP) Streaming Ingestion (Storm, Samza, Spark-Streaming) Batch Ingestion (Hadoop, Spark)
  36. Take Aways • Pick the right tool • Pick the

    tool optimized for the type of queries you will make • If none of the existing tools solve your problem, build it. • Understand your USERS • Analyze query patterns • Use cases should define the product • Tradeoffs are everywhere • Performance vs Cost (in-memory, tiering, compression) • Latency vs throughput (streaming vs batch ingestion) • Monitor everything