Upgrade to Pro — share decks privately, control downloads, hide ads and more …

Quantified Self: Analyzing the Big Data of our Daily Life

Quantified Self: Analyzing the Big Data of our Daily Life

PyData Berlin 2014 (Jul 26, 2014)
http://pydata.org/berlin2014/abstracts/#231

Andreas Schreiber

July 26, 2014
Tweet

More Decks by Andreas Schreiber

Other Decks in Science

Transcript

  1. Quantified Self: Analyzing the Big Data of our Daily Life

    Andreas Schreiber <[email protected]> PyData Berlin 2014 > PyData Berlin 2014 > Andreas Schreiber • Quantified Self > July 26, 2014 DLR.de • Chart 1
  2. Introduction > PyData Berlin 2014 > Andreas Schreiber • Quantified

    Self > July 26, 2014 DLR.de • Chart 2 Scientist, Head of department Co-Founder, CEO Co-Founder
  3. Python User since 1992 > PyData Berlin 2014 > Andreas

    Schreiber • Quantified Self > July 26, 2014 DLR.de • Chart 3
  4. Related Background > PyData Berlin 2014 > Andreas Schreiber •

    Quantified Self > July 26, 2014 DLR.de • Chart 4 Personal – Stroke 2009 https://twitter.com/onyame/status/6664357458 DLR – Telemedicine, AAL, Space medicine
  5. What is The Quantified Self? Self-knowledge through numbers • Analyze

    trends and set goals to improve yourself Recording of daily activities • Fitness, sleep, location, … • Monitoring and display of information from various devices, services, and applications > PyData Berlin 2014 > Andreas Schreiber • Quantified Self > July 26, 2014 DLR.de • Chart 6
  6. Other Terms • Self Tracking • Life Hacking • Life

    Logging • Self Optimization • … > PyData Berlin 2014 > Andreas Schreiber • Quantified Self > July 26, 2014 DLR.de • Chart 7
  7. Self Optimization Example Drinking Water Optimization task: • How much

    water is enough to not collapse during the heat period > PyData Berlin 2014 > Andreas Schreiber • Quantified Self > July 26, 2014 DLR.de • Chart 8
  8. Google Trends: “Quantified Self” > PyData Berlin 2014 > Andreas

    Schreiber • Quantified Self > July 26, 2014 DLR.de • Chart 9
  9. Regional Interest > PyData Berlin 2014 > Andreas Schreiber •

    Quantified Self > July 26, 2014 DLR.de • Chart 10
  10. Quantified Self Meetups > PyData Berlin 2014 > Andreas Schreiber

    • Quantified Self > July 26, 2014 DLR.de • Chart 11 http://quantified-self.meetup.com
  11. Objects of Tracking > PyData Berlin 2014 > Andreas Schreiber

    • Quantified Self > July 26, 2014 DLR.de • Chart 12
  12. Technologies for Self-Tracking > PyData Berlin 2014 > Andreas Schreiber

    • Quantified Self > July 26, 2014 DLR.de • Chart 13 0% 10% 20% 30% 40% 50% 60% 70% Mobile phones and apps Web- and desktop applications Self-tracking hardware Self-made desktop tools (spreadsheets etc.) Pen and paper Other Deployed technologies for self-tracking Source: Marcia Nißen, Quantified Self – An Exploratory Study on the Profiles and Motivations of Self-Tracking, Bachelor Thesis (2013)
  13. > PyData Berlin 2014 > Andreas Schreiber • Quantified Self

    > July 26, 2014 DLR.de • Chart 14 Rise of the Wearables
  14. My Self Tracking • With sensors • With smartphone apps

    > PyData Berlin 2014 > Andreas Schreiber • Quantified Self > July 26, 2014 DLR.de • Chart 15 Source: SAT.1/Weckup, http://bit.ly/10CEfUX
  15. Steps (Fitbit) > PyData Berlin 2014 > Andreas Schreiber •

    Quantified Self > July 26, 2014 DLR.de • Chart 16
  16. Weight (Withings) > PyData Berlin 2014 > Andreas Schreiber •

    Quantified Self > July 26, 2014 DLR.de • Chart 17
  17. Stress (W/Me) > PyData Berlin 2014 > Andreas Schreiber •

    Quantified Self > July 26, 2014 DLR.de • Chart 18
  18. Sleep (Sleep as Android) > PyData Berlin 2014 > Andreas

    Schreiber • Quantified Self > July 26, 2014 DLR.de • Chart 19
  19. Blood Pressure (BloodPressureCompanion) > PyData Berlin 2014 > Andreas Schreiber

    • Quantified Self > July 26, 2014 DLR.de • Chart 20
  20. Activity & Location (Moves) > PyData Berlin 2014 > Andreas

    Schreiber • Quantified Self > July 26, 2014 DLR.de • Chart 21 Source: WDR/Servicezeit, http://bit.ly/DigitaleSelbstvermessung
  21. Activity & Location (Moves) > PyData Berlin 2014 > Andreas

    Schreiber • Quantified Self > July 26, 2014 DLR.de • Chart 22
  22. Car (Dash) > PyData Berlin 2014 > Andreas Schreiber •

    Quantified Self > July 26, 2014 DLR.de • Chart 23
  23. Mobile Phone Usage & Well-being (Menthal) > PyData Berlin 2014

    > Andreas Schreiber • Quantified Self > July 26, 2014 DLR.de • Chart 24
  24. Weight (WeightCompanion) > PyData Berlin 2014 > Andreas Schreiber •

    Quantified Self > July 26, 2014 DLR.de • Chart 25
  25. Sharing > PyData Berlin 2014 > Andreas Schreiber • Quantified

    Self > July 26, 2014 DLR.de • Chart 26
  26. Human Centered > PyData Berlin 2014 > Andreas Schreiber •

    Quantified Self > July 26, 2014 DLR.de • Chart 27 Productivity Food Intake Photos Heart Rate Mood Pulse Activity Posture Environment Location (Social) Interactions Lab Values Weight Cloud Smartphone Doctor Photo: © WavebreakmediaMicro - Fotolia.com Family Health Insurance Weather Car Dog IoT (Smart Home) Urban Data (Smart City)
  27. The Data > PyData Berlin 2014 > Andreas Schreiber •

    Quantified Self > July 26, 2014 DLR.de • Chart 28
  28. Data Sources Heterogeneous data sources • Data from Wearables and

    other devices • Data from smartphone apps • Environmental data • Social data • IoT and urban data (smart home, smart car, smart city, …) Heterogeneous storage • Local files and databases (smartphone, device, desktop app) • Cloud > PyData Berlin 2014 > Andreas Schreiber • Quantified Self > July 26, 2014 DLR.de • Chart 29
  29. Accessing Local and Distributed Data Sources Export of files •

    Most apps and web services allow file export (CSV, Excel, JSON, …) APIs • Some vendors store date in their cloud only • Access via vendor APIs Unfortunately… • Some (good) apps don’t have any export functionality or API • APIs are very dissimilar for different vendors > PyData Berlin 2014 > Andreas Schreiber • Quantified Self > July 26, 2014 DLR.de • Chart 30
  30. Web Frontend Withings > PyData Berlin 2014 > Andreas Schreiber

    • Quantified Self > July 26, 2014 DLR.de • Chart 31
  31. API Diagram Withings > PyData Berlin 2014 > Andreas Schreiber

    • Quantified Self > July 26, 2014 DLR.de • Chart 32 Source: https://forum.quantifiedself.com/thread-breakout-mapping-data-access
  32. API Diagram Fitbit > PyData Berlin 2014 > Andreas Schreiber

    • Quantified Self > July 26, 2014 DLR.de • Chart 33 Source: https://forum.quantifiedself.com/thread-breakout-mapping-data-access
  33. Example Fitbit > PyData Berlin 2014 > Andreas Schreiber •

    Quantified Self > July 26, 2014 DLR.de • Chart 34
  34. Example Fitbit > PyData Berlin 2014 > Andreas Schreiber •

    Quantified Self > July 26, 2014 DLR.de • Chart 35
  35. Example Fitbit > PyData Berlin 2014 > Andreas Schreiber •

    Quantified Self > July 26, 2014 DLR.de • Chart 36
  36. Homogenizing the Data Different data formats • Almost every app

    and every Wearable has its own format! • No standardization • No access to raw data • Best practice: Import into pandas DataFrame, then work with it > PyData Berlin 2014 > Andreas Schreiber • Quantified Self > July 26, 2014 DLR.de • Chart 37
  37. Example TapLog Data latitude,longitude,altitude,accuracy,gpstime,street,city,state,country,zip,samples ,_id,timestamp,DayOfYear,DayOfMonth,DayOfWeek,TimeOfDay,catOne,catTwo,catThree,num ber,rating,note "50.92","6.95982","0","31.544","07/21/2014 08:18","Bonner Straße 7","Köln","no

    data","DE","50677","2","1517","21.07.2014 08:18","202","21","Montag", "8.308333333333334","Kaffee",,,,, "52.5231","13.4133","0","30","07/22/2014 08:18","Alexanderplatz 7","Berlin","no data","DE","10178","1","1518","22.07.2014 08:19","203","22","Dienstag", "8.3175","Kaffee",,,,, "52.5206","13.4158","0","23","07/22/2014 11:48","Alexanderstraße 11","Berlin","no data","DE","10178","2","1519","22.07.2014 11:48","203","22","Dienstag", "11.81611111111111","Kaffee",,,,, "52.5225","13.4095","0","29.69","07/22/2014 13:23","Karl-Liebknecht-Straße 15","Berlin","no data","DE","10178","1","1520","22.07.2014 13:23","203","22", "Dienstag","13.385","Kaffee",,,,, > PyData Berlin 2014 > Andreas Schreiber • Quantified Self > July 26, 2014 DLR.de • Chart 38
  38. Example Fitbit Data Aktivitäten Datum,Verbrannte Kalorien,Schritte,Strecke,Stockwerke,Minuten im Sitzen,Minuten mit leichter

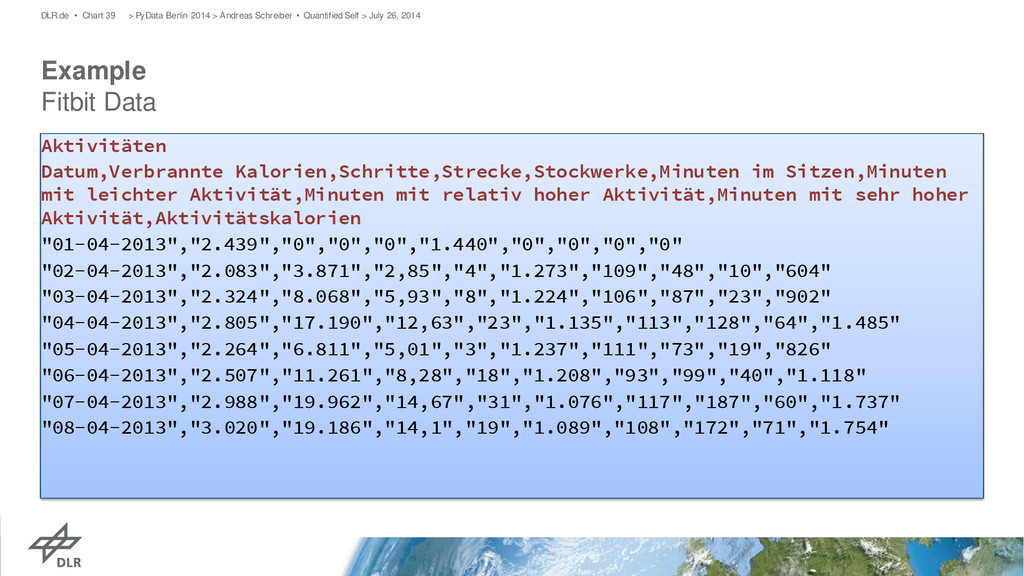
    Aktivität,Minuten mit relativ hoher Aktivität,Minuten mit sehr hoher Aktivität,Aktivitätskalorien "01-04-2013","2.439","0","0","0","1.440","0","0","0","0" "02-04-2013","2.083","3.871","2,85","4","1.273","109","48","10","604" "03-04-2013","2.324","8.068","5,93","8","1.224","106","87","23","902" "04-04-2013","2.805","17.190","12,63","23","1.135","113","128","64","1.485" "05-04-2013","2.264","6.811","5,01","3","1.237","111","73","19","826" "06-04-2013","2.507","11.261","8,28","18","1.208","93","99","40","1.118" "07-04-2013","2.988","19.962","14,67","31","1.076","117","187","60","1.737" "08-04-2013","3.020","19.186","14,1","19","1.089","108","172","71","1.754" > PyData Berlin 2014 > Andreas Schreiber • Quantified Self > July 26, 2014 DLR.de • Chart 39
  39. Example Moves Data Exports many formats • CSV, geojson, georss,

    gpx, ical, json, kml • daily, weekly, monthly, yearly, full • Different number of files for each format • For CSV: activities, places, storyline, summary > PyData Berlin 2014 > Andreas Schreiber • Quantified Self > July 26, 2014 DLR.de • Chart 40
  40. Moves Data places.csv Date,Name,Start,End,Duration,Latitude,Longitude,Category,Link 24.07.14,Park Inn by Radisson Berlin Alexanderplatz,2014-07-

    24T00:00:00+02:00,2014-07-24T09:45:33+02:00,35133,52.52276232628325, 13.412772417068481,, 24.07.14,DLR Simulations- und Softwaretechnik,2014-07-24T09:52:06+02:00,2014-07- 24T13:52:57+02:00,14451,52.52304792183411,13.409121930599213,, 24.07.14,bcc Berliner Congress Center,2014-07-24T14:08:14+02:00,2014-07- 24T17:42:27+02:00,12853,52.5206472294395,13.416452407836914,, 24.07.14,Park Inn by Radisson Berlin Alexanderplatz,2014-07- 24T17:53:11+02:00,2014-07-24T18:07:40+02:00,869,52.52276232628325, 13.412772417068481,, 24.07.14,Factory,2014-07-24T18:28:25+02:00,2014-07-24T22:08:39+02:00,13214, 52.5372503046785,13.395079791885648,, 24.07.14,St. Oberholz,2014-07-24T22:19:29+02:00,2014-07-24T22:39:47+02:00,1218, 52.52962477028307,13.401576783271219,, > PyData Berlin 2014 > Andreas Schreiber • Quantified Self > July 26, 2014 DLR.de • Chart 41
  41. Moves Data activities.csv Date,Activity,Group,Start,End,Duration,Distance,Steps,Calories 24.07.14,walking,walking,2014-07-24T09:17:35+02:00,2014-07-24T09:20:33+02:00,178,0.134,159,0 24.07.14,walking,walking,2014-07-24T09:45:33+02:00,2014-07-24T09:52:06+02:00,393,0.383,641,0 24.07.14,walking,walking,2014-07-24T10:00:24+02:00,2014-07-24T10:04:03+02:00,219,0.307,409,0 24.07.14,walking,walking,2014-07-24T13:13:42+02:00,2014-07-24T13:14:42+02:00,60,0.045,91,0 24.07.14,walking,walking,2014-07-24T13:52:57+02:00,2014-07-24T14:08:14+02:00,917,0.820,1404,0 24.07.14,walking,walking,2014-07-24T14:22:52+02:00,2014-07-24T14:26:57+02:00,245,0.221,295,0

    24.07.14,walking,walking,2014-07-24T15:28:11+02:00,2014-07-24T15:30:16+02:00,125,0.126,168,0 24.07.14,walking,walking,2014-07-24T16:36:34+02:00,2014-07-24T16:37:04+02:00,30,0.015,30,0 24.07.14,walking,walking,2014-07-24T17:42:27+02:00,2014-07-24T17:53:11+02:00,644,0.346,649,0 24.07.14,walking,walking,2014-07-24T18:05:01+02:00,2014-07-24T18:05:31+02:00,30,0.015,27,0 24.07.14,walking,walking,2014-07-24T18:07:40+02:00,2014-07-24T18:14:47+02:00,427,0.316,501,0 24.07.14,transport,transport,2014-07-24T18:14:47+02:00,2014-07-24T18:21:49+02:00,422,2.593,0,0 24.07.14,walking,walking,2014-07-24T18:21:49+02:00,2014-07-24T18:28:25+02:00,396,0.434,491,0 24.07.14,walking,walking,2014-07-24T18:33:21+02:00,2014-07-24T18:33:51+02:00,30,0.015,20,0 24.07.14,walking,walking,2014-07-24T21:03:01+02:00,2014-07-24T21:04:31+02:00,90,0.060,121,0 24.07.14,walking,walking,2014-07-24T22:05:26+02:00,2014-07-24T22:06:26+02:00,60,0.045,90,0 > PyData Berlin 2014 > Andreas Schreiber • Quantified Self > July 26, 2014 DLR.de • Chart 42
  42. Moves Data storyline.csv Date,Type,Name,Start,End,Duration 24.07.14,place,Park Inn by Radisson Berlin Alexanderplatz,2014-07-24T00:00:00+02:00,2014-07-

    24T09:45:33+02:00,35133 24.07.14,move,walking,2014-07-24T09:45:33+02:00,2014-07-24T09:52:06+02:00,393 24.07.14,place,DLR Simulations- und Softwaretechnik,2014-07-24T09:52:06+02:00,2014-07- 24T13:52:57+02:00,14451 24.07.14,move,walking,2014-07-24T13:52:57+02:00,2014-07-24T14:08:14+02:00,917 24.07.14,place,bcc Berliner Congress Center,2014-07-24T14:08:14+02:00,2014-07-24T17:42:27+02:00,12853 24.07.14,move,walking,2014-07-24T17:42:27+02:00,2014-07-24T17:53:11+02:00,644 24.07.14,place,Park Inn by Radisson Berlin Alexanderplatz,2014-07-24T17:53:11+02:00,2014-07- 24T18:07:40+02:00,869 24.07.14,move,walking,2014-07-24T18:07:40+02:00,2014-07-24T18:14:47+02:00,427 24.07.14,move,transport,2014-07-24T18:14:47+02:00,2014-07-24T18:21:49+02:00,422 24.07.14,move,walking,2014-07-24T18:21:49+02:00,2014-07-24T18:28:25+02:00,396 24.07.14,place,Factory,2014-07-24T18:28:25+02:00,2014-07-24T22:08:39+02:00,13214 24.07.14,move,walking,2014-07-24T22:08:39+02:00,2014-07-24T22:19:28+02:00,649 24.07.14,place,St. Oberholz,2014-07-24T22:19:29+02:00,2014-07-24T22:39:47+02:00,1218 24.07.14,move,walking,2014-07-24T22:39:47+02:00,2014-07-24T22:45:40+02:00,353 > PyData Berlin 2014 > Andreas Schreiber • Quantified Self > July 26, 2014 DLR.de • Chart 43
  43. Moves Data: Places in Outlook (ical) > PyData Berlin 2014

    > Andreas Schreiber • Quantified Self > July 26, 2014 DLR.de • Chart 44
  44. Example Date Formats Luckily, pandas can already handle many of

    these! • Example: > PyData Berlin 2014 > Andreas Schreiber • Quantified Self > July 26, 2014 DLR.de • Chart 45 2014-07-24T09:17:35+02:00 "01-04-2013" "07/21/2014 08:18" "Europe/Amsterdam","25. 07. 2014 0:11" "2014-03-23 21:35 Uhr" 21.04.2012,23:16 pandas.read_csv("filename.csv“, ) parse_dates=True dayfirst=True parse_dates=[[0, 1]]
  45. Analyzing and Visualizing the Data Data analytics and visualization is

    essential to get insights • What does the data mean? • How does data correlate to some other data? • What can I learn for my self? Currently, many web sites for analytics and visualization arise > PyData Berlin 2014 > Andreas Schreiber • Quantified Self > July 26, 2014 DLR.de • Chart 46 zenobase.com addapp.io pryv.com traqs.me fluxstream.org
  46. Exploring the Data with Python, IPython, pandas, … > PyData

    Berlin 2014 > Andreas Schreiber • Quantified Self > July 26, 2014 DLR.de • Chart 47
  47. Sleep Efficiency vs Duration > PyData Berlin 2014 > Andreas

    Schreiber • Quantified Self > July 26, 2014 DLR.de • Chart 48
  48. Finding Answers within the Data … even if I didn’t

    know, that there was a questions ;) New questions arise while tracking New possibilities with all the data > PyData Berlin 2014 > Andreas Schreiber • Quantified Self > July 26, 2014 DLR.de • Chart 49 Coffee Intake – Hourly Distribution
  49. Visualization and Data Analytics on Mobile Devices Many people use

    only apps Quantified Self apps • Should have visualization • Should have some data analysis As app developers, we would love to do that with Python Requirements • Good visualization components for mobile platforms (Android, iOS) • Tools like NumPy, pandas, scikit-learn etc. available on mobile platforms > PyData Berlin 2014 > Andreas Schreiber • Quantified Self > July 26, 2014 DLR.de • Chart 50
  50. Machine Learning Typical Use Cases (for Mobile Apps) Predicting Behavior

    Patterns • Detecting medication non-adherence • Remind users for measuring blood pressure • Advice users to get some sleep Detecting stress and depression • Stress detection based on heart rate variability (in combination with suitable Wearables) • Depression detection based on communication behavior > PyData Berlin 2014 > Andreas Schreiber • Quantified Self > July 26, 2014 DLR.de • Chart 51
  51. Fit4Duty (under development) Measuring cognitive performance Pilots and others •

    Sleep Tracking • Psychomotor Vigilance Task (PVT) Machine Learning for • Predicting Fitness for Duty • Predicting fatigue (during flights) Hardware and smartphone app > PyData Berlin 2014 > Andreas Schreiber • Quantified Self > July 26, 2014 DLR.de • Chart 52
  52. Current Research Provenance of QS data • Trust and Traceability

    of data • Privacy audits Standardized APIs Code Offloading • Moving code for computations to the cloud > PyData Berlin 2014 > Andreas Schreiber • Quantified Self > July 26, 2014 DLR.de • Chart 53
  53. Thank You! > PyData Berlin 2014 > Andreas Schreiber •

    Quantified Self > July 26, 2014 DLR.de • Chart 54 Questions? [email protected] www.dlr.de/sc | @onyame