Upgrade to Pro — share decks privately, control downloads, hide ads and more …

Building Telemetry and Anomaly Detection Models...

Building Telemetry and Anomaly Detection Models for Cloud Native Storage

by Xing Yang, Futurewei and Seiya Takei, Yahoo! JAPAN

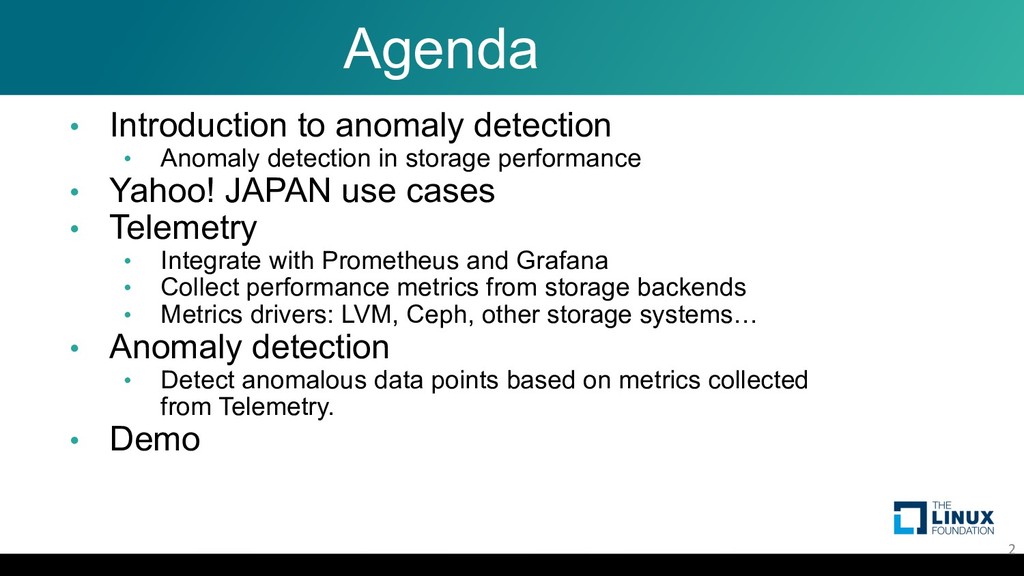
• Introduction to anomaly detection
- Anomaly detection in storage performance
• Yahoo! JAPAN use cases
• Telemetry
- Integrate with Prometheus and Grafana
- Collect performance metrics from storage backends
- Metrics drivers: LVM, Ceph, other storage systems...
• Anomaly detection
- Detect anomalous data points based on metrics collected
from Telemetry.
•Demo

Avatar for OpenSDS

OpenSDS

July 17, 2019

More Decks by OpenSDS

Other Decks in Technology

Transcript

  1. Building Telemetry and Anomaly Detection Models for Cloud Native Storage

    Xing Yang, Futurewei and Seiya Takei, Yahoo! JAPAN @opensds_io
  2. Agenda • Introduction to anomaly detection • Anomaly detection in

    storage performance • Yahoo! JAPAN use cases • Telemetry • Integrate with Prometheus and Grafana • Collect performance metrics from storage backends • Metrics drivers: LVM, Ceph, other storage systems… • Anomaly detection • Detect anomalous data points based on metrics collected from Telemetry. • Demo 2
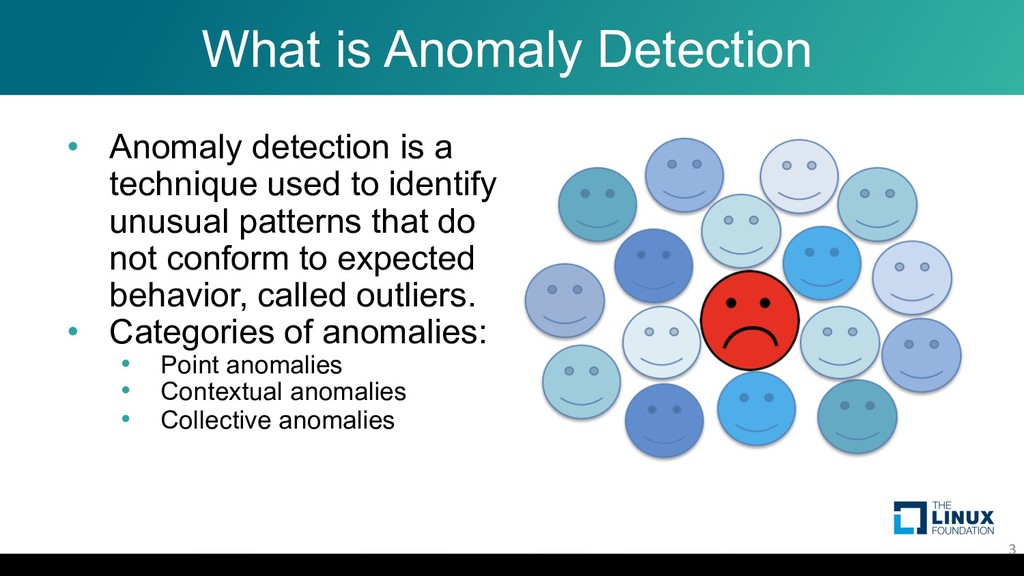
  3. What is Anomaly Detection • Anomaly detection is a technique

    used to identify unusual patterns that do not conform to expected behavior, called outliers. • Categories of anomalies: • Point anomalies • Contextual anomalies • Collective anomalies 3
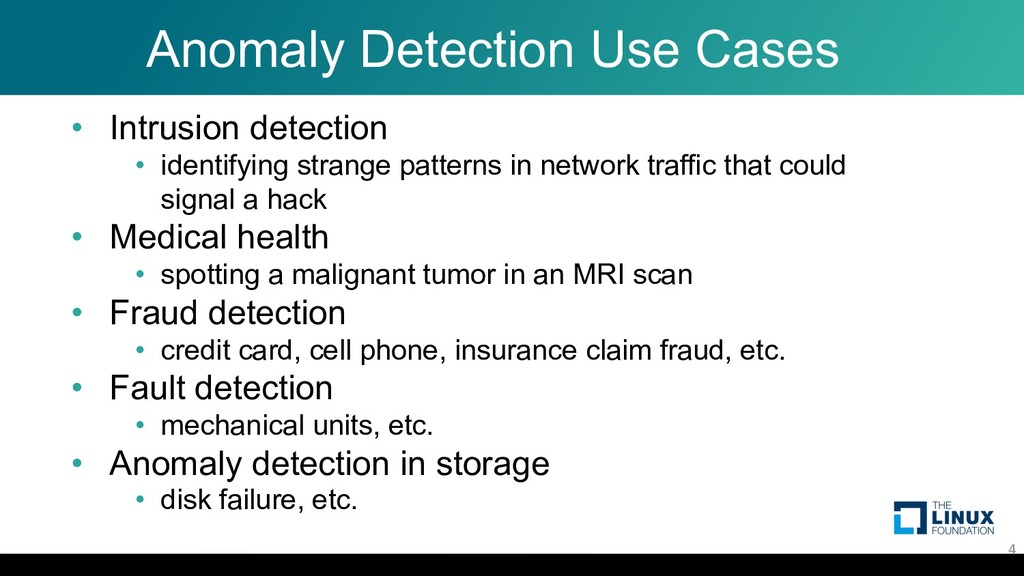
  4. Anomaly Detection Use Cases • Intrusion detection • identifying strange

    patterns in network traffic that could signal a hack • Medical health • spotting a malignant tumor in an MRI scan • Fraud detection • credit card, cell phone, insurance claim fraud, etc. • Fault detection • mechanical units, etc. • Anomaly detection in storage • disk failure, etc. 4
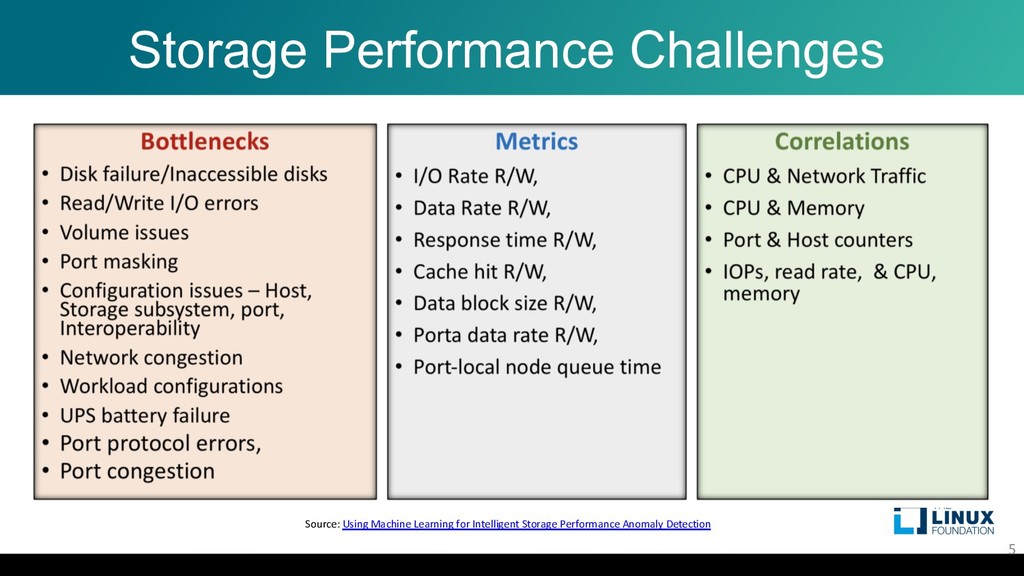
  5. Storage Performance Challenges Storage Performance Challenges 5 Source: Using Machine

    Learning for Intelligent Storage Performance Anomaly Detection
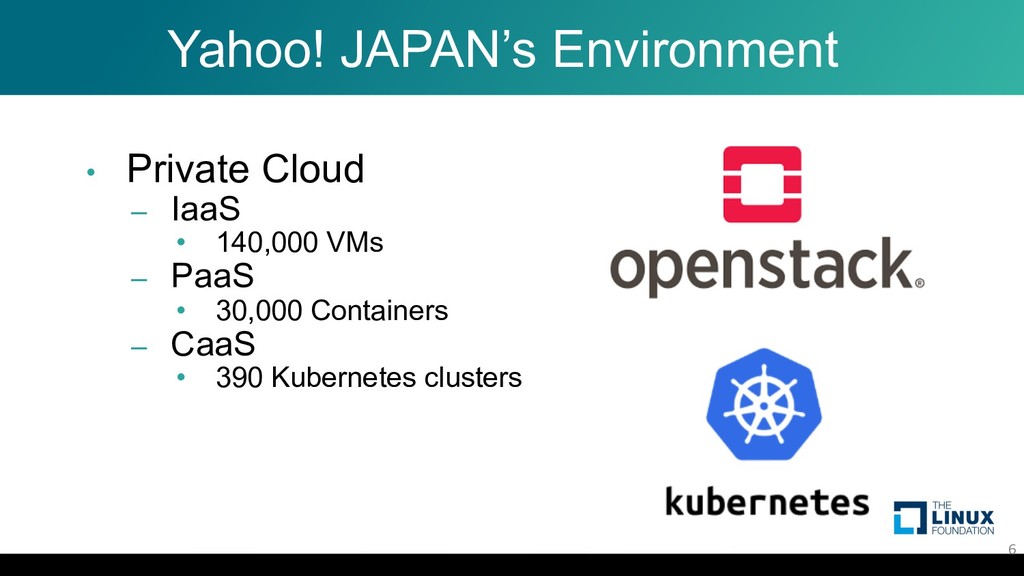
  6. Yahoo! JAPAN’s Environment 6 • Private Cloud – IaaS •

    140,000 VMs – PaaS • 30,000 Containers – CaaS • 390 Kubernetes clusters
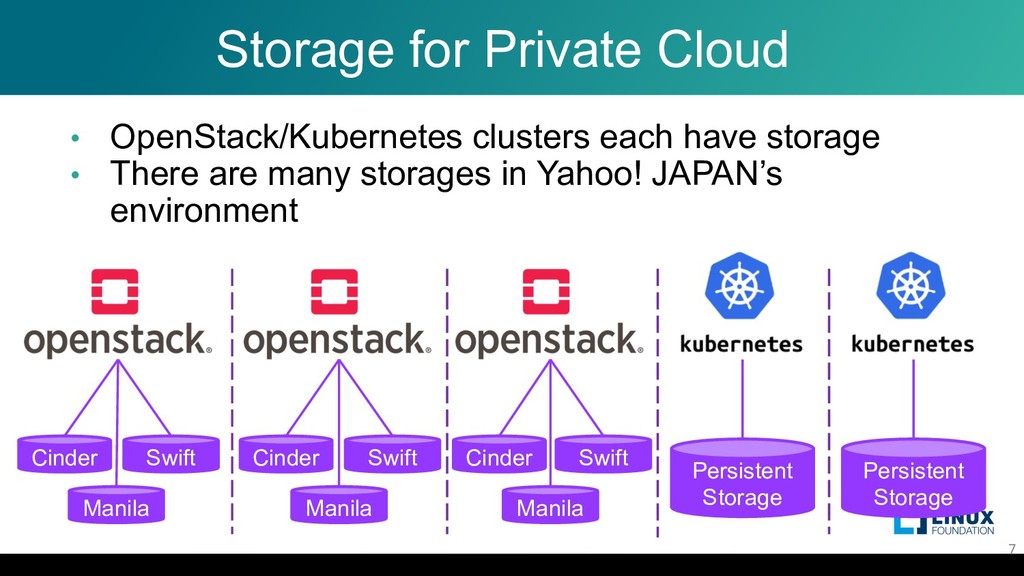
  7. Storage for Private Cloud 7 Cinder Manila Swift Cinder Manila

    Swift Cinder Manila Swift Persistent Storage Persistent Storage • OpenStack/Kubernetes clusters each have storage • There are many storages in Yahoo! JAPAN’s environment
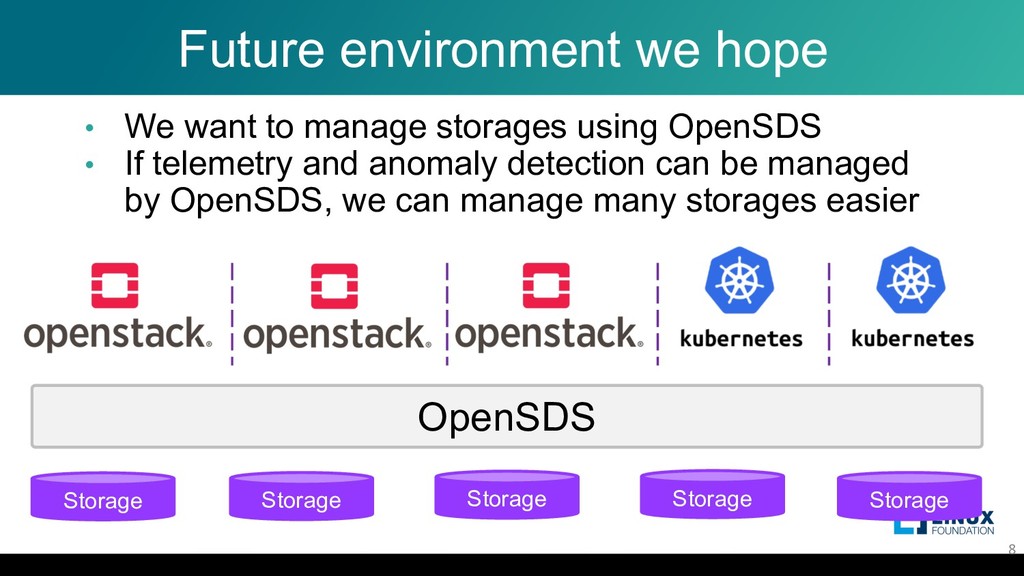
  8. Future environment we hope 8 Storage OpenSDS Storage Storage Storage

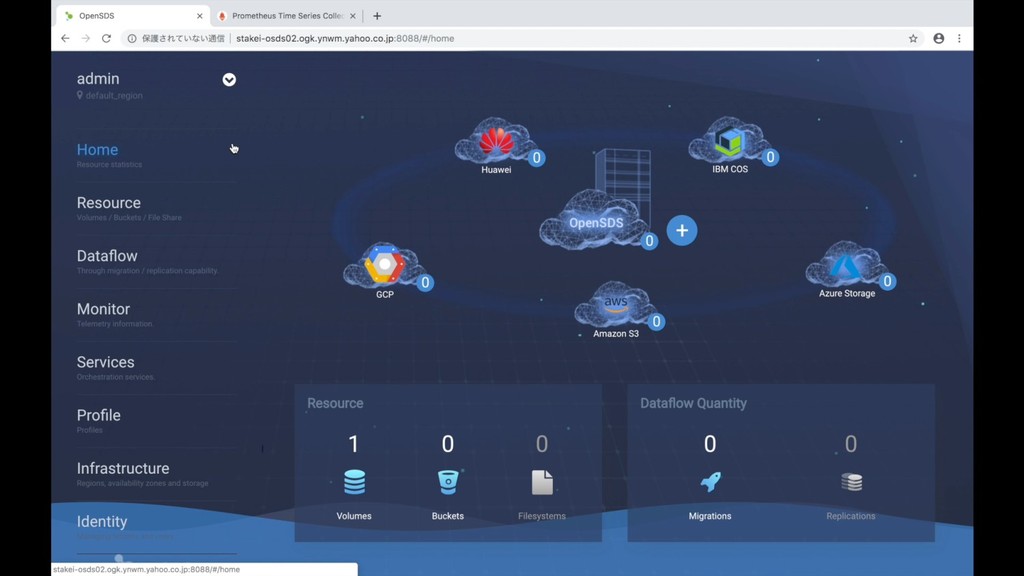
    Storage • We want to manage storages using OpenSDS • If telemetry and anomaly detection can be managed by OpenSDS, we can manage many storages easier
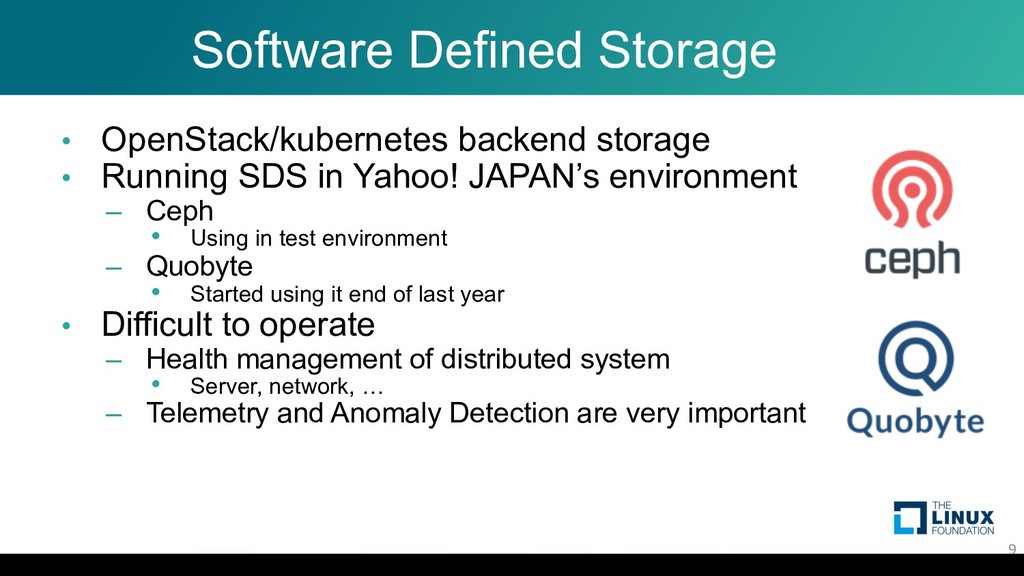
  9. 9 Software Defined Storage • OpenStack/kubernetes backend storage • Running

    SDS in Yahoo! JAPAN’s environment – Ceph • Using in test environment – Quobyte • Started using it end of last year • Difficult to operate – Health management of distributed system • Server, network, … – Telemetry and Anomaly Detection are very important
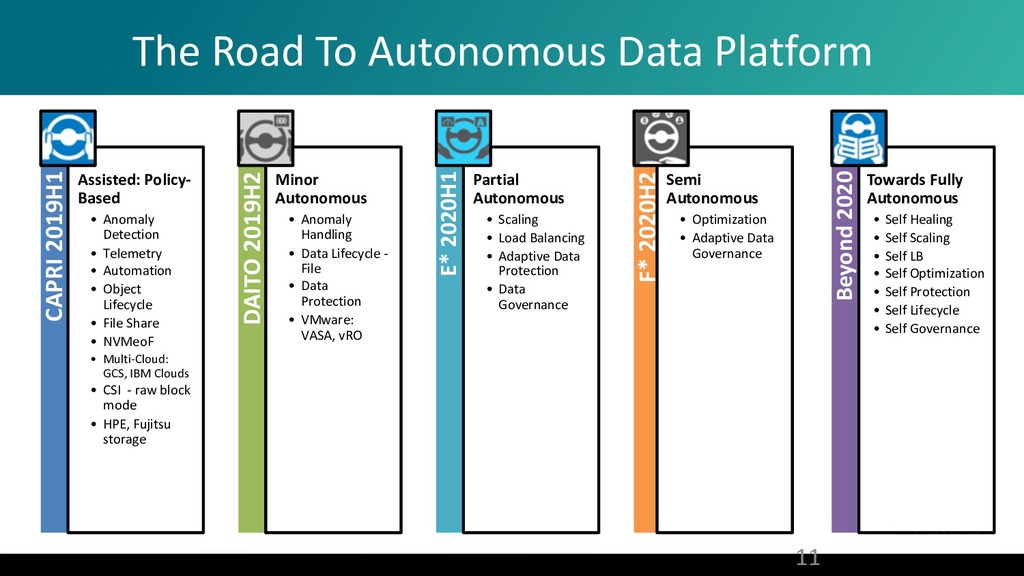
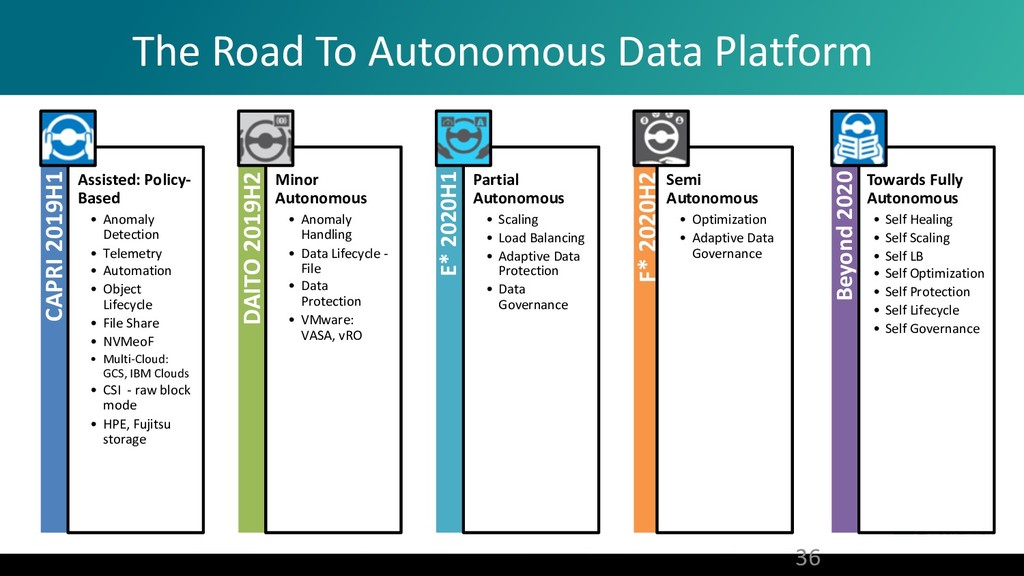
  10. The Road To Autonomous Data Platform 11 CAPRI 2019H1 Assisted:

    Policy- Based • Anomaly Detection • Telemetry • Automation • Object Lifecycle • File Share • NVMeoF • Multi-Cloud: GCS, IBM Clouds • CSI - raw block mode • HPE, Fujitsu storage DAITO 2019H2 Minor Autonomous • Anomaly Handling • Data Lifecycle - File • Data Protection • VMware: VASA, vRO E* 2020H1 Responsive Environment Aware Predictive Analytics/UL Partial Autonomous • Scaling • Load Balancing • Adaptive Data Protection • Data Governance F* 2020H2 Highly Autonomous Prescriptive Analytics/DL Semi Autonomous • Optimization • Adaptive Data Governance Beyond 2020 Towards Fully Autonomous • Self Healing • Self Scaling • Self LB • Self Optimization • Self Protection • Self Lifecycle • Self Governance
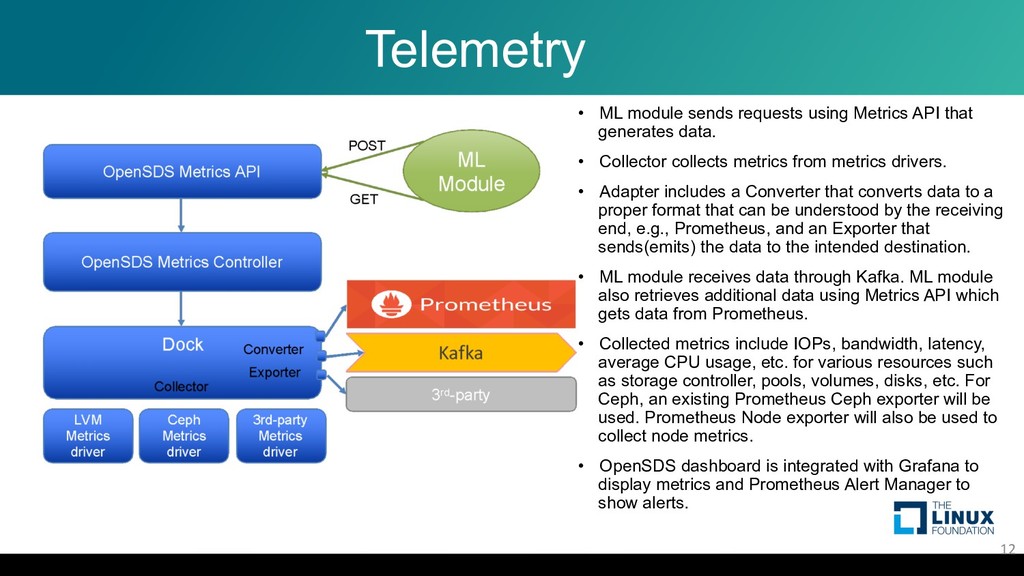
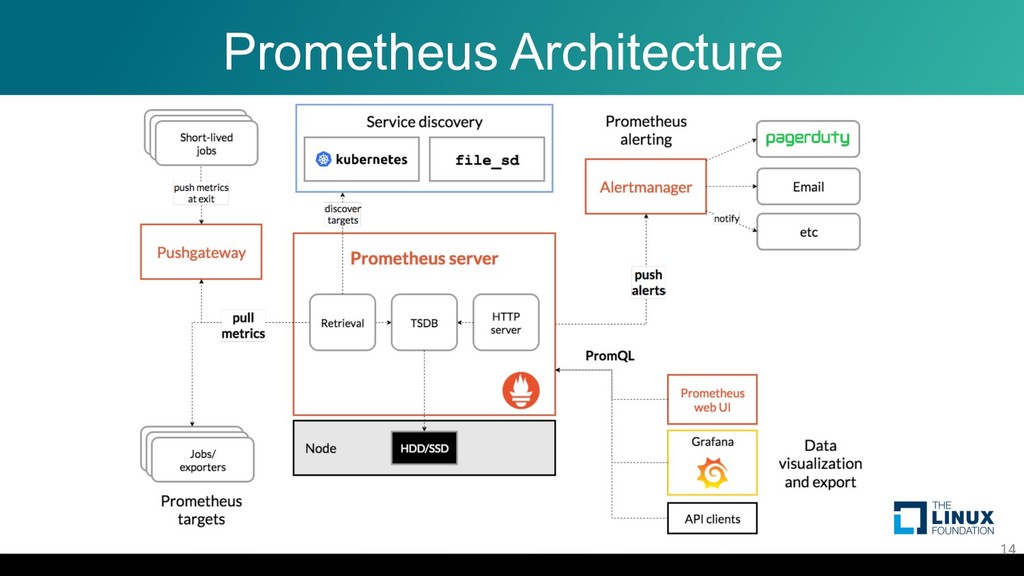
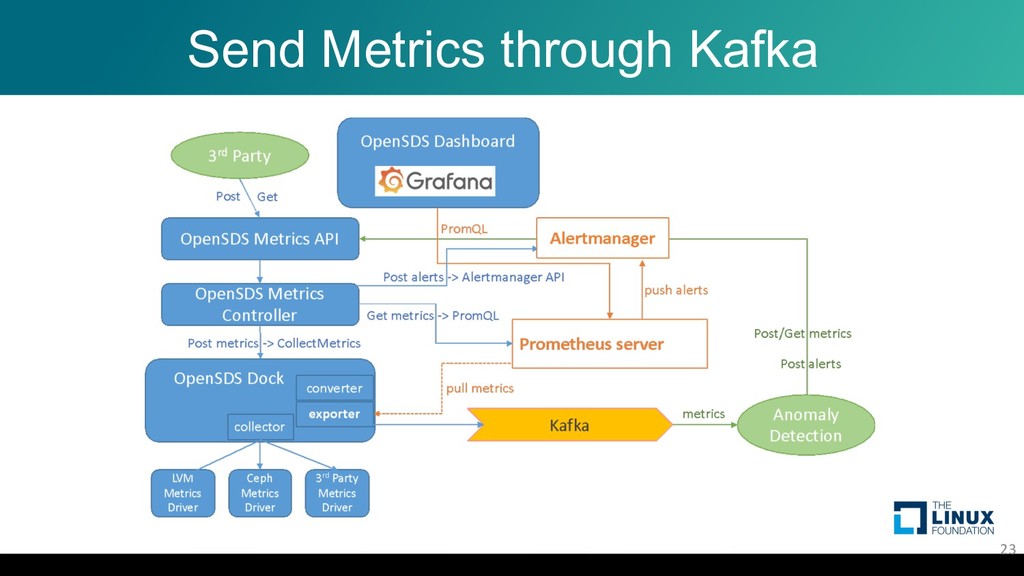
  11. Telemetry • ML module sends requests using Metrics API that

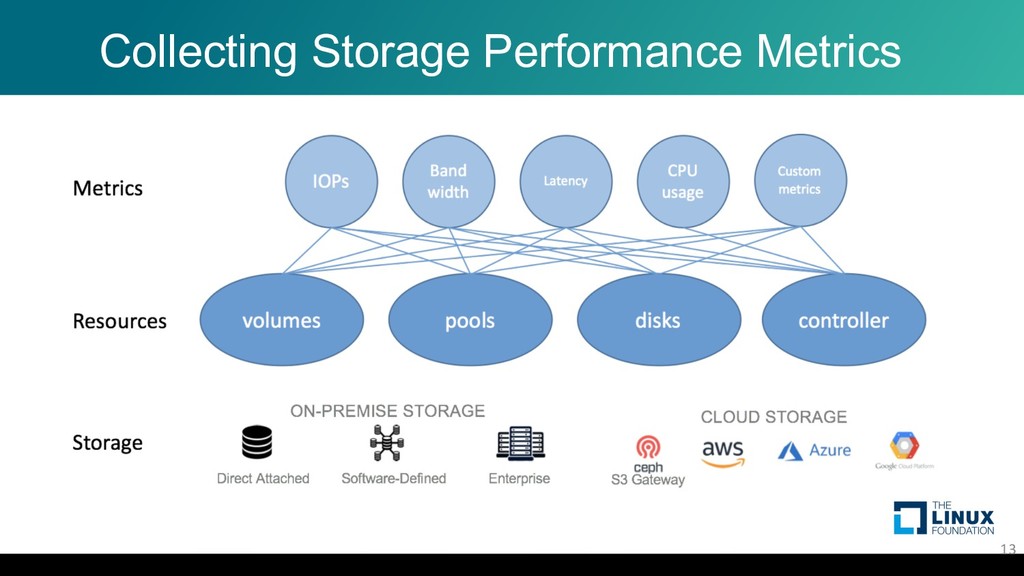
    generates data. • Collector collects metrics from metrics drivers. • Adapter includes a Converter that converts data to a proper format that can be understood by the receiving end, e.g., Prometheus, and an Exporter that sends(emits) the data to the intended destination. • ML module receives data through Kafka. ML module also retrieves additional data using Metrics API which gets data from Prometheus. • Collected metrics include IOPs, bandwidth, latency, average CPU usage, etc. for various resources such as storage controller, pools, volumes, disks, etc. For Ceph, an existing Prometheus Ceph exporter will be used. Prometheus Node exporter will also be used to collect node metrics. • OpenSDS dashboard is integrated with Grafana to display metrics and Prometheus Alert Manager to show alerts. 12
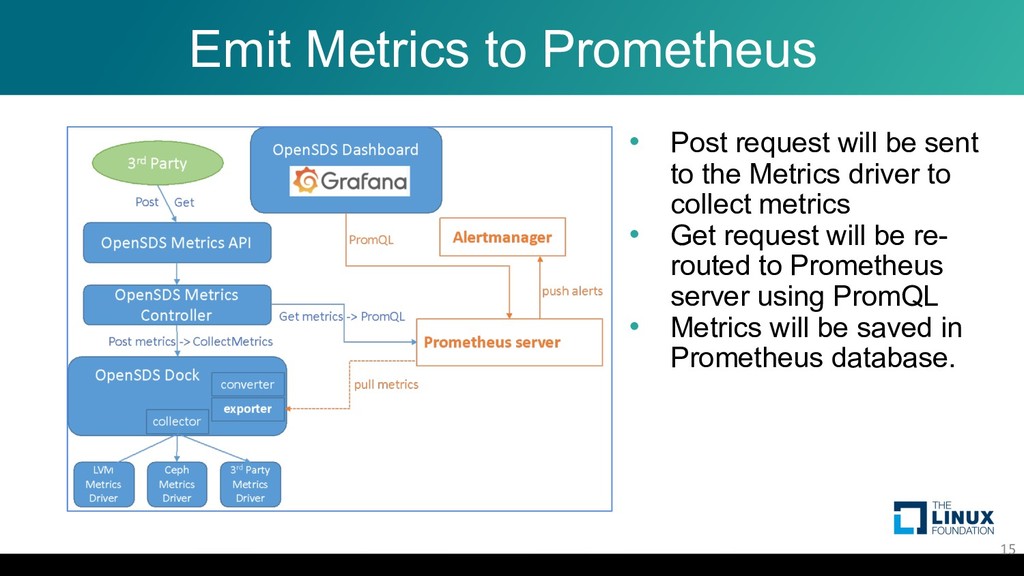
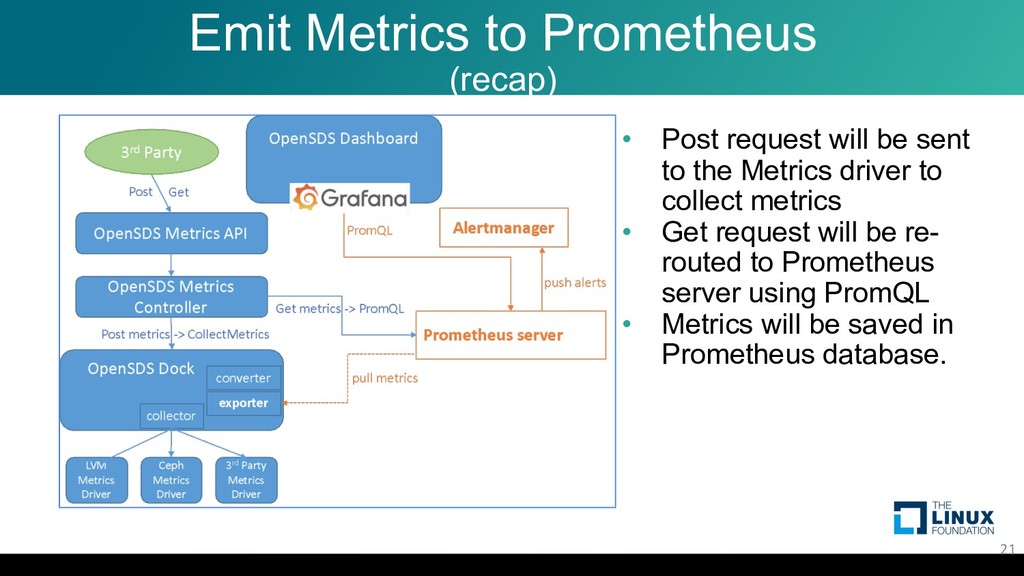
  12. Emit Metrics to Prometheus • Post request will be sent

    to the Metrics driver to collect metrics • Get request will be re- routed to Prometheus server using PromQL • Metrics will be saved in Prometheus database. 15
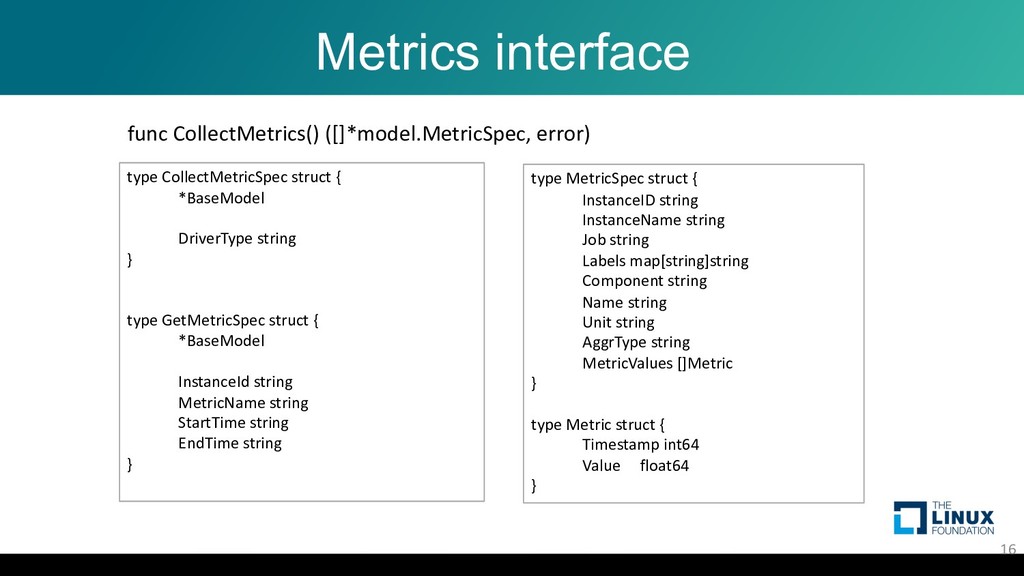
  13. Metrics interface 16 type MetricSpec struct { InstanceID string InstanceName

    string Job string Labels map[string]string Component string Name string Unit string AggrType string MetricValues []Metric } type Metric struct { Timestamp int64 Value float64 } type CollectMetricSpec struct { *BaseModel DriverType string } type GetMetricSpec struct { *BaseModel InstanceId string MetricName string StartTime string EndTime string } func CollectMetrics() ([]*model.MetricSpec, error)
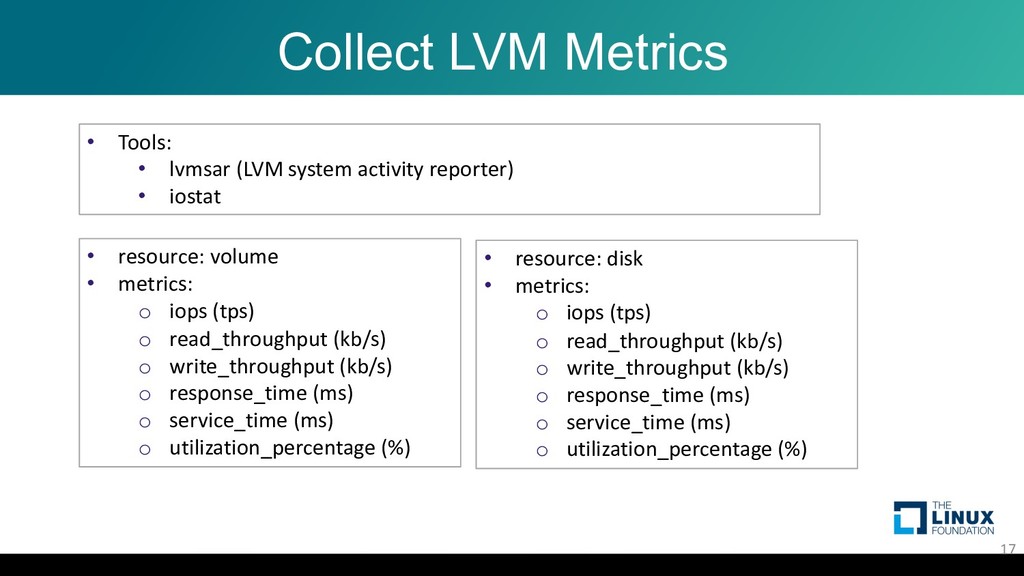
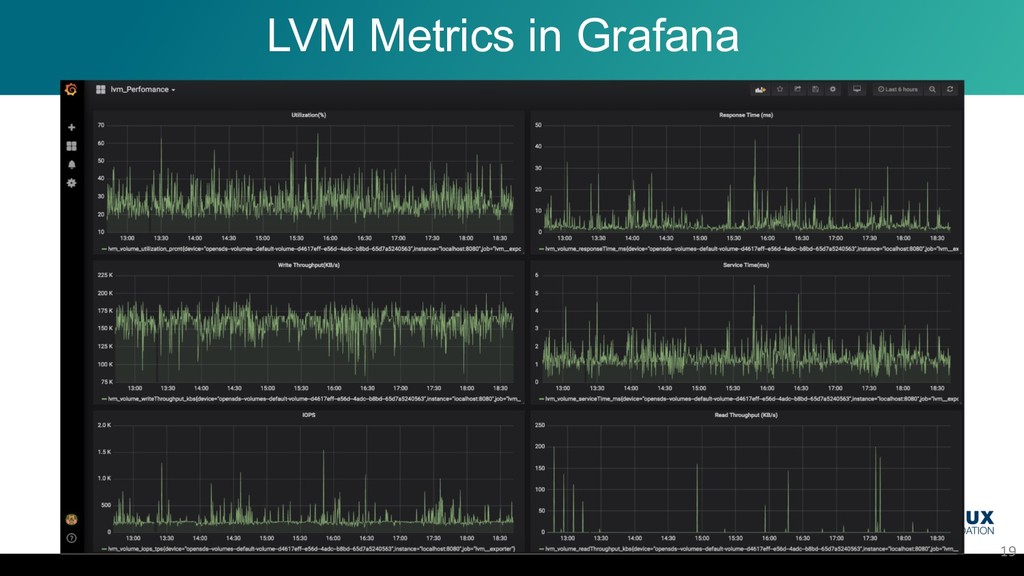
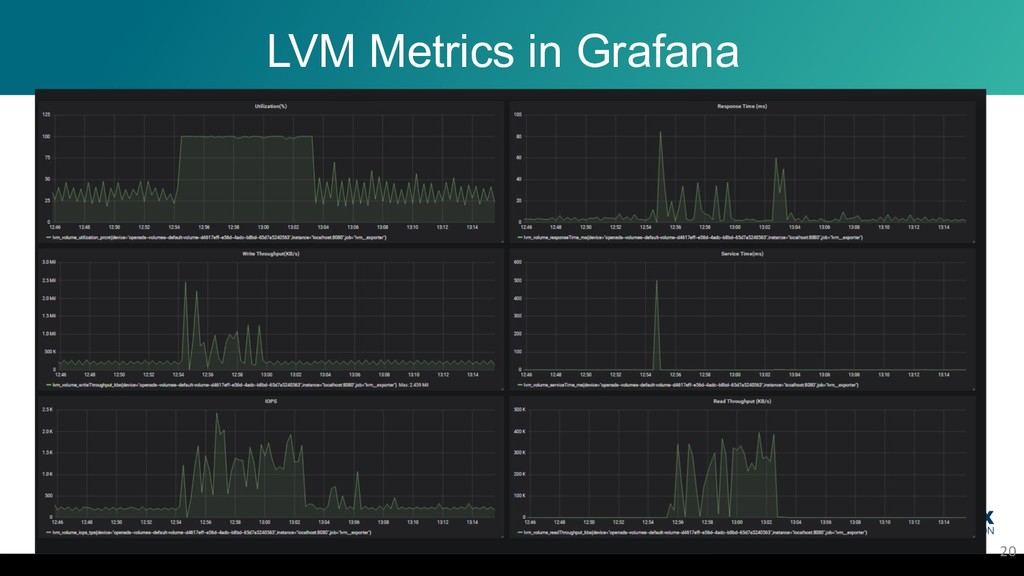
  14. Collect LVM Metrics Collect LVM Metrics 17 • resource: volume

    • metrics: o iops (tps) o read_throughput (kb/s) o write_throughput (kb/s) o response_time (ms) o service_time (ms) o utilization_percentage (%) • Tools: • lvmsar (LVM system activity reporter) • iostat • resource: disk • metrics: o iops (tps) o read_throughput (kb/s) o write_throughput (kb/s) o response_time (ms) o service_time (ms) o utilization_percentage (%)
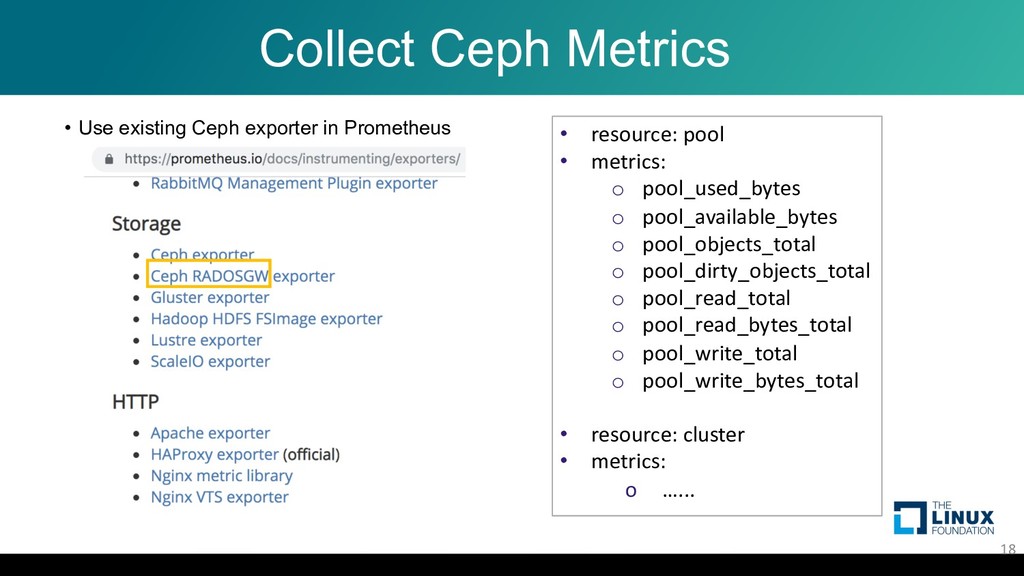
  15. • Use existing Ceph exporter in Prometheus 18 Collect Ceph

    Metrics • resource: pool • metrics: o pool_used_bytes o pool_available_bytes o pool_objects_total o pool_dirty_objects_total o pool_read_total o pool_read_bytes_total o pool_write_total o pool_write_bytes_total • resource: cluster • metrics: o …...
  16. Emit Metrics to Prometheus (recap) • Post request will be

    sent to the Metrics driver to collect metrics • Get request will be re- routed to Prometheus server using PromQL • Metrics will be saved in Prometheus database. 21
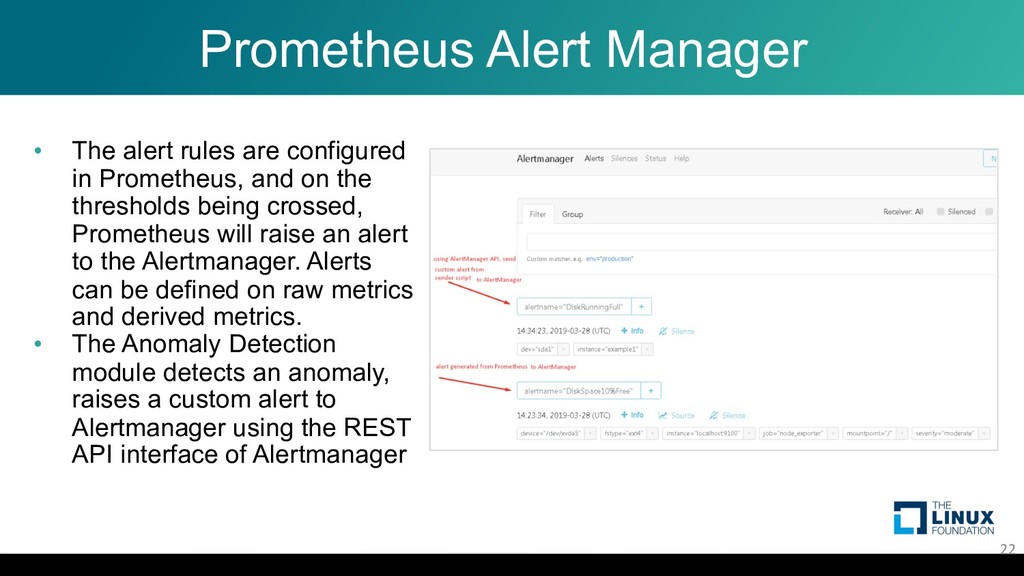
  17. Prometheus Alert Manager • The alert rules are configured in

    Prometheus, and on the thresholds being crossed, Prometheus will raise an alert to the Alertmanager. Alerts can be defined on raw metrics and derived metrics. • The Anomaly Detection module detects an anomaly, raises a custom alert to Alertmanager using the REST API interface of Alertmanager 22
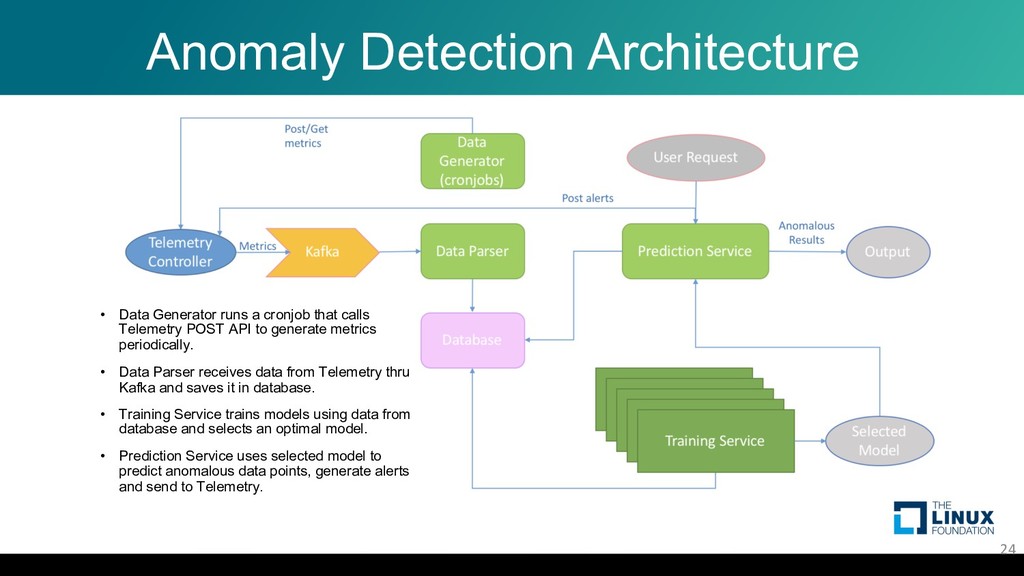
  18. Anomaly Detection Architecture 24 • Data Generator runs a cronjob

    that calls Telemetry POST API to generate metrics periodically. • Data Parser receives data from Telemetry thru Kafka and saves it in database. • Training Service trains models using data from database and selects an optimal model. • Prediction Service uses selected model to predict anomalous data points, generate alerts and send to Telemetry.
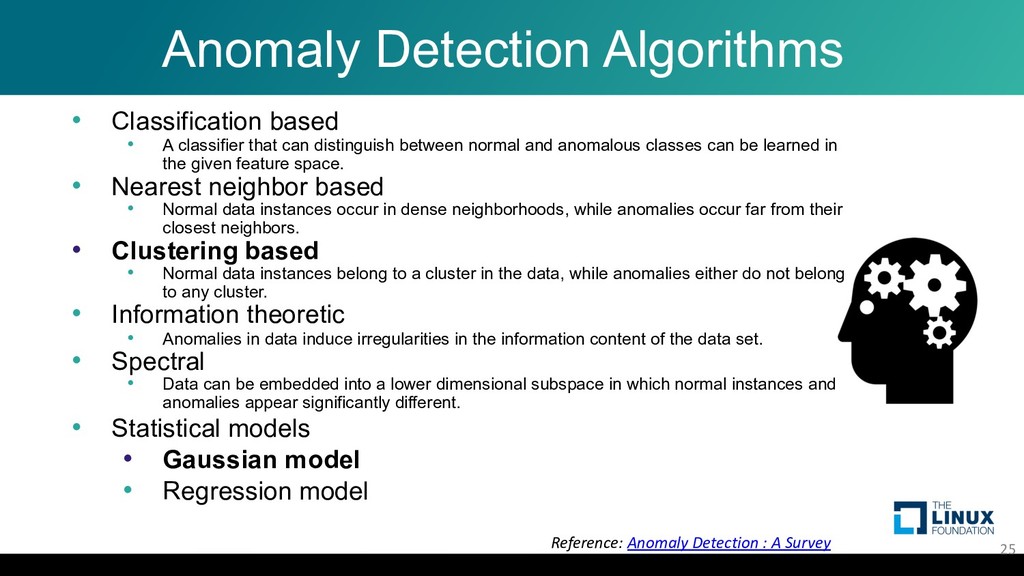
  19. Anomaly Detection Algorithms • Classification based • A classifier that

    can distinguish between normal and anomalous classes can be learned in the given feature space. • Nearest neighbor based • Normal data instances occur in dense neighborhoods, while anomalies occur far from their closest neighbors. • Clustering based • Normal data instances belong to a cluster in the data, while anomalies either do not belong to any cluster. • Information theoretic • Anomalies in data induce irregularities in the information content of the data set. • Spectral • Data can be embedded into a lower dimensional subspace in which normal instances and anomalies appear significantly different. • Statistical models • Gaussian model • Regression model 25 Reference: Anomaly Detection : A Survey
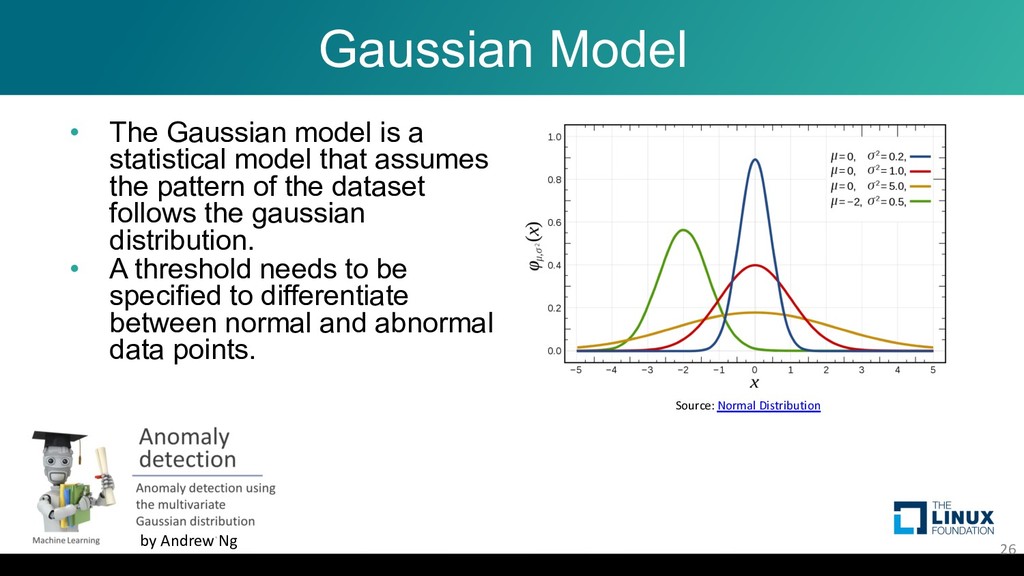
  20. Gaussian Model • The Gaussian model is a statistical model

    that assumes the pattern of the dataset follows the gaussian distribution. • A threshold needs to be specified to differentiate between normal and abnormal data points. 26 by Andrew Ng Source: Normal Distribution
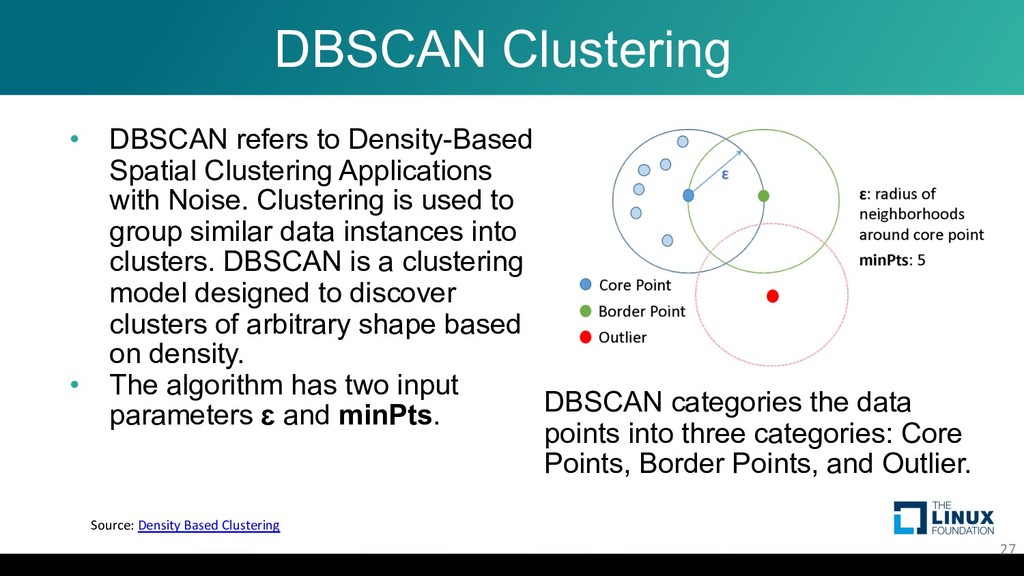
  21. DBSCAN Clustering • DBSCAN refers to Density-Based Spatial Clustering Applications

    with Noise. Clustering is used to group similar data instances into clusters. DBSCAN is a clustering model designed to discover clusters of arbitrary shape based on density. • The algorithm has two input parameters ɛ and minPts. 27 DBSCAN categories the data points into three categories: Core Points, Border Points, and Outlier. Source: Density Based Clustering
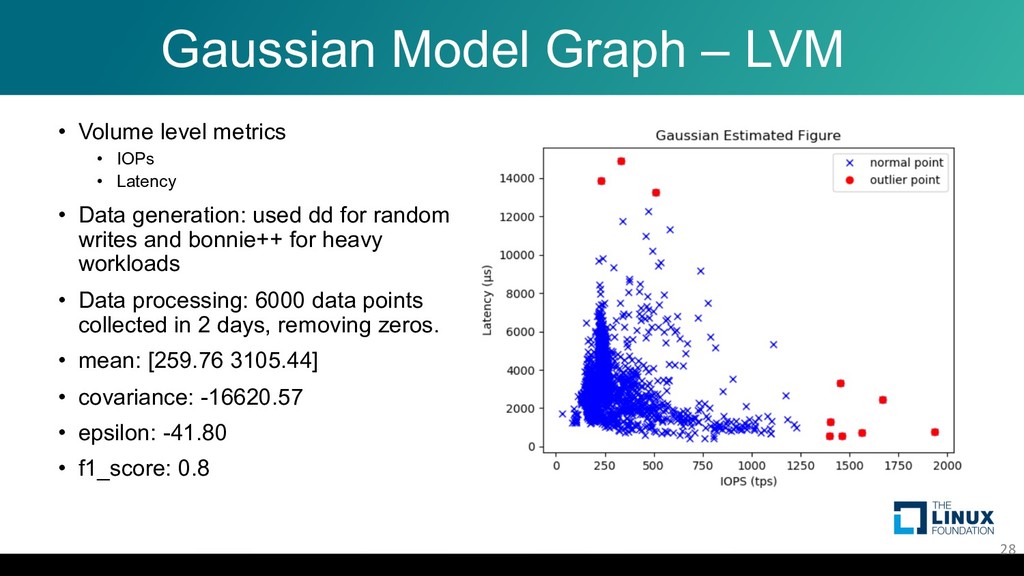
  22. Gaussian Model Graph – LVM • Volume level metrics •

    IOPs • Latency • Data generation: used dd for random writes and bonnie++ for heavy workloads • Data processing: 6000 data points collected in 2 days, removing zeros. • mean: [259.76 3105.44] • covariance: -16620.57 • epsilon: -41.80 • f1_score: 0.8 28
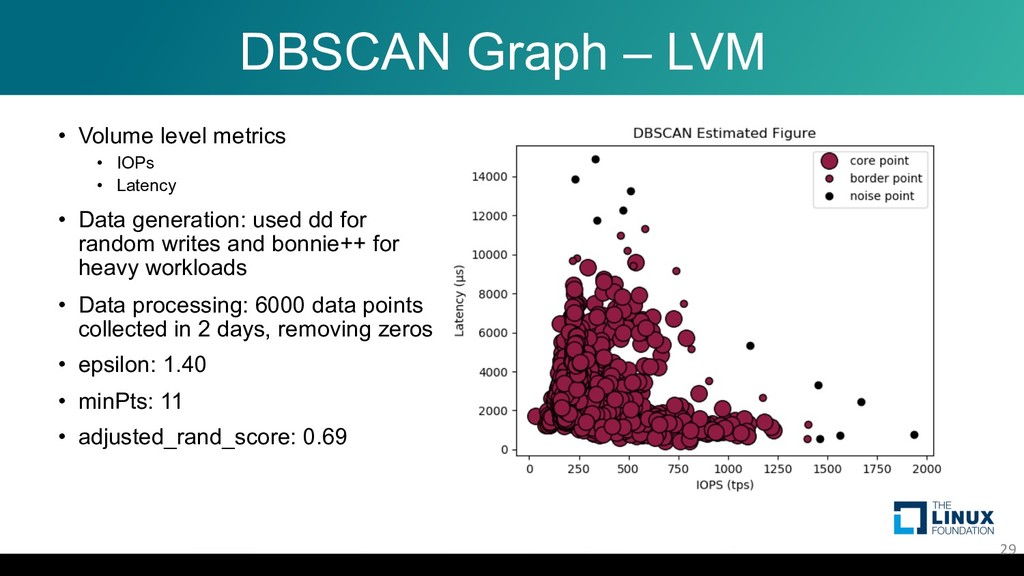
  23. DBSCAN Graph – LVM • Volume level metrics • IOPs

    • Latency • Data generation: used dd for random writes and bonnie++ for heavy workloads • Data processing: 6000 data points collected in 2 days, removing zeros • epsilon: 1.40 • minPts: 11 • adjusted_rand_score: 0.69 29
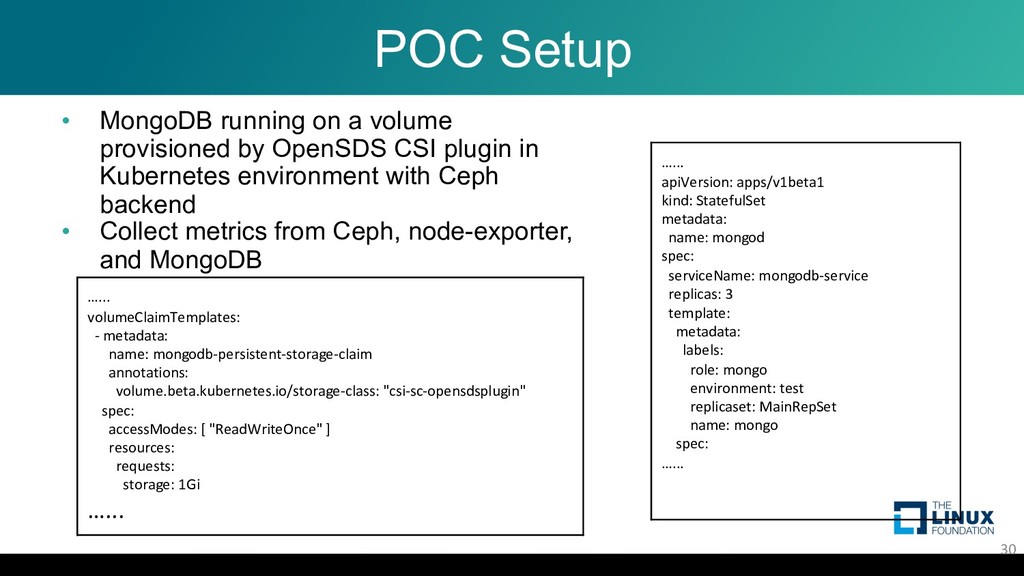
  24. POC Setup • MongoDB running on a volume provisioned by

    OpenSDS CSI plugin in Kubernetes environment with Ceph backend • Collect metrics from Ceph, node-exporter, and MongoDB 30 …... apiVersion: apps/v1beta1 kind: StatefulSet metadata: name: mongod spec: serviceName: mongodb-service replicas: 3 template: metadata: labels: role: mongo environment: test replicaset: MainRepSet name: mongo spec: …... …... volumeClaimTemplates: - metadata: name: mongodb-persistent-storage-claim annotations: volume.beta.kubernetes.io/storage-class: "csi-sc-opensdsplugin" spec: accessModes: [ "ReadWriteOnce" ] resources: requests: storage: 1Gi …...
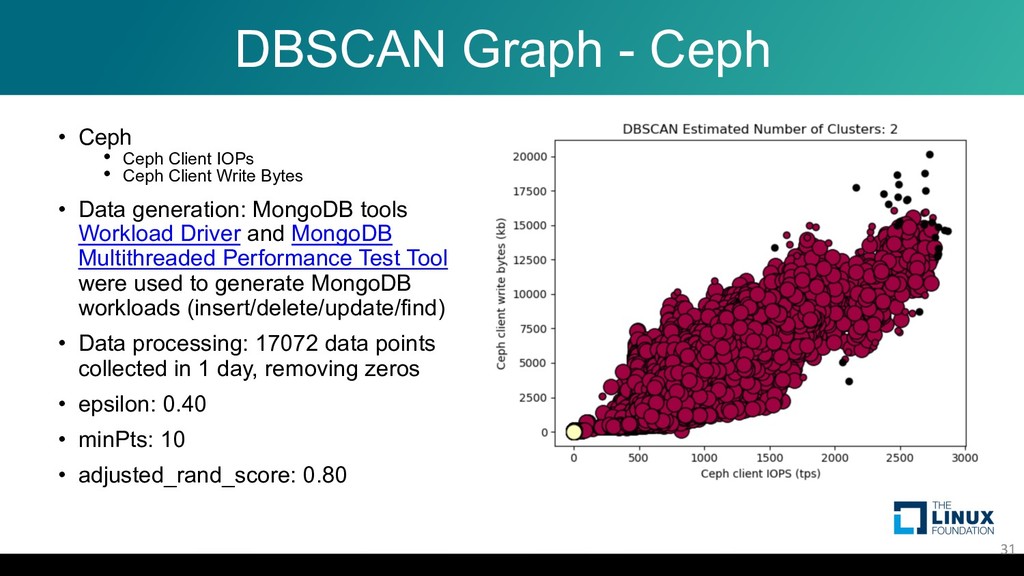
  25. DBSCAN Graph - Ceph • Ceph • Ceph Client IOPs

    • Ceph Client Write Bytes • Data generation: MongoDB tools Workload Driver and MongoDB Multithreaded Performance Test Tool were used to generate MongoDB workloads (insert/delete/update/find) • Data processing: 17072 data points collected in 1 day, removing zeros • epsilon: 0.40 • minPts: 10 • adjusted_rand_score: 0.80 31
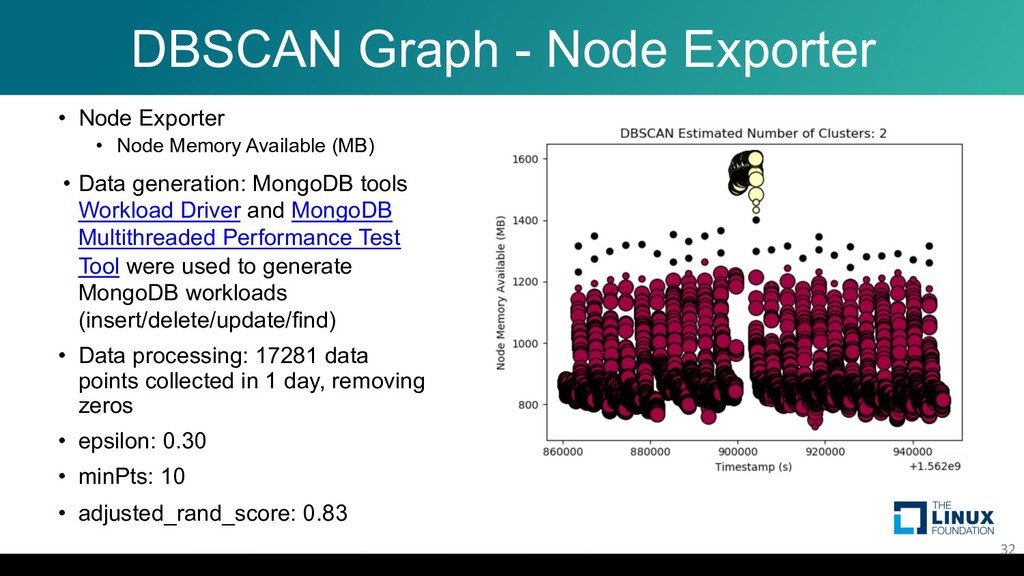
  26. DBSCAN Graph - Node Exporter • Node Exporter • Node

    Memory Available (MB) • Data generation: MongoDB tools Workload Driver and MongoDB Multithreaded Performance Test Tool were used to generate MongoDB workloads (insert/delete/update/find) • Data processing: 17281 data points collected in 1 day, removing zeros • epsilon: 0.30 • minPts: 10 • adjusted_rand_score: 0.83 32
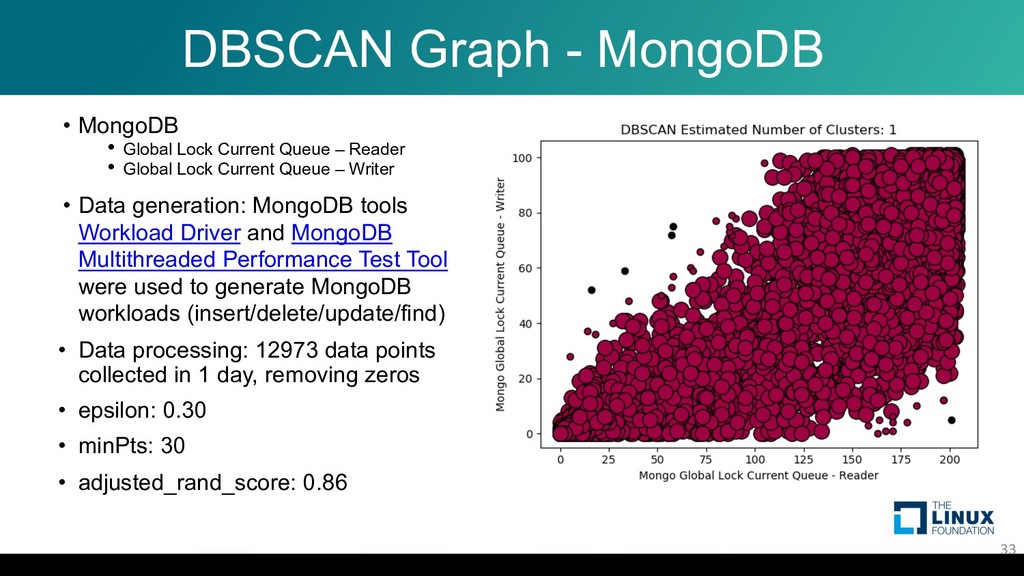
  27. DBSCAN Graph - MongoDB • MongoDB • Global Lock Current

    Queue – Reader • Global Lock Current Queue – Writer • Data generation: MongoDB tools Workload Driver and MongoDB Multithreaded Performance Test Tool were used to generate MongoDB workloads (insert/delete/update/find) • Data processing: 12973 data points collected in 1 day, removing zeros • epsilon: 0.30 • minPts: 30 • adjusted_rand_score: 0.86 33
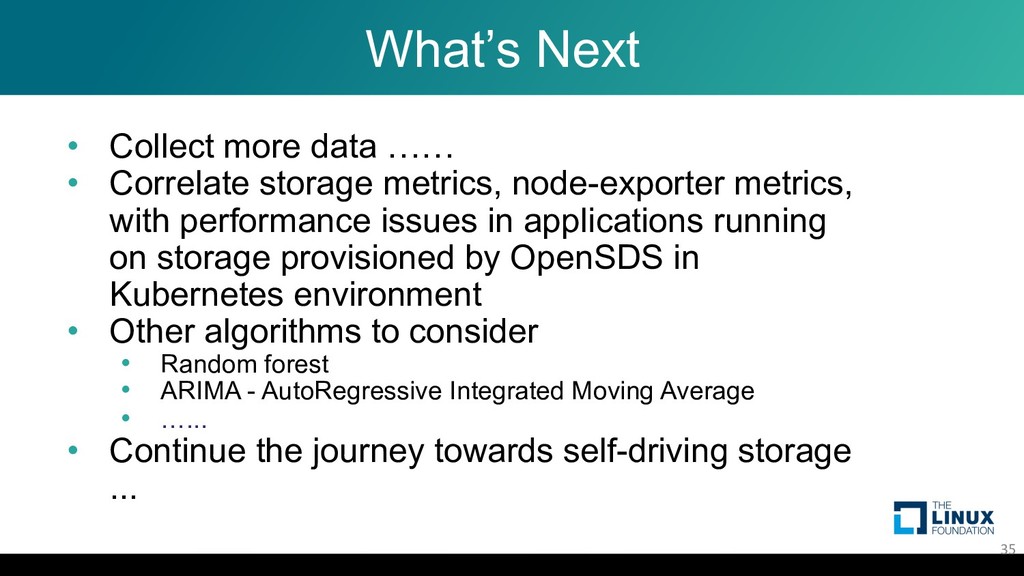
  28. What’s Next • Collect more data …… • Correlate storage

    metrics, node-exporter metrics, with performance issues in applications running on storage provisioned by OpenSDS in Kubernetes environment • Other algorithms to consider • Random forest • ARIMA - AutoRegressive Integrated Moving Average • …... • Continue the journey towards self-driving storage ... 35
  29. The Road To Autonomous Data Platform 36 CAPRI 2019H1 Assisted:

    Policy- Based • Anomaly Detection • Telemetry • Automation • Object Lifecycle • File Share • NVMeoF • Multi-Cloud: GCS, IBM Clouds • CSI - raw block mode • HPE, Fujitsu storage DAITO 2019H2 Minor Autonomous • Anomaly Handling • Data Lifecycle - File • Data Protection • VMware: VASA, vRO E* 2020H1 Responsive Environment Aware Predictive Analytics/UL Partial Autonomous • Scaling • Load Balancing • Adaptive Data Protection • Data Governance F* 2020H2 Highly Autonomous Prescriptive Analytics/DL Semi Autonomous • Optimization • Adaptive Data Governance Beyond 2020 Towards Fully Autonomous • Self Healing • Self Scaling • Self LB • Self Optimization • Self Protection • Self Lifecycle • Self Governance