A brief of Business Intelligence that enables you to access and analyze information so you can improve and optimize your business decision and performance.
precludes a complete search for the best answer. 01 The problem exists in a time-changing environment. 02 The problem is heavily constrained 03 There are many (possibly conflicting) objectives 04
To the extent you can eliminate both and replace them with data, you gain a clear advantage” Michael Lewis, Moneyball: The Art of Winning an Unfair Game
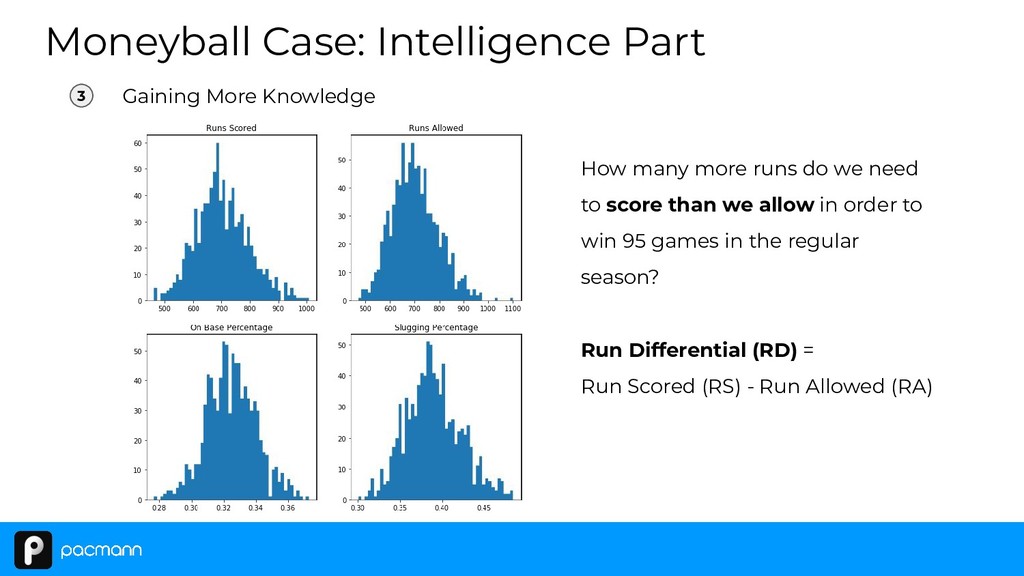
run differential of +133? The OOBP and OSLG for the A's in 2001 were: • OOBP = 0.315 • OSLG = 0.384 So the estimated RA ≈ 662 The actual value of runs allowed in the 2002 season was 654. Moneyball Case: Intelligence Part 5 Optimal Decision Support
and OSLG do we need to achieve a run differential of +133? The OBP and SLG for the A's in 2001 were: • OBP = 0.339 • SLG = 0.432 So the RA ≈ 808 The actual value of runs scored in the 2002 season was 800.
of theories, methodologies, architectures, and technologies that transform raw data into meaningful and useful information for business purposes. 3 2 1 Lots and lots of data 01 Processing and Aggregation 02 Insight & Visualization 03
What Happened? Why did it happened? What will happen? How can we make it happen? Early Stage of company Amount of data Analytics & Company Maturity Seed Growth Beyond
obvious things based on your opinion might be a fallacy. • The first person you can be easily fooled is yourself. • In order to falsify your opinion or belief, you can gather data and compare it as a source of “truth”. Getting Your First Data: Case
triumph and built to support a customer base of millions. No one asked the customer if they wanted it. Cost $5 billion. Yes, billion. Satellites are awfully expensive. Getting Your First Data: Case
smokeless cigarettes. Understood what the general public (nonsmokers) wanted, but did not understand that their customers didn’t care. Cost: $450 million Getting Your First Data: Case
their sales. Q: But How? Let’s do a FGD. Focus Group Discussion Person 1: I like the aluminium tube. The toothpaste smells nice. Person 2: The price is affordable. I can easily squeeze the aluminium tube. Person 3: It taste good. My child might eat it. Getting Your First Data: Case
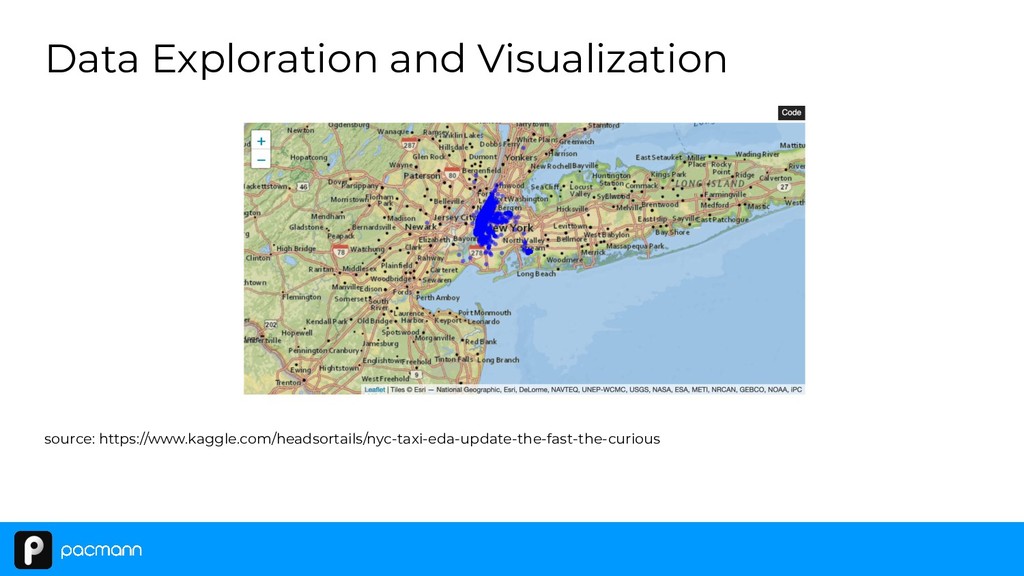
want to understand your user behavior, gain insight from your data. • You want to find patterns in your data. • These patterns can be used to form hypothesis on how to optimize our objectives. Data Exploration and Visualization
you to build a model that predicts the total ride duration of taxi trips in New York City. Your primary dataset is one released by the NYC Taxi and Limousine Commission, which includes pickup time, geo-coordinates, number of passengers, and several other variables.
It” heuristics: Understand your problem. • Ask questions! ◦ What are you asked to find or show? ◦ Can you think of a diagram that might help you understand the problem? ◦ Is there enough information to enable you to find a solution? ◦ Do you understand all the data used in this problem? • Do visualizations! Data Exploration and Visualization
the behavior of our users. These understanding can be formed into hypothesis, and we can test those hypothesis to optimize our decision/objectives. Data Exploration and Visualization
things we measure. • I will follow Judea Pearl hypothesis making mechanism. • We will represent hypothesis as “How to Solve It” heuristics mechanism to find a good set of hypothesis. Hypothesis
you to build a model that predicts the total ride duration of taxi trips in New York City. Your primary dataset is one released by the NYC Taxi and Limousine Commission, which includes pickup time, geo-coordinates, number of passengers, and several other variables.
a quantitative indication of the extent, amount, dimension, capacity, or size of some attribute of a product or process (Pressman, 2000) Metrics is a quantitative measure of the degree to which a system, component, or process possesses a given attribute. (IEEE, 1990)
methodology produces a faster result than another - Identify hot leads - Improve marketing campaign effectiveness - Determine which marketing campaigns lead to the most profitable customers - Discover which features are getting the most/least use - Reveal technical problems which are hindering your service
You probably don’t have a product market fit. - Revise and build a better product. - Your churn rate is a big problem. - You have a loyal customer. - The parallel line of retention with X axis show it converge to a number. - Don’t make yourself biased - 20% of retention, in airlines market, in Indonesia, in daily churn might be big number. People probably only use airplane 2 times a year on average.
You probably have a product market fit. - Your churn rate is not a big problem. - You have a loyal customer. - The parallel line of retention with X axis show it converge to a number. - Don’t make yourself biased - 95% retention of Nasi Goreng, in NY, 100 people is a small market.
Marketing might help you in the short run, but the retention will converge to its natural rate when the marketing campaign gone. - Yes, it can prolong your product life cycle. (and suffering) - Still, the time you buy with marketing campaign need to be translated into a new better product, so the users might stay.
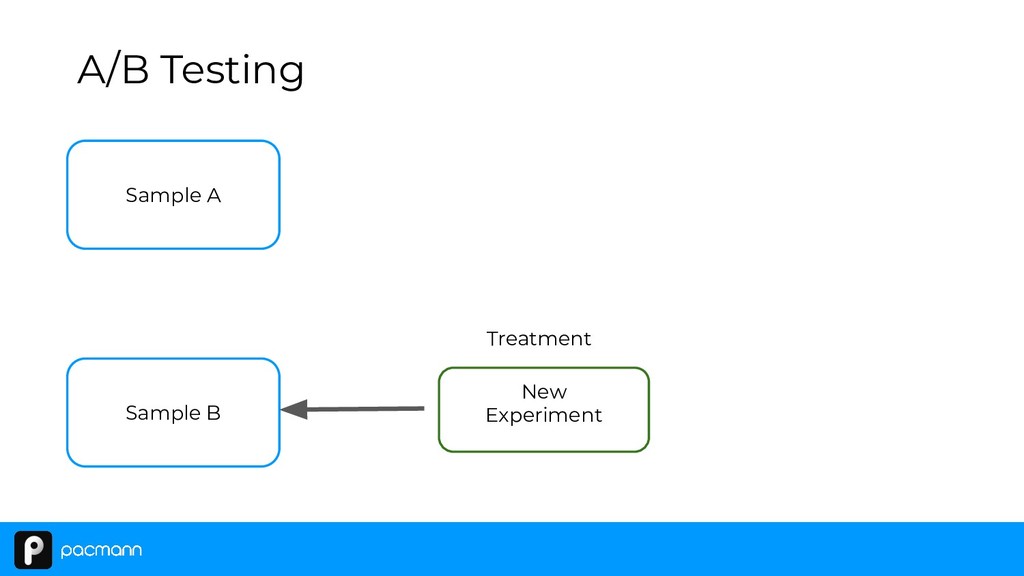
product/hypothesis/experiment on some business metrics. • If the effect is large enough, it can increase our metrics and achieve our business objectives. A/B Testing
controlled experiment / randomized trial for medical purposes • Scurvy is a disease that results from vitamin C deficiency • It killed over 100,000 people in the 16th-18th centuries, mostly sailors • Lord Anson’s circumnavigation voyage from 1740 to 1744 started with 1,800 sailors and only about 200 returned;most died from scurvy • Dr. James Lind noticed lack of scurvy in Mediterranean ships. • Gave some sailors limes (treatment), others ate regular diet (control)
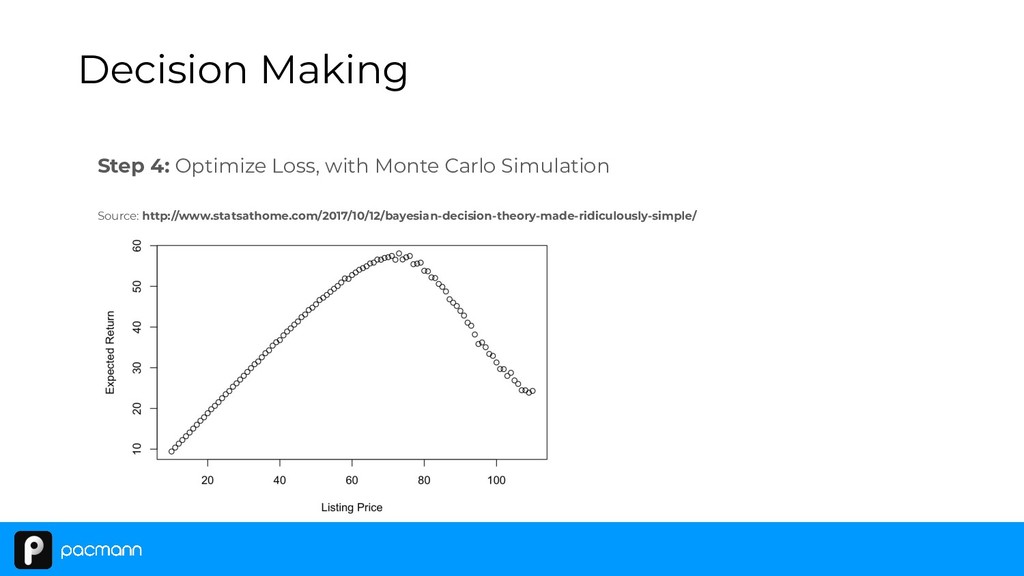
to optimize business metrics. How Step 1: Get data. Step 2: Define a loss function. Step 3: Build a model with a tunable parameter. Step 4: Optimize the loss function given a range of parameter values. Step 5: Choose the best parameter. Decision Making
at which to list a used phone I want to sell. In this case I may denote my decision space as the entire positive real line such that a∈[0,+∞) . Decision Making
out the loss associated with individual decisions when we don’t even know the information we want to use to make a decision? The answer is that we turn to probability theory and instead calculate the “Expected Loss” we would feel if we choose a given action given our beliefs (our probability distribution) about θ Decision Making
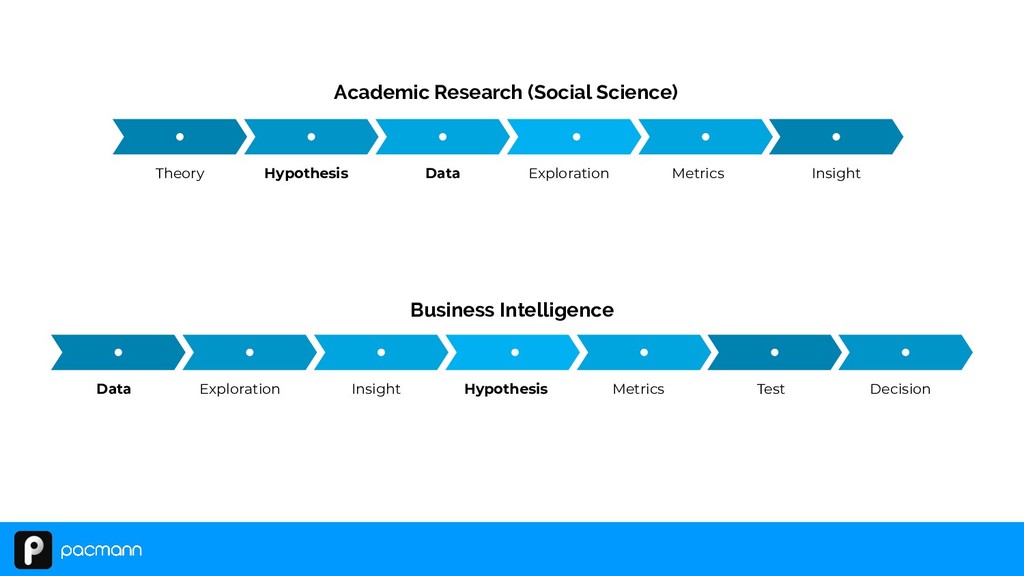
Build a prototype 4. Test the prototype to users Customer Development Cycle Product Hypothesis: Do they need a checkins-photo?? Data Exploration Insight Hypothesis Metrics Test Decision
Build a prototype 4. Test the prototype to users Customer Development Cycle Market Hypothesis: Do we need to focus on photo only? Data Exploration Insight Hypothesis Metrics Test Decision
Build a prototype 4. Test the prototype to users Customer Development Cycle Feature Question: What kind of feature do they want to make the users use our product? Data Exploration Insight Hypothesis Metrics Test Decision
Build a prototype 4. Test the prototype to users Customer Development Cycle Marketing Question: Do we need to rebrand our app? Data Exploration Insight Hypothesis Metrics Test Decision
![EOP Contact: [email protected]](https://files.speakerdeck.com/presentations/817e5b52d4754cd0ae3b67cb861b0add/slide_115.jpg)
![We believe everyone can be Data Scientist Contact: [email protected]](https://files.speakerdeck.com/presentations/817e5b52d4754cd0ae3b67cb861b0add/slide_116.jpg)
![Upcoming ML & BI Class Contact: [email protected]](https://files.speakerdeck.com/presentations/817e5b52d4754cd0ae3b67cb861b0add/slide_117.jpg)
![Check our website: www.pacmann.ai Contact: [email protected]](https://files.speakerdeck.com/presentations/817e5b52d4754cd0ae3b67cb861b0add/slide_119.jpg)
![Check our website: www.pacmann.ai Contact: [email protected]](https://files.speakerdeck.com/presentations/817e5b52d4754cd0ae3b67cb861b0add/slide_120.jpg)
![Check our website: www.pacmann.ai Contact: [email protected]](https://files.speakerdeck.com/presentations/817e5b52d4754cd0ae3b67cb861b0add/slide_121.jpg)
![Past Classes Contact: [email protected]](https://files.speakerdeck.com/presentations/817e5b52d4754cd0ae3b67cb861b0add/slide_122.jpg)
![60 participants 1 week 28 institutions [email protected] https://pacmann.ai Previous Classes](https://files.speakerdeck.com/presentations/817e5b52d4754cd0ae3b67cb861b0add/slide_124.jpg)
![Previous Classes [email protected] https://pacmann.ai 96 participants 2 weeks 51 institutions](https://files.speakerdeck.com/presentations/817e5b52d4754cd0ae3b67cb861b0add/slide_125.jpg)
![Previous Classes [email protected] https://pacmann.ai 61 participants 8 weeks 48 institutions](https://files.speakerdeck.com/presentations/817e5b52d4754cd0ae3b67cb861b0add/slide_126.jpg)
![Previous Classes [email protected] https://pacmann.ai 59 participants 8 weeks 48 institutions](https://files.speakerdeck.com/presentations/817e5b52d4754cd0ae3b67cb861b0add/slide_127.jpg)
![Previous Classes [email protected] https://pacmann.ai 44 participants 2 weeks 33 institutions](https://files.speakerdeck.com/presentations/817e5b52d4754cd0ae3b67cb861b0add/slide_128.jpg)
![Previous Classes Facts & Figure [email protected] https://pacmann.ai Level of Education](https://files.speakerdeck.com/presentations/817e5b52d4754cd0ae3b67cb861b0add/slide_129.jpg)
![Previous Classes Facts & Figure [email protected] https://pacmann.ai Field of Work](https://files.speakerdeck.com/presentations/817e5b52d4754cd0ae3b67cb861b0add/slide_130.jpg)
![Previous Participants [email protected] https://pacmann.ai](https://files.speakerdeck.com/presentations/817e5b52d4754cd0ae3b67cb861b0add/slide_131.jpg)
![Contact Email: [email protected] Whatsapp Business: +62 812-8122-1707](https://files.speakerdeck.com/presentations/817e5b52d4754cd0ae3b67cb861b0add/slide_132.jpg)