Upgrade to Pro — share decks privately, control downloads, hide ads and more …

Enable effective Observability with Python

Enable effective Observability with Python

This is the slide deck used for my talk @ GITEX Global 2023 (Dubai)

ernestoarbitrio

November 02, 2023
Tweet

More Decks by ernestoarbitrio

Other Decks in Programming

Transcript

  1. 🤓 Who am I Senior Software Engineer at Crunch.io/ YouGov.

    Python passionate. Python Italia Vicepresident. I do love cooking and eating 🍷 🍝 🥩
  2. Everything is based on events -Logging: recording events -Metrics: data

    combined from measuring events -Tracing: recording events with casual ordering Credit: codahale
  3. Everything is based on events -Log: single events (response time)

    -Metric: aggregated data (response time) -Trace: detailed tree (response time)
  4. Logs show response time 10.100.5.3 - - [23/Feb/2018:10:27:30 +0530] GET

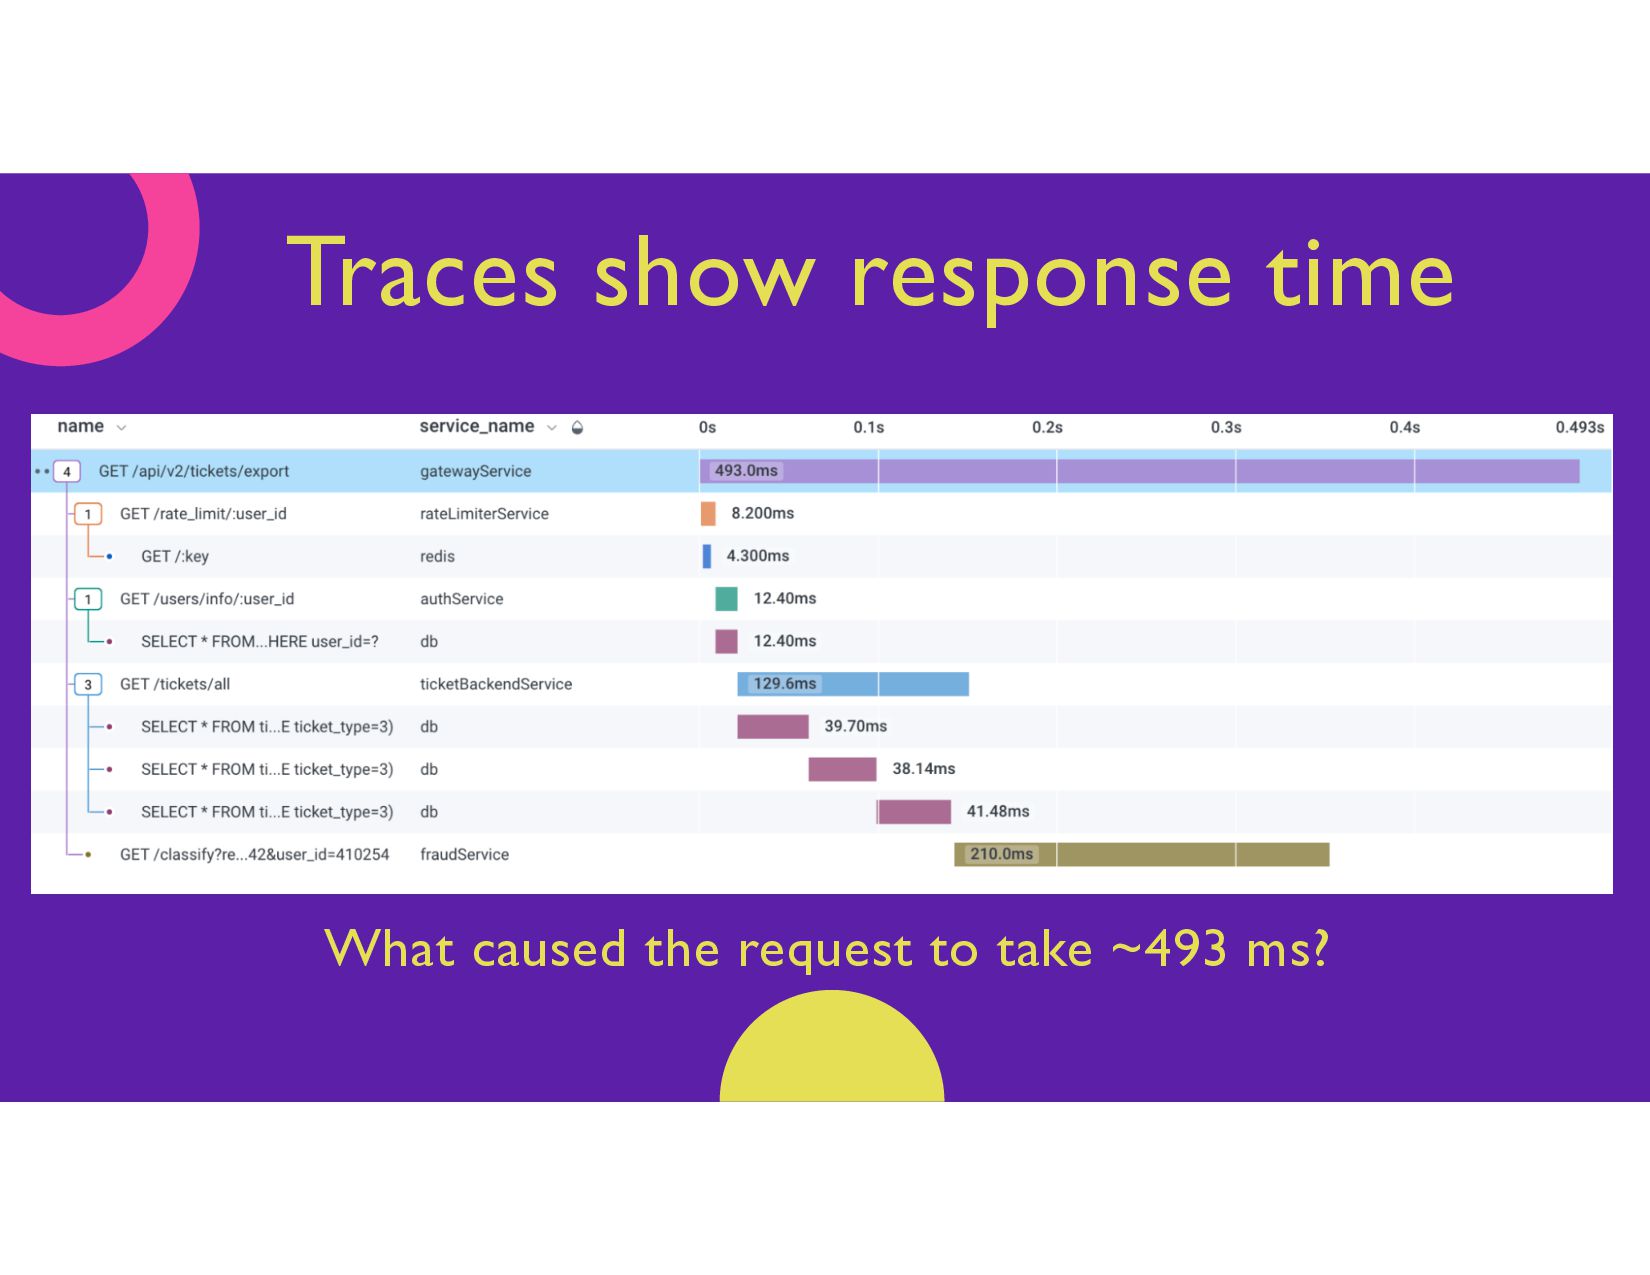
    /store/ HTTP/1.1 200 6406 - Mozilla/5.0 (Macintosh; Intel Mac OS X 10_12_5) AppleWebKit/537.36 (KHTML, like Gecko) Chrome/64.0.3282.167 Safari/537.36 493ms This request took 493ms!
  5. Metrics show response time Is 493ms slow? How fast were

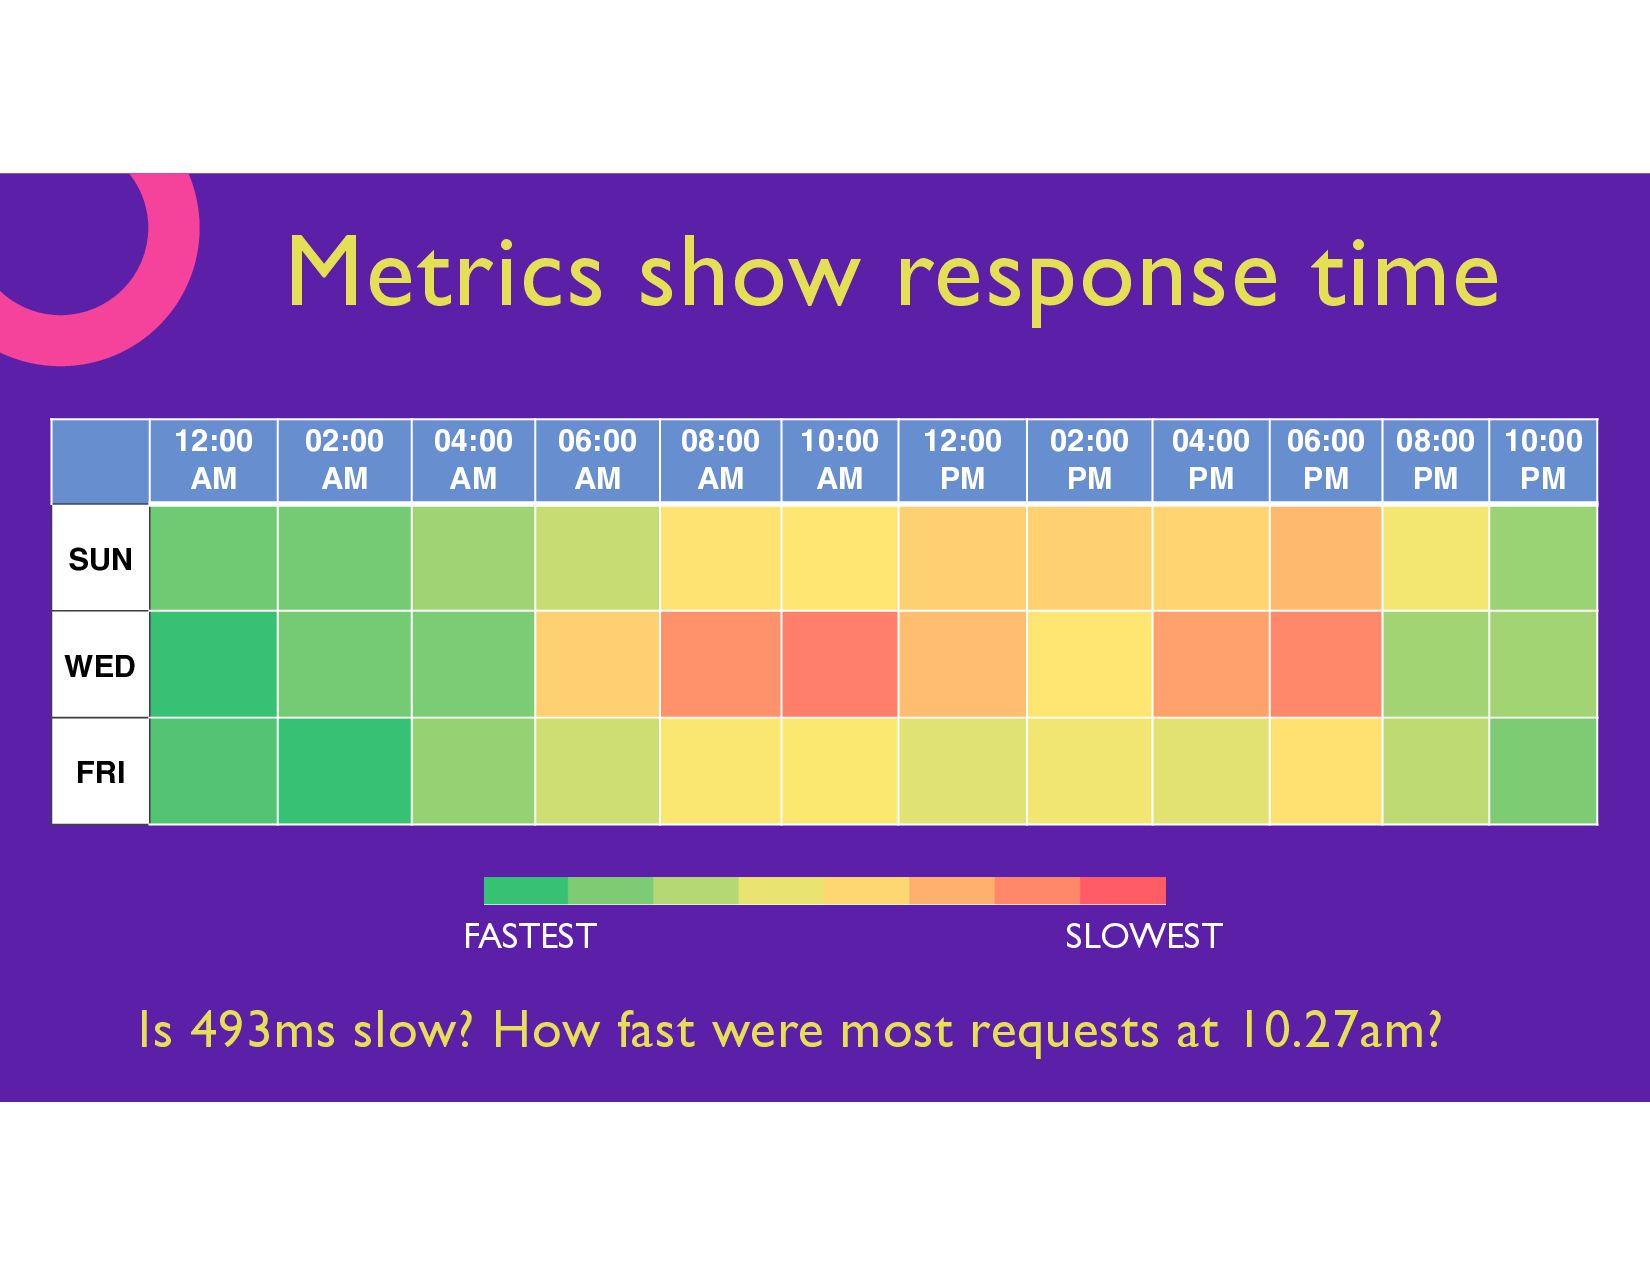
    most requests at 10.27am? 12:00 AM 02:00 AM 04:00 AM 06:00 AM 08:00 AM 10:00 AM 12:00 PM 02:00 PM 04:00 PM 06:00 PM 08:00 PM 10:00 PM SUN WED FRI SLOWEST FASTEST
  6. Distributed tracing Store FE, ID:1, PID: none, start 8:30, end

    8:50 Catalog, ID: 2, PID: 1, start: 8:32, end: 8:40 Stock, ID: 3, PID: 2, s: 8:34, e: 8:36 Stock, ID: 4, PID: 2, s: 8:35, e: 8:37 Stock: ID: 5, PID: 2, s: 8:36, e: 8:38 Auth, ID: 6, PID: 1, start: 8:40, end: 8:47
  7. Sampling Traces that finish with no issues Statistically representative sample

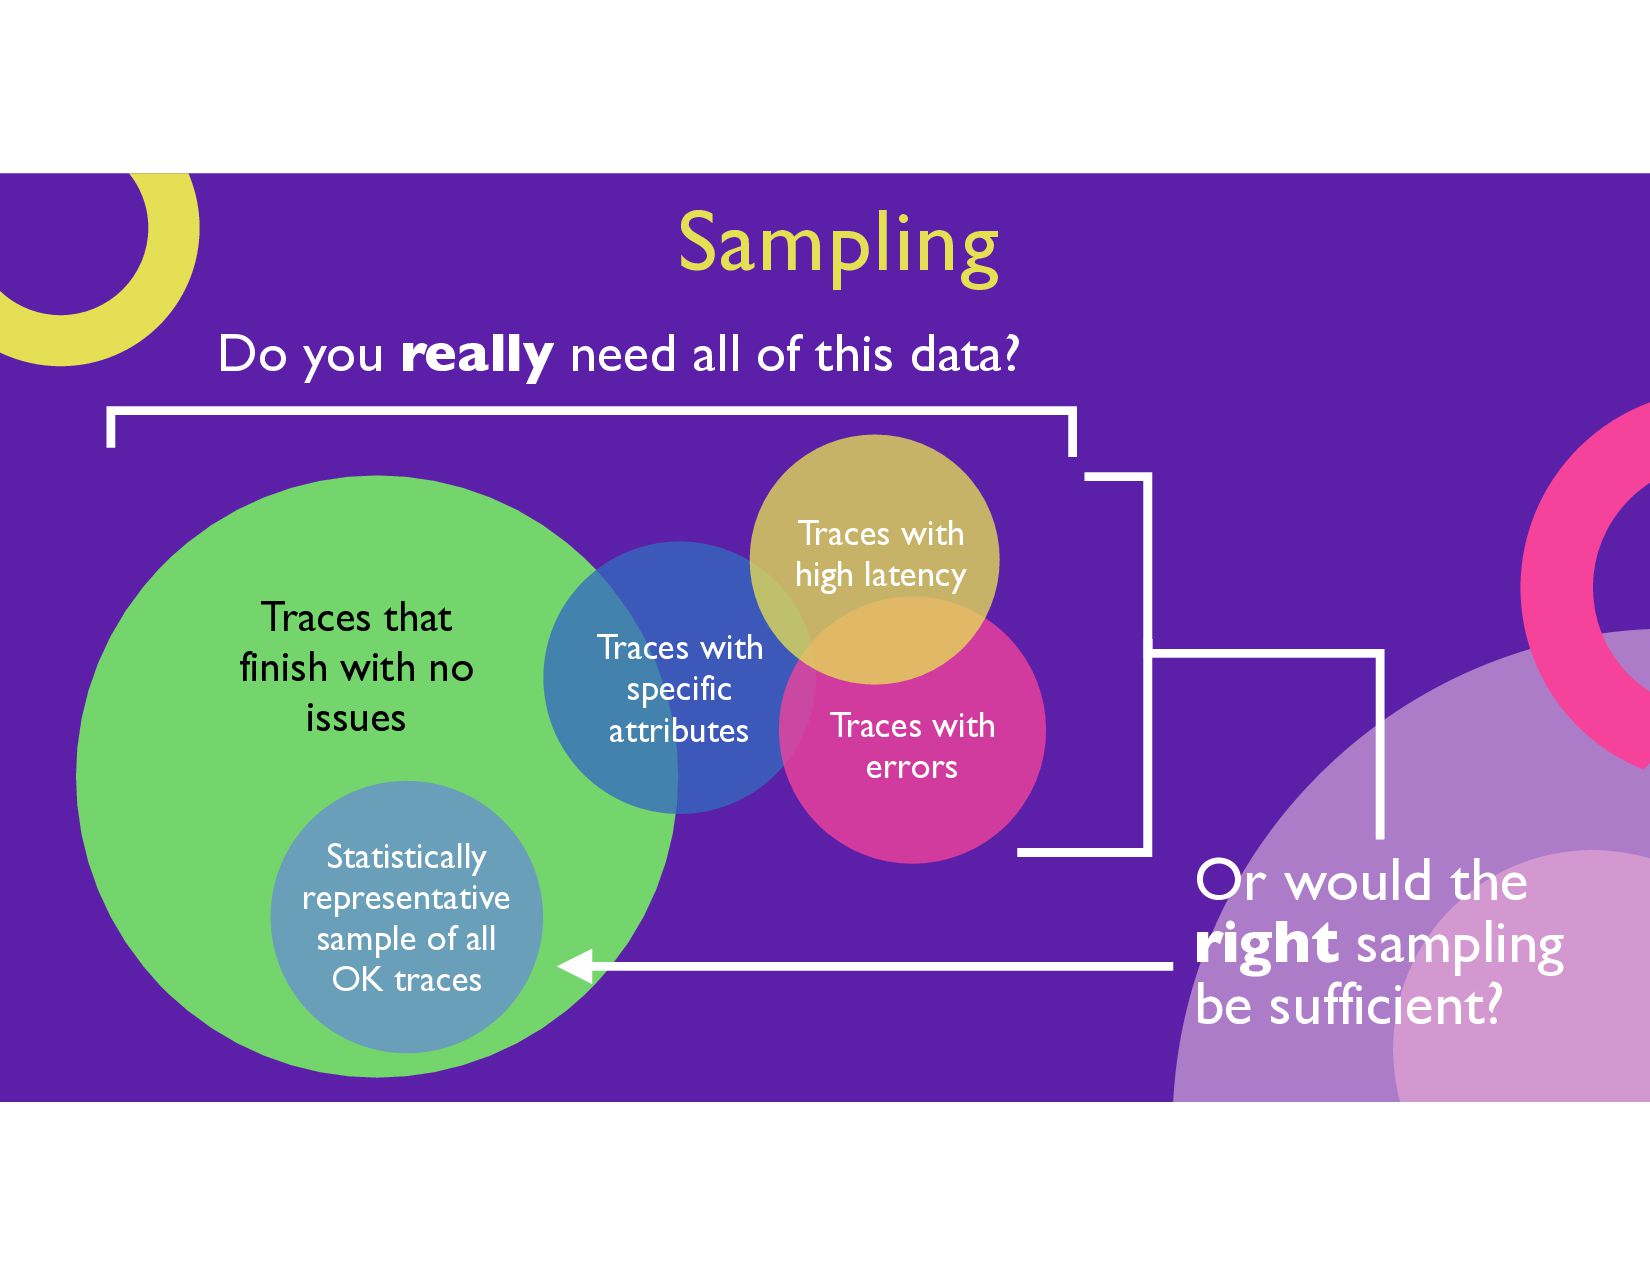
    of all OK traces Traces with errors Traces with high latency Or would the right sampling be sufficient? Do you really need all of this data? Traces with specific attributes
  8. How to? OpenTelemetry is a collection of APIs, SDKs, and

    tools. Use it to instrument, generate, collect, and export telemetry data (metrics, logs, and traces). Helps you analyze your software’s performance and behavior.
  9. Example trace.set_tracer_provider( TracerProvider(resource=Resource.create({SERVICE_NAME: "ecommerce-web-service"})) ) app = Flask(__name__) FlaskInstrumentor().instrument_app(app) RequestsInstrumentor().instrument()

    jaeger_exporter = JaegerExporter(agent_host_name="jaeger", agent_port=6831) trace.get_tracer_provider().add_span_processor(BatchSpanProcessor(jaeger_exporter)) products_api_url = os.environ.get("PRODUCTS_API_URL") tracer = trace.get_tracer(__name__) @app.get("/") def index(): with tracer.start_as_current_span("/ GET"): with tracer.start_as_current_span("/ products"): r = requests.get(products_api_url) items = r.json()["items"] return render_template("index.html", items=items) if __name__ == "__main__": app.run(debug=os.environ.get("DEBUG") or True, host="0.0.0.0", port=5001)
  10. Example trace.set_tracer_provider( TracerProvider(resource=Resource.create({SERVICE_NAME: "ecommerce-web-service"})) ) app = Flask(__name__) FlaskInstrumentor().instrument_app(app) RequestsInstrumentor().instrument()

    jaeger_exporter = JaegerExporter(agent_host_name="jaeger", agent_port=6831) trace.get_tracer_provider().add_span_processor(BatchSpanProcessor(jaeger_exporter)) products_api_url = os.environ.get("PRODUCTS_API_URL") tracer = trace.get_tracer(__name__) @app.get("/") def index(): with tracer.start_as_current_span("/ GET"): with tracer.start_as_current_span("/ products"): r = requests.get(products_api_url) items = r.json()["items"] return render_template("index.html", items=items) if __name__ == "__main__": app.run(debug=os.environ.get("DEBUG") or True, host="0.0.0.0", port=5001) Manually sent to backend