Upgrade to Pro — share decks privately, control downloads, hide ads and more …

Interactive plot with django and highchart JS (without JS)

Interactive plot with django and highchart JS (without JS)

ernestoarbitrio

April 17, 2016
Tweet

More Decks by ernestoarbitrio

Other Decks in Technology

Transcript

  1. whoami “Tech researcher at FBK” “Python enthusiast, stuff mixer, Earl

    J. Hickey double” email: [email protected] twitter: @earbitrio github.com/ernestoarbitrio
  2. PLOT LIBRARIES • Google charts • D3JS • Flot •

    Chart.js • Bokeh What I considered
  3. RESIGNED TO USE JS …. BUT WHY HIGHCHARTS? • Great

    interactivity • Several plot types (box plot, bubble, meteogram, speedometers, etc…) • Good DOCS • Cheap licensing costs (FREE FOR NON-COMMERCIAL) • Easy customization • Internationalization
  4. DJANGO-HIGHCHARTS “Generate charts in your Django application using Highcharts helpers”

    https://github.com/ernestoarbitrio/django-highcharts • Area charts • Bar charts • Heatmap charts • Polar Spider web charts • HighStock basic charts • Pie with drilldown • 3D Pie Options • Speedometer charts • Multiple Axes charts (Combined plots)
  5. class HighChartsBasicView(JSONResponseMixin, AjaxResponseMixin): title = None title_style = None subtitle

    = None chart_type = None ... def get_data(self): data = dict() ... return data def get(self, request, *args, **kwargs): return self.get_ajax(request, *args, **kwargs) def get_ajax(self, request, *args, **kwargs): return self.render_json_response(self.get_data()) FROM django-braces JSONResponseMixin """ A mixin that allows you to easily serialize simple data such as a dict or Django models. """ AjaxResponseMixin """ Mixin allows you to define alternative methods for ajax requests. Similar to the normal get, post, and put methods, you can use get_ajax, post_ajax, and put_ajax. """ INTERNALS
  6. INTERNALS class HighChartsDualAxisView(HighChartsBasicView): y_axis = {} y_axis_title = None def

    get_data(self): data = super(HighChartsDualAxisView, self).get_data() data['xAxis'] = {} data['yAxis'] = self.y_axis data['yAxis']['title'] = {"text": self.y_axis_title} return data DualAxisView Class for a standard XY plot
  7. AREA CHART CLASS from django.views.generic import View from highcharts.views.common import

    HighChartsDualAxisView class HighChartsAreaView(HighChartsDualAxisView, View): chart_type = 'area' _series = [] def get_data(self): data = super(HighChartsAreaView, self).get_data() data['series'] = self.series return data @property def series(self): return self._series @series.setter def series(self, value): self._series = value According to Highcharts API DOCs Setter decorator encapsulates the private attribute self._series. In this way I can redefine the series attr within the get_data method
  8. EXAMPLE OF USAGE (AREA) class DemoAreaView(HighChartsAreaView): title = 'area test'

    subtitle = 'test' chart = {'zoomType': 'xy'} @property def series(self): series = [ { 'name': 'Incoming', 'data': random.sample(range(10,60), 14), 'tooltip': "{ valueSuffix: ' euro' }" } ] return series
  9. EXAMPLE OF USAGE (AREA) class DemoAreaView(HighChartsAreaView): title = 'area test'

    subtitle = 'test' chart = {'zoomType': 'xy'} def get_data(self): try: obj = MyModel.objects.value_list('a').filter(field=self.kwargs['a1']) self.series = [{'name': 'Incoming', 'data': obj, 'tooltip': "{ valueSuffix: ' euro' }"}] except MyModel.DoesNotExist: self.series = None data = super(DemoAreaView, self).get_data() return data
  10. EXAMPLE OF USAGE (PIE CHART WITH DRILLDOWN) class PieDrilldown(HighChartsPieView): title

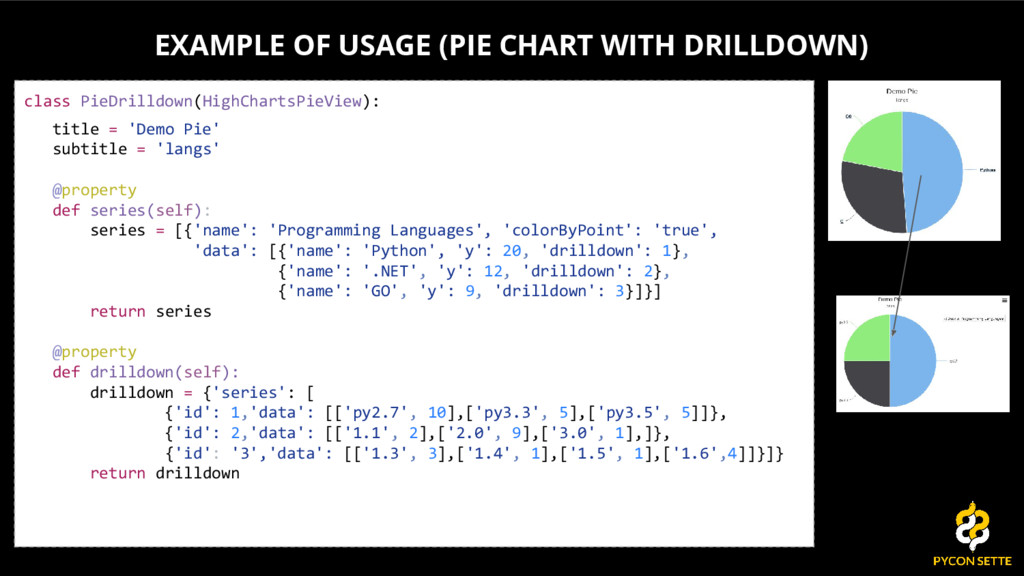
    = 'Demo Pie' subtitle = 'langs' @property def series(self): series = [{'name': 'Programming Languages', 'colorByPoint': 'true', 'data': [{'name': 'Python', 'y': 20, 'drilldown': 1}, {'name': '.NET', 'y': 12, 'drilldown': 2}, {'name': 'GO', 'y': 9, 'drilldown': 3}]}] return series @property def drilldown(self): drilldown = {'series': [ {'id': 1,'data': [['py2.7', 10],['py3.3', 5],['py3.5', 5]]}, {'id': 2,'data': [['1.1', 2],['2.0', 9],['3.0', 1],]}, {'id': '3','data': [['1.3', 3],['1.4', 1],['1.5', 1],['1.6',4]]}]} return drilldown
  11. ADDING OPTIONS TO THE CHART EXAMPLE title = 'My demo

    chart' subtitle = 'Data from 1970-1990' chart = {'zoomType': 'xy'} tooltip = {'shared': 'true'} legend = {'layout': 'horizontal', 'align': 'left', 'x': 60, 'verticalAlign': 'top', 'y': 5, 'floating': 'true', 'borderWidth': 1} title = None title_style = None subtitle = None tooltip = None tooltip_point_format = None plot_options = {} chart = {} legend = True credits = {} coloraxis = {} exporting = {} class attributes = general chart attributes Refer to Highcharts API documentation
  12. ADDING OPTIONS TO THE CHART e.g. if you want to

    change the chart subtitle according to the request data... class DemoChartView(HighChartsMultiAxesView): title = 'Trend with demo data' subtitle = 'Period ????-????' def get_data(self): p1 = self.request.GET['p1'] p2 = self.request.GET['p2'] self.subtitle = 'Period {0}-{1}'.format(p1, p2) ... data = super(DemoChartView, self).get_data() return data
  13. DJANGO PROJECT INTEGRATION 1/3 polls/ __init__.py admin.py apps.py graphs.py migrations/

    __init__.py models.py tests.py urls.py views.py Separate graphs classes view from standard views from django.conf.urls import patterns, include, url from .views import MainView from .graphs import DemoChart1, DemoChart2 urlpatterns = [ url(r'^$', view=MainView.as_view(), name='main') # plot urls url(r'^plot1/$', view=DemoChart1.as_view(), name='plot1') url(r'^plot2/$', view=DemoChart2.as_view(), name='plot2') ]
  14. DJANGO PROJECT INTEGRATION 2/3 {% load staticfiles %} {% load

    highcharts_tags %} <html lang="en"> <head> <meta charset="UTF-8"> ... </head> <body> … {% highcharts_js 1 0 0 0 %} {% set_highcharts_theme "dark-unica" %} </body> </html> Load the custom template tags for django-highcharts helper Inclusion tag for mandatory and optionals (e.g. exporting, extras, 3d, highstock) Highcharts JS components Inclusion tag for chart theme selection
  15. DJANGO PROJECT INTEGRATION 3/3 <div id="container" style="height: 400px; margin: 0

    auto"></div> <script> $(function () { $.getJSON("{% url 'plot1' %}", function(data) { $('#container').highcharts(data); }); }); </script> Render the chart in the specified container
  16. USER ACCESS CONTROL sdfdf class AdvancedTrendGroupChart(LoginRequiredMixin, HighChartsMultiAxesView): <your block code>

    Each plot class can be protected by standard or custom Django AccessMixin classes
  17. not sure if to say thank you for your attention

    or thank you for staying awake BTW: ENJOY THE CONFERENCE Questions? Suggestions? Pull requests? we’re hiring