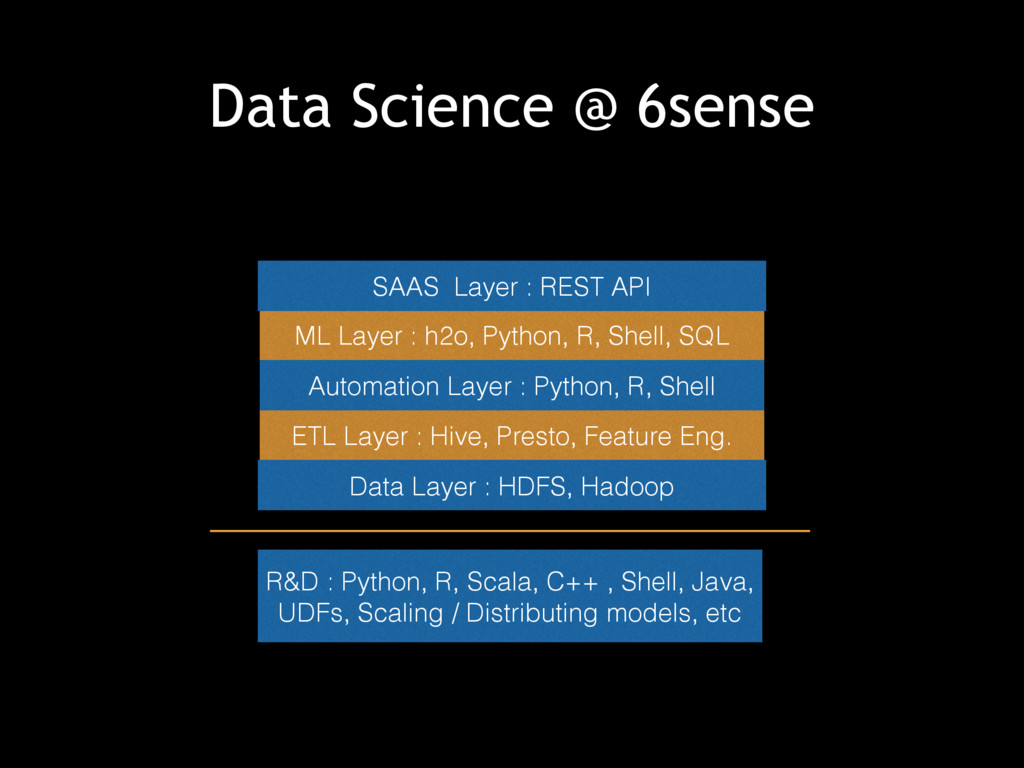
predictive intelligence engine for marketing and sales • Data Science mentor and writer • Background • Physics / Electrical Engineering • Industrial & Systems Engineering
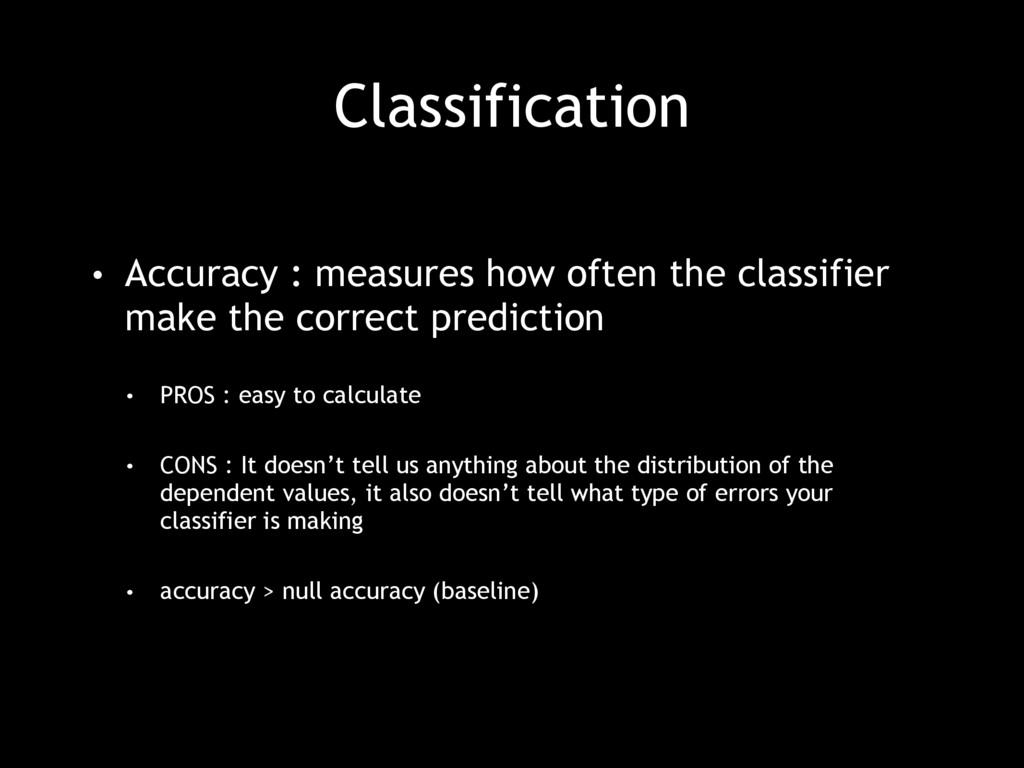
the correct prediction • PROS : easy to calculate • CONS : It doesn’t tell us anything about the distribution of the dependent values, it also doesn’t tell what type of errors your classifier is making • accuracy > null accuracy (baseline)
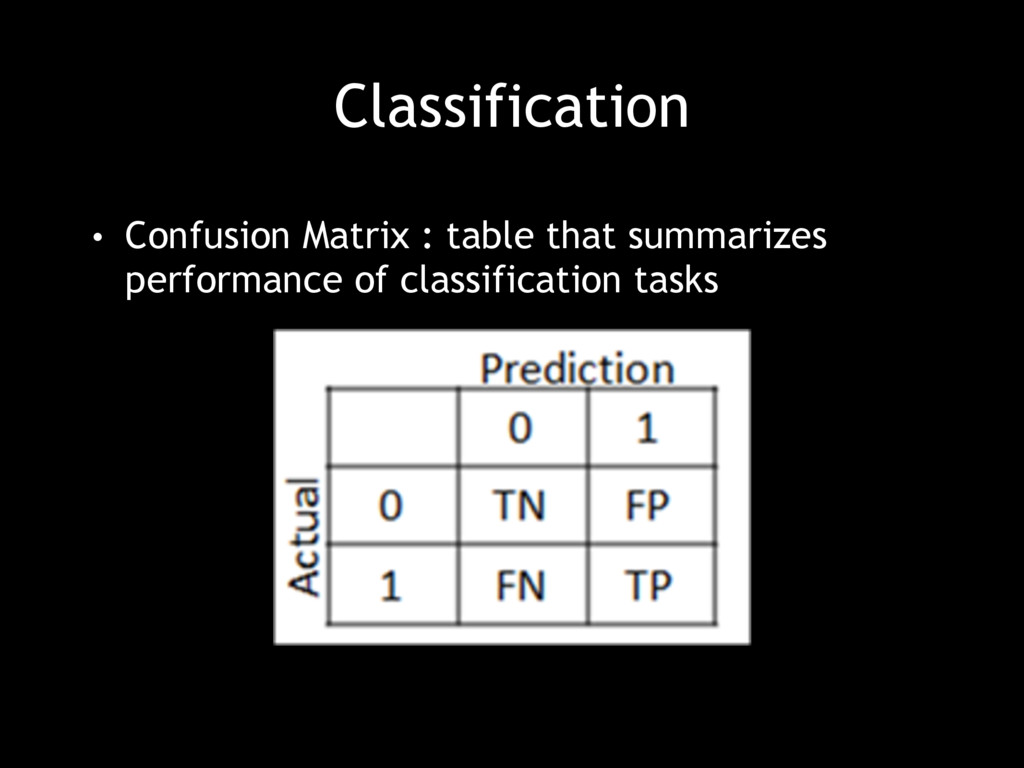
TN + FP +FN) • Error Rate : 1 - Accuracy • Sensitivity (TPR / Recall) : When the actual value is +ve, how often is the prediction correct. TP / (FN + TP) • Specificity : When the actual value is -ve, how often is the prediction correct. TN / (TN + FP) • FPR (1 - Specificity ) : When the actual value is -ve, how often is the prediction incorrect. FP / (TN + FP) • Precision : When a +ve value is predicted, how often is the prediction correct TP / (FP + TP) • f1-score : harmonic mean of Precision and Recall. (2*P*R) / (P + R ) • MCC : correlation coefficient between observed / predicted results [-1, +1]
vs FPR (1 - Specificity) for every possible classification threshold • PROS : single graph summary of classifier performance, also useful for cases of high class imbalance, enables you to understand the tradeoff in classifier performance • CONS : less interpretable for multi-class problems , sometimes doesn’t tell the entire story
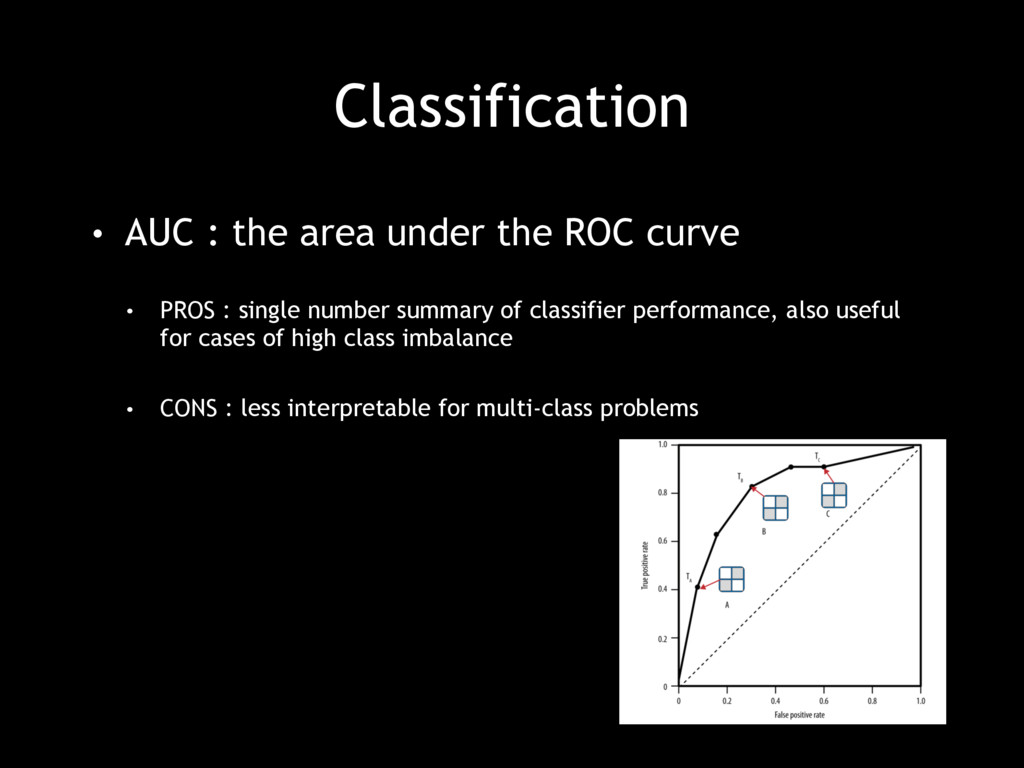
• PROS : single number summary of classifier performance, also useful for cases of high class imbalance • CONS : less interpretable for multi-class problems
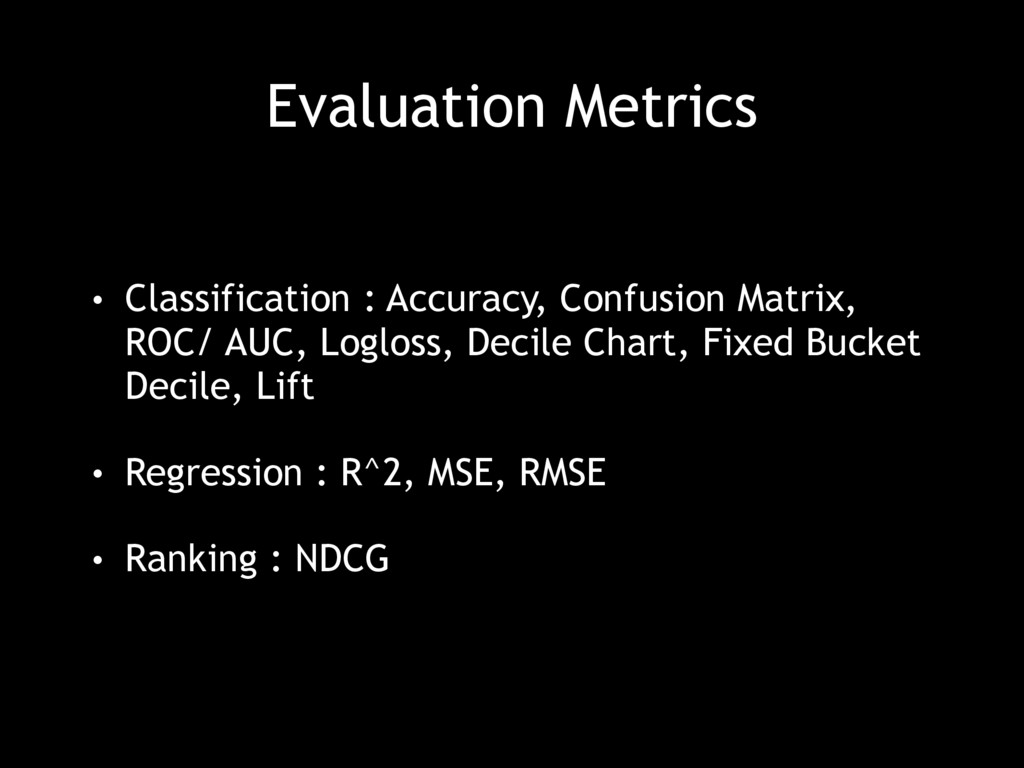
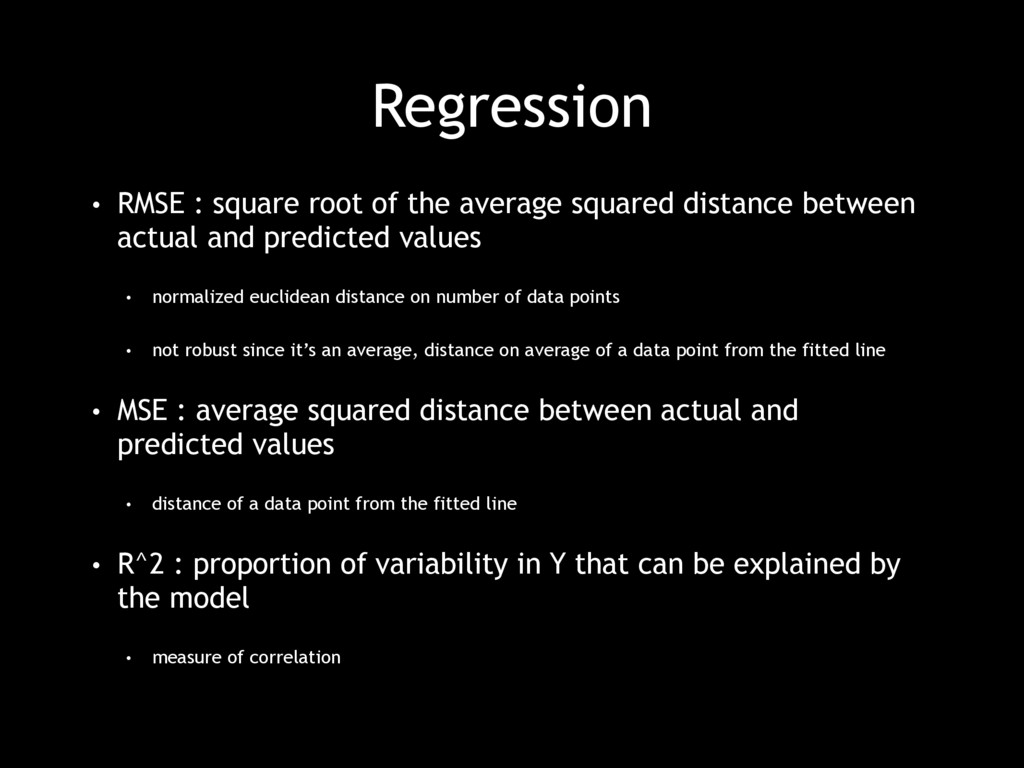
distance between actual and predicted values • normalized euclidean distance on number of data points • not robust since it’s an average, distance on average of a data point from the fitted line • MSE : average squared distance between actual and predicted values • distance of a data point from the fitted line • R^2 : proportion of variability in Y that can be explained by the model • measure of correlation
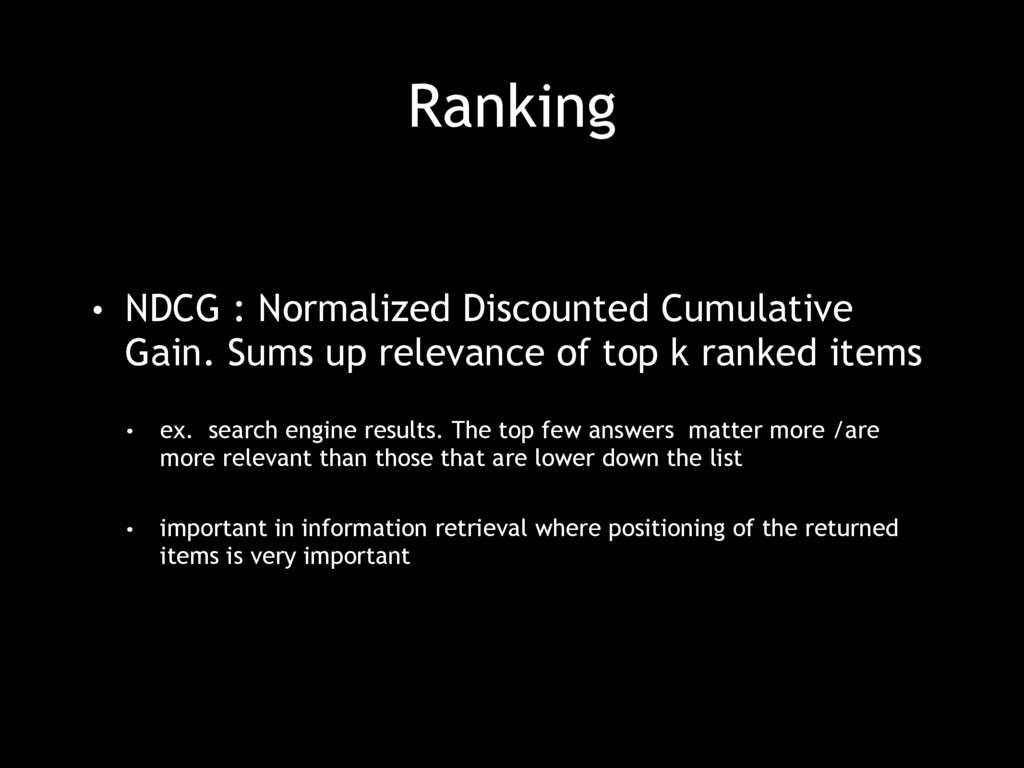
relevance of top k ranked items • ex. search engine results. The top few answers matter more /are more relevant than those that are lower down the list • important in information retrieval where positioning of the returned items is very important
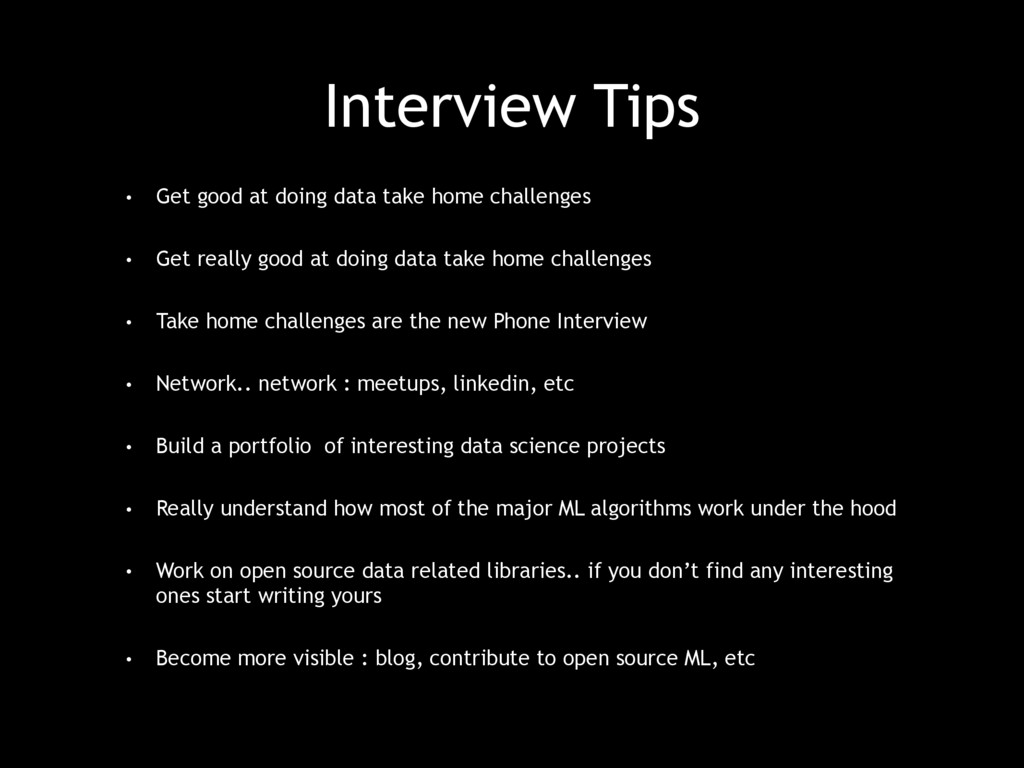
challenges • Get really good at doing data take home challenges • Take home challenges are the new Phone Interview • Network.. network : meetups, linkedin, etc • Build a portfolio of interesting data science projects • Really understand how most of the major ML algorithms work under the hood • Work on open source data related libraries.. if you don’t find any interesting ones start writing yours • Become more visible : blog, contribute to open source ML, etc